Business Intelligence
How to Make Data a Competitive Advantage in Your SaaS
How SaaS teams use live warehouse connections, a semantic layer, AI queries, and embedded analytics to turn data into a growth-driving advantage.
Data is the key to success in SaaS, but most companies don't use it effectively. 73% of enterprise data goes untouched, and inconsistent metrics or siloed systems often cause more problems than solutions. The good news? By following these steps, you can transform your data into a tool for growth:
Connect live data from your warehouse for real-time insights.
Use a semantic layer to standardize metrics and eliminate confusion.
Leverage AI-powered natural language queries to make data accessible to everyone.
Focus on KPIs that align with your business goals to track meaningful progress.
Share insights through live dashboards and automated reports for quick decision-making.
Integrate customer-facing analytics into your product to deliver value directly to customers.
Scale securely with enterprise controls to protect data and ensure compliance.
Companies leading with data report 89% higher customer acquisition and retention and 41% faster time to market. By addressing common barriers like inconsistent metrics, technical bottlenecks, and governance issues, you can build a streamlined, data-driven operation that drives growth and profitability.
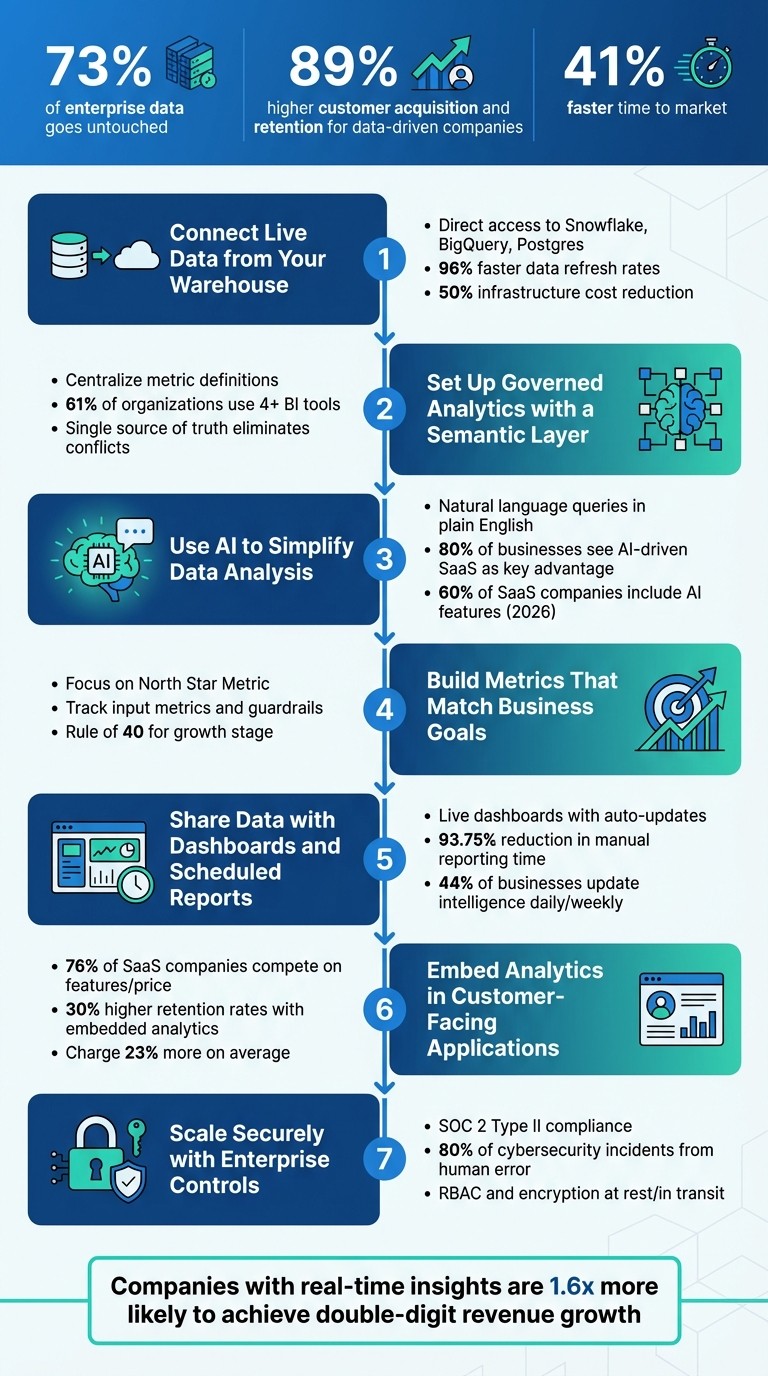
7 Steps to Transform Data into a SaaS Competitive Advantage
Your proprietary data is your competitive advantage | Accenture
Step 1: Connect Live Data from Your Warehouse
To make smart, data-driven decisions, you need direct access to your data warehouse. Forget about relying on spreadsheets or overnight batch jobs - SaaS teams thrive on live connections to platforms like Snowflake, BigQuery, and Postgres. Querio simplifies this by using read-only credentials, allowing analytics queries without touching production data. This approach eliminates the delays caused by manual exports and the modern analytics stack.
Take VodafoneZiggo, for example. When they transitioned to a modern cloud data platform in July 2025, they achieved over 96% faster data refresh rates and slashed infrastructure costs by 50%[3]. That kind of speed is a game-changer for real-time analytics.
Setting Up Secure Connections
When connecting to live data, security is non-negotiable. Querio ensures this by using encrypted credentials and RSA private/public key pair authentication to safeguard connection strings and meet compliance standards[7]. For multi-tenant SaaS applications, a "dataset-per-tenant" setup prevents data from leaking between customers. On top of that, VPC Service Controls add another layer of security by blocking unauthorized data access[4].
A great example of secure, centralized access at scale is BlackRock's Aladdin Data Cloud. Handling over 116 billion data points, they partnered with Snowflake in July 2025 to create a platform that delivers timely insights without compromising data integrity[3]. This approach ensures real-time, unified analytics while keeping sensitive data safe.
Why Live Data Access Matters
Live connections create a single source of truth for teams. When marketing and product teams query the same warehouse instead of using separate repositories, inconsistencies disappear. For instance, by querying Apache Iceberg tables directly within their data architecture, companies have reported 43-74% cost savings[3]. The shift from batch processing to real-time streaming is transforming the industry, giving every team member instant access to the insights they need.
Step 2: Set Up Governed Analytics with a Semantic Layer
Once live connections are in place, the next step is to ensure consistency in how metrics are defined. Without a unified framework, teams might interpret key metrics like "monthly recurring revenue" or "active users" differently. This can lead to conflicting reports and endless debates over which numbers are accurate.
A semantic layer solves this issue by centralizing metric definitions in a modeling layer. In Querio, for example, you can define joins, measures, and business terms just once. These definitions automatically apply to every dashboard, report, and analysis. If a metric changes, it updates across the board, eliminating the need to manually revise each report.
Creating a Shared Context
The semantic layer translates raw data into clear, standardized business terms. By defining entities, measures, and dimensions in one place, you create a consistent foundation for all your analyses. Here’s how it works:
Entities: Represent tables and their relationships, such as
customer_idororder_id.Measures: Include aggregations like
sum(revenue)orcount(users).Dimensions: Define attributes for slicing data, like
regionorsignup_date[10][11].
"Moving metric definitions out of the BI layer and into the modeling layer allows data teams to feel confident that different business units are working from the same metric definitions, regardless of their tool of choice." – dbt Labs [9]
Take Aiven, for instance, an open-source AI and data platform. In 2024, their data team managed over 900 dbt models, creating a complex web of dependencies. By integrating core metrics into a unified model, they reduced this complexity to a handful of streamlined data products. This approach, guided by the DRY (Don't Repeat Yourself) principle, simplified their codebase, minimized errors, and improved collaboration [5][8].
Enhancing Consistency and Collaboration
A shared semantic layer transforms discussions from questioning data accuracy to focusing on actionable insights. When teams like marketing and finance rely on the same centralized definitions, trust grows, and friction fades. This is especially critical given that over 61% of organizations use four or more BI tools - and 25% use ten or more. Without a semantic layer, these tools often generate conflicting results [10].
Organizations with advanced data practices report a 41% faster time to market and an 89% boost in customer acquisition and retention [2]. For example, Lunar, a Danish fintech company, ensures consistency by holding quarterly meetings with its CEO, CTO, and Chief Risk Officer to update key metrics. This governance framework ensures executive alignment and keeps everyone focused on the same priorities [5]. By centralizing metric definitions, companies can move faster while maintaining clarity and trust.
Step 3: Use AI to Simplify Data Analysis
Once you’ve established a semantic layer, the next move is making data accessible to everyone - giving non-technical users the tools to find answers quickly without needing to learn SQL. Instead of waiting for custom reports, teams can simply ask questions in plain English and get instant results. This is where AI-powered natural language queries come into play, offering a real edge.
Querio’s AI agents handle the heavy lifting by automatically translating natural language questions into accurate SQL or Python code. This eliminates the "analyst bottleneck" that often slows decision-making. Recent data highlights this shift: 80% of businesses see AI-driven SaaS as a key advantage, and over 60% of SaaS companies now include AI-powered features as of 2026 [13][14]. By enabling natural language queries, every team member can access data insights without technical hurdles.
Natural Language Queries for Non-Technical Teams
The beauty of natural language processing is how it opens up data access to everyone. Whether it’s a marketing manager, sales leader, or executive, they can ask straightforward questions like, "What were Q3 sales by region?" or "Which customer segments have the highest churn?" - no coding required. The AI instantly translates these queries into SQL or Python, runs them on live data, and delivers results in seconds.
This removes technical barriers and enables real-time decision-making. Instead of waiting for static quarterly reports, teams can react to market changes as they happen. Lisa Schwarz, Senior Director of Global Product Marketing at NetSuite, puts it perfectly:
"AI can help businesses of all sizes become more data-driven in their decision-making, fulfilling a long-sought goal" [15].
For SaaS companies, this means quicker pivots, sharper customer insights, and a competitive edge over businesses still stuck in manual reporting cycles.
Transparent and Reliable Results
Ease of use is important, but trust in the results is just as critical. Querio ensures transparency by making all AI-generated queries fully visible. When the AI translates a question into SQL or Python, users can inspect the code to verify its logic. This transparency builds trust and allows technical users to refine or validate queries when necessary.
This approach, often called "explainable AI", is essential for high-stakes decisions. Querio avoids the pitfalls of treating AI as a black box. Instead, it ensures every insight is inspectable and governed. The AI operates within the semantic layer you’ve already set up, meaning it uses consistent metrics and business terms across all queries. This ensures that teams like marketing and finance are aligned, working from the same trusted data source - even if they’re asking different questions in their own words.
Step 4: Build Metrics That Match Business Goals
With AI-powered queries offering dependable insights, it’s time to zero in on tracking the KPIs that truly matter for your business. Many SaaS companies fall into the trap of monitoring too many metrics, often overlooking the ones that genuinely influence growth. The key is to identify a focused set of KPIs that directly impact revenue, customer retention, or operational efficiency.
Adam Singer from Google puts it succinctly:
"Number 1 way to getting actionable KPIs is starting with the end objective in mind and backing out what metrics accomplish this from there" [16]. This process is increasingly streamlined by AI tools for smarter KPI target setting that use historical data to predict achievable goals.
This approach flips the traditional method - starting with your ultimate goals and working backward to identify the metrics that signal progress. It helps cut through the noise, ensuring you focus on what really drives success.
Choosing the Right KPIs for SaaS
The KPIs you track will naturally evolve as your company grows. Early on, during the product stage, metrics like Net Promoter Score (NPS) can help validate product-market fit. As you shift to the growth stage, you might focus on the Rule of 40 (your growth rate plus profit margin should equal or exceed 40%). Later, in the efficiency stage, metrics like the LTV:CAC ratio (aiming for a 3:1 ratio) become essential for sustainable scaling [16].
Start by defining your North Star Metric - the one that best reflects your product’s value. From there, identify the input metrics that drive it and the guardrail metrics that ensure long-term stability. For example, if your North Star Metric is Monthly Recurring Revenue (MRR), input metrics might include new customer signups and expansion revenue, while churn rate acts as a critical guardrail. Alex Clemmons from Cardinal Path offers sound advice:
"Less is more – you really only want a few KPIs as the more you have, the harder it becomes to know what you should pay attention to and what's just noise…" [16].
By keeping your KPIs focused, you’ll maintain clarity on what truly matters as your business grows.
Refining Metrics Over Time
Metrics aren’t set in stone. As your business evolves, some KPIs will lose relevance, while others will take center stage. Querio’s flexible notebook environment allows you to test, validate, and refine your KPIs in real time using tools like SQL or Python. You can also document these definitions alongside your code, ensuring every KPI aligns with the SMART criteria [16].
Marisha Sesto from Klipfolio emphasizes:
"A KPI is only as valuable as the action it inspires" [16].
Regularly evaluate your metrics to ensure they continue to drive meaningful action. Replace those that no longer serve your goals and focus on KPIs that push your business forward [16]. By aligning your metrics with your objectives, you’ll create a solid foundation for dynamic dashboards and reports that follow.
Step 5: Share Data with Dashboards and Scheduled Reports
After identifying the right KPIs, the next step is to ensure that the relevant data reaches the right people efficiently. Live dashboards and automated reports make this process seamless by delivering real-time insights on a regular schedule, eliminating the need for manual data extraction.
With live data integration, these tools ensure that dashboards and reports always reflect the most up-to-date business conditions. This not only simplifies AI reporting for SaaS but also enables quicker, more informed decision-making.
Creating Live Dashboards
Querio’s intuitive drag-and-drop builder allows users to easily create visualizations and add contextual text. Charts generated through natural language queries can be saved directly to dashboards. Since these dashboards are connected to your data warehouse, they automatically update metrics, eliminating the need for manual refreshes.
For instance, Lumen drastically cut the time spent on sales summary reports - from 4 hours per seller to just 15 minutes - by automating their reporting with Querio. That’s a 93.75% reduction in manual effort. Similarly, Midwest Precision Manufacturing saved around $45,000 annually by using real-time dashboards to track equipment downtime and monitor manufacturing systems [18].
While live dashboards provide instant insights, automated reports help maintain consistent performance tracking.
Automating Scheduled Reports
Scheduled reports ensure teams receive regular updates through email or Slack, reducing errors and keeping everyone on the same page. As Ted Friedman from Gartner explains:
"Data and analytics leaders need to understand the business priorities and challenges of their organisation. Only then will they be in the right position to create compelling business cases that connect data quality improvement with key business priorities" [17].
Interestingly, 44% of businesses now update their competitive intelligence resources daily or weekly to keep up with rapidly changing markets [12]. By automating reporting workflows, teams can shift their focus from routine monitoring to deeper strategic analysis, allowing them to concentrate on initiatives that truly drive growth.
Step 6: Embed Analytics in Customer-Facing Applications
Embedded analytics can transform your SaaS product into a powerful, data-driven experience. By offering insights directly within your application, you're not just providing software - you’re delivering actionable outcomes that strengthen customer loyalty and support premium pricing.
76% of SaaS companies compete primarily on features and price, which often leads to market saturation and commoditization [19]. However, businesses that focus on experience-driven advantages, like embedded analytics tools, achieve over 30% higher retention rates and can charge 23% more on average [19]. By integrating analytics into your product, you give customers real-time, actionable insights that add measurable value.
Delivering Immediate Insights for Customers
With embedded analytics, customers no longer need to export data or juggle multiple tools to monitor usage and spending. Instead, they can act on insights directly within your application, streamlining the decision-making process [20].
For example, in 2024, HubX successfully retained 63% of customers flagged as at risk of churn, recovering $106,000 in potential lost revenue by offering personalized, embedded insights. Similarly, Intercom's Fin AI adopted outcome-based pricing by tracking metrics like "successful ticket resolutions" [21]. Querio's approach to embedded analytics allows businesses to reuse the governed logic of internal dashboards in customer-facing applications. This means customers gain access to clear, consistent data on usage, spending, and performance - fostering trust and eliminating billing surprises.
Ensuring Consistency in Customer-Facing Analytics
Just as governed analytics maintain consistency within your organization, they’re equally important for customer-facing data. Misaligned metrics can cause confusion and damage trust when different teams - like sales, support, and customer success - reference conflicting numbers.
Querio addresses this challenge with its semantic layer, ensuring that embedded analytics pull from the same definitions and logic as your internal dashboards. For instance, once you define a metric like "monthly active users" or "feature adoption rate" in the shared context layer, that definition applies universally - whether viewed internally or by your customers. This consistency creates a single source of truth, aligning your organization and your customer base under the same reliable data framework.
Step 7: Scale Securely with Enterprise Controls
As your SaaS business grows, so do your analytics needs. More users, data sources, and customer applications mean greater complexity - and with it, greater risk. In fact, human error is behind 80% of all cybersecurity incidents [2], and 32% of companies using Salesforce experience significant accidental data losses at least once a month [22]. To scale successfully, companies must integrate security and governance into their analytics infrastructure from the very beginning. Without strong controls, the risks can quickly outweigh the rewards.
Protecting Data Security and Privacy
Querio takes data security seriously, adhering to SOC 2 Type II standards to ensure security, availability, and integrity [23]. All data is encrypted both in transit and at rest, safeguarding it from unauthorized access [2][23]. Role-based access controls (RBAC) further enhance security by enforcing the principle of least privilege - users only have access to the data they need for their specific roles [25][2]. This minimizes the risk of both external breaches and internal misuse [23].
The platform also supports compliance with key regulations like GDPR, CCPA, and HIPAA, and holds ISO certifications (ISO 27001, 27017, 27018) [23]. To protect sensitive data, Querio uses machine learning for automated data classification, identifying and restricting access to Personally Identifiable Information (PII) and Sensitive Personal Information (SPI) [23]. Naveen Avalareddy, Former VP of Enterprise Data and Insights at Amplitude, underscores the importance of secure practices:
"If you can't trust your data, if your practices are opening the company up to risk... you won't be able to use your data strategically" [23].
Scaling Analytics as Your Business Grows
Securing your data is just one piece of the puzzle - your analytics must also scale to meet growing demands. Querio's warehouse-native architecture integrates seamlessly with platforms like Snowflake, BigQuery, and Postgres, ensuring your infrastructure can handle increasing data volumes and more users [26]. As more teams adopt analytics, the platform grows with you, maintaining performance and reliability.
Governance policies scale effortlessly thanks to AI semantic layer. Once you define a metric or access rule, it applies consistently across all dashboards, reports, and embedded analytics. This ensures that as your analytics expand, policies remain intact without requiring additional manual effort.
To further support secure scaling, audit logs monitor for anomalies and help maintain compliance readiness [24][27]. By combining robust security, automation, and centralized governance, Querio allows your analytics capabilities to grow without introducing new risks or operational headaches.
Conclusion: Making Data Your Competitive Edge
Data isn't just a resource - it's the backbone of success for SaaS companies. Businesses leveraging real-time insights are 1.6 times more likely to achieve double-digit revenue growth [28]. The gap between industry leaders and those struggling to keep up often boils down to one thing: how well they convert raw data into actionable insights.
This guide outlined seven steps to elevate analytics from basic reporting to a powerful strategic tool. By using live data, governed metrics, AI-driven analysis, and secure scalability, teams can make quicker, smarter decisions without compromising on accuracy or control.
Key Takeaways
The best-performing SaaS companies share three key traits when it comes to their data strategies.
Real-time access beats static reports: Teams equipped with live data can respond to changes quickly, influencing outcomes before it's too late.
A single source of truth matters: Governed semantic layers prevent departments like Finance and Marketing from clashing over conflicting KPIs [28][6].
Analytics for everyone: AI-powered natural language queries let non-technical employees explore data independently, cutting down delays caused by waiting on SQL experts [28][29].
By 2026, 40% of analytics queries will likely be created through natural language [28], and 80% of employees are expected to access insights directly within their business tools [28]. Embracing these trends early helps build a lasting competitive advantage. Proprietary insights can refine products, lower customer acquisition costs, and boost retention rates [1].
Armed with these insights, it's time to take action.
Next Steps for SaaS Teams
Now’s the time to ensure your data becomes your strongest competitive asset. Querio offers tools like live connections, AI-driven analysis, governed metrics, and embedded analytics - all built on a SOC 2 Type II compliant platform. With Querio, you can ask questions in plain English and get reliable, SQL- and Python-backed answers.
The top SaaS companies aren't just amassing data - they’re using it smarter, faster, and more strategically. With the right tools and a clear plan, your team can do the same.
FAQs
How do live data connections help SaaS companies make better decisions?
Live data connections give SaaS companies access to real-time insights, enabling teams to spot trends, respond to customer needs, and tackle potential issues before they grow into bigger problems. With constantly updated information at their fingertips, businesses can make quicker, more precise decisions that align with their objectives.
By relying on the latest data, companies can stay ahead of the curve, making them more agile and prepared to thrive in today’s fast-moving market.
How does a semantic layer help maintain consistent data across teams?
A semantic layer plays a crucial role in maintaining consistent data by serving as the single source of truth for your SaaS business. It simplifies complex metrics - like monthly recurring revenue or customer churn rate - by converting them into a standardized, easy-to-understand format. This ensures that every team, whether it's product, marketing, or sales, works with the same numbers, minimizing the chance of discrepancies or conflicting reports.
On top of that, it enforces data governance rules such as row-level security and column masking, while also caching pre-aggregated results to boost performance. By centralizing metric definitions and applying these controls, the semantic layer creates a reliable, unified view of your data. This not only streamlines decision-making but also ensures those decisions are based on accurate, trusted insights across the organization.
How can AI-powered natural language queries help non-technical teams use data effectively?
AI-powered natural language queries make it possible for anyone on your team - even those without technical skills - to interact with data using plain English. No need to master complicated tools or coding languages like SQL. For instance, a marketer could simply ask, "What was our churn rate last month?" and instantly get a clear chart or summary - no engineers required.
This technology bridges the gap across departments like sales, support, and finance by making data easy to access and understand. It doesn’t just deliver visual results; it also provides plain-English explanations, helping users grasp trends and make confident, informed decisions. With instant answers, teams can resolve questions in seconds, freeing up time to focus on strategic work instead of wrestling with manual reporting.
Beyond simple queries, AI-driven analytics tackle more advanced tasks like funnel analysis, A/B testing results, and anomaly detection - all without requiring users to write a single line of code or manage complex data pipelines. This means every team member can use data as a powerful tool to drive smarter decisions and achieve results faster.
Related Blog Posts


