Business Intelligence
Why SaaS Products Are Adding AI Dashboards
AI dashboards make SaaS data accessible to all with plain-English queries, predictive insights, unified metrics, live warehouse connections, and faster decisions.
AI dashboards are transforming SaaS platforms by making data accessible to everyone - not just technical teams. Traditional dashboards often require SQL skills and analysts, leaving only 20% of decision-makers actively using them. AI dashboards solve this by enabling natural language queries, predictive analytics, and real-time insights.
Key benefits include:
Plain English queries: No coding required; users can ask questions like, "Why did churn increase last week?" and get instant answers.
Predictive analytics: Tools forecast trends, detect anomalies, and recommend actions.
Consistency: A semantic layer in business intelligence ensures accurate, unified metrics across teams.
Cost savings: AI reduces reliance on analysts, cutting data costs by up to 20%.
Faster decisions: Insights are delivered in seconds, not days.
SaaS companies using AI dashboards report improved efficiency, reduced churn, and increased revenue. For example, Ivanti saw $18.4M in new revenue by centralizing data, while CallHippo cut churn by 20% using AI tools. These dashboards empower teams to act quickly, breaking down barriers to data-driven decisions.
Problems with Standard Dashboards in SaaS
Too Much Data, Slow Insights
Standard dashboards often bombard users with an overwhelming amount of data, leaving them more confused than informed. SaaS platforms typically pull metrics from various sources - like Snowflake, BigQuery, CRM systems, and ERP platforms - resulting in a flood of information that can obscure the bigger picture. The outcome? Decision paralysis. Faced with endless charts and conflicting data points, teams struggle to pinpoint what truly matters. In fact, 41% of business leaders admit they don't fully understand their data because it's either too complex or inaccessible, highlighting the need for AI data analytics tools for non-technical users.
The bigger issue isn't just confusion - it's the time lost. Extracting actionable insights requires several steps: requesting data, cleaning it, creating visualizations, and interpreting the results. And as John Santaferrara, Analyst and Business Consultant at Ferrara Consulting, puts it:
"Every handoff [in this manual process] adds friction and weeks or even months to the timeline. By the time a decision is made, conditions may have changed, eroding the value of the insight."
This inefficiency comes at a steep cost. Organizations lose an average of $15 million annually due to poor decision-making, with slow dashboards playing a significant role. The overload of data not only clouds critical insights but also creates bottlenecks when technical expertise is needed.
Reliance on Analysts and Technical Skills
Another major hurdle is the heavy dependence on technical specialists. Traditional dashboards often require SQL knowledge or analyst intervention for even the simplest queries. For instance, if a marketing manager wants to understand why conversion rates dipped last month, they have to submit a ticket, wait for an analyst to respond, and hope the resulting report addresses their question. This reliance limits how widely data can be used across the organization.
On top of that, standard dashboards rarely explain how metrics are calculated or why certain trends appear. This lack of transparency leaves non-technical users unsure about the logic behind the numbers, making them hesitant to trust the tools for important decisions. Meanwhile, data teams remain overwhelmed, spending their time on routine requests instead of focusing on strategic analysis.
Inconsistent Metrics and Governance Problems
The challenges don’t stop there. Fragmented reporting methods often lead to inconsistent metrics across teams. Without a unified framework to define key metrics, different departments end up with conflicting reports, causing confusion and eroding trust. Teams waste valuable time reconciling numbers instead of acting on them. A CMGA study found that 80% of respondents admitted to making strategic decisions based on flawed data at least once in the past three years.
Data silos only make matters worse. When information is scattered across dozens of disconnected systems, teams are left working with incomplete views rather than a comprehensive understanding. Despite organizations spending over $29 billion annually on the best AI BI tools for SaaS companies, many executives still struggle to make timely and informed decisions due to inconsistent data and governance issues.
How AI Dashboards Solve These Problems
Plain English Queries for Non-Technical Users
AI dashboards remove the barrier of needing technical skills like SQL or relying on analysts. Instead, they let users ask questions in simple, everyday language. For example, a marketing manager can type, "Why did conversion rates drop last month?" and instantly see a relevant visualization. By shifting from traditional data models and drag-and-drop interfaces to prompt-based workflows, these dashboards make analytics accessible to everyone. A single instruction can now generate an entire dashboard layout, simplifying complex data analysis with modern BI features.
Predictive Analytics and Automated Insights
AI dashboards go beyond answering questions - they anticipate future trends and recommend actions. They don’t just show what happened; they help users understand what might happen next. Instead of manually digging through data, these tools automatically detect anomalies, forecast outcomes, and suggest actions like reallocating marketing budgets or adjusting inventory. Users can even run "what-if" simulations to explore scenarios, such as estimating the impact of a 20% increase in ad spend or a pricing adjustment.
Take Ivanti, for example. In 2025, the company used the AI-powered customer data platform 6Sense to centralize scattered data and track purchase intent signals. The result? A 71% increase in opportunities, a 94% boost in won deals, and $18.4 million in new revenue from AI-targeted campaigns. Similarly, CallHippo leveraged AI-driven conversational intelligence to analyze sales and support calls, cutting customer churn by 20% and gaining a 13% increase in new revenue. These examples highlight how automated insights lead to smarter, proactive decisions.
Semantic Layer for Consistent and Accurate Data
AI dashboards also address the common issue of inconsistent data. A semantic layer acts as the central hub for business logic, metric definitions, and data relationships, ensuring everyone uses the same formulas and filters. For instance, instead of different teams calculating "monthly recurring revenue" in conflicting ways, the semantic layer provides a unified approach. This consistency eliminates the errors that lead to flawed decisions - something that affects 80% of organizations.
Philip Basaric, Product Manager for Data Products at Whip Media, shared his experience:
"AI/BI Dashboards have been an incredibly transformative product... The Dashboards facilitated a consolidation of many internal reporting systems to a single unified system."
Organizations that implement consistent data governance alongside AI tools have reported cutting data costs by up to 20%.
Direct Connections to Live Data Warehouses
Another game-changer is the direct connection to live data warehouses like Snowflake and BigQuery. This eliminates the delays caused by scheduled extracts or manual updates. With AI dashboards, users get real-time insights without waiting for overnight batch processes or dealing with outdated data. Traditional dashboards often focus on past performance, but AI dashboards shift the focus to forward-looking insights. This ability to provide live, automated visualizations from plain English queries helps teams respond faster to evolving business conditions.
Create Dashboards in Seconds With AI (It's Mind-Blowing 🤩)
How Querio's AI Dashboards Stand Out
Querio takes the power of AI dashboards to the next level with solutions designed to meet the unique needs of businesses, combining efficiency with predictive capabilities.
Custom-Built AI Python Notebooks for Deep Analysis
Querio provides a custom-built Python notebook environment that seamlessly integrates Python and SQL within a governed workspace. Unlike modern business intelligence tools, this setup allows data teams and analysts to run advanced analyses while adhering to the same semantic layer and governance rules that drive natural language queries. This ensures a smooth experience for everyone: non-technical users can ask questions in plain English, while technical users can dive into deeper, code-driven analysis - all using unified data definitions. This approach eliminates the trade-off between accessibility and analytical depth and enhances Querio's drag-and-drop dashboards, offering a pathway to even more intuitive, code-free interactions.
Drag-and-Drop Dashboards for Easy KPI Tracking
With Querio, anyone on your team can create dashboards without writing a single line of code. The platform’s drag-and-drop functionality makes it simple to design KPI tracking boards and reports. This empowers teams to generate insights independently, reducing reliance on technical staff. Plus, scheduled reporting ensures executives stay informed by delivering regular updates - no need to log in or search for data manually.
Enterprise Security and Scalability
Querio prioritizes enterprise-level security, offering SOC 2 Type II compliance, a 99.9% uptime SLA, and encrypted, read-only connections to data warehouses like Snowflake, BigQuery, and Postgres. Data remains securely within your warehouse at all times. The platform also includes robust RBAC (Role-Based Access Control) for scalable permission management. Best of all, Querio provides unlimited viewer users, so you can grant access to everyone who needs it without worrying about rising per-user costs as your team expands.
Business Benefits of AI Dashboards in SaaS
Standard Dashboards vs AI-Powered Dashboards Comparison
Lower Costs and Improved Efficiency
AI dashboards significantly cut operational costs by enabling non-technical users to access and interpret data on their own. This reduces the need for analysts to handle routine queries, leading to data cost savings of up to 20%. By automating repetitive reporting tasks, analysts can redirect their focus toward strategic initiatives, speeding up workflows across various teams.
Traditional business intelligence (BI) tools often hit a roadblock, engaging only about 20% of decision-makers due to their technical complexity. AI dashboards remove these barriers, making data accessible to everyone - from product managers to finance teams - without requiring any SQL skills or specialized training. This accessibility naturally enhances operational efficiency and accelerates decision-making processes.
Faster Decisions and Enhanced User Experience
With real-time insights at their fingertips, teams can act immediately. AI dashboards provide answers within seconds instead of hours, directly improving the speed and quality of decisions. The adoption of a data-driven culture has grown significantly, with organizations embracing analytics rising from 21% to 43% in just one year, thanks in large part to Generative AI simplifying data access.
The user experience also gets a major upgrade. Instead of navigating complex systems, users can ask questions in plain English and receive accurate, visually appealing insights instantly. Executives benefit from scheduled reports delivered automatically, eliminating the hassle of logging in or searching for data. This personalized, on-demand access fundamentally changes how teams work day-to-day.
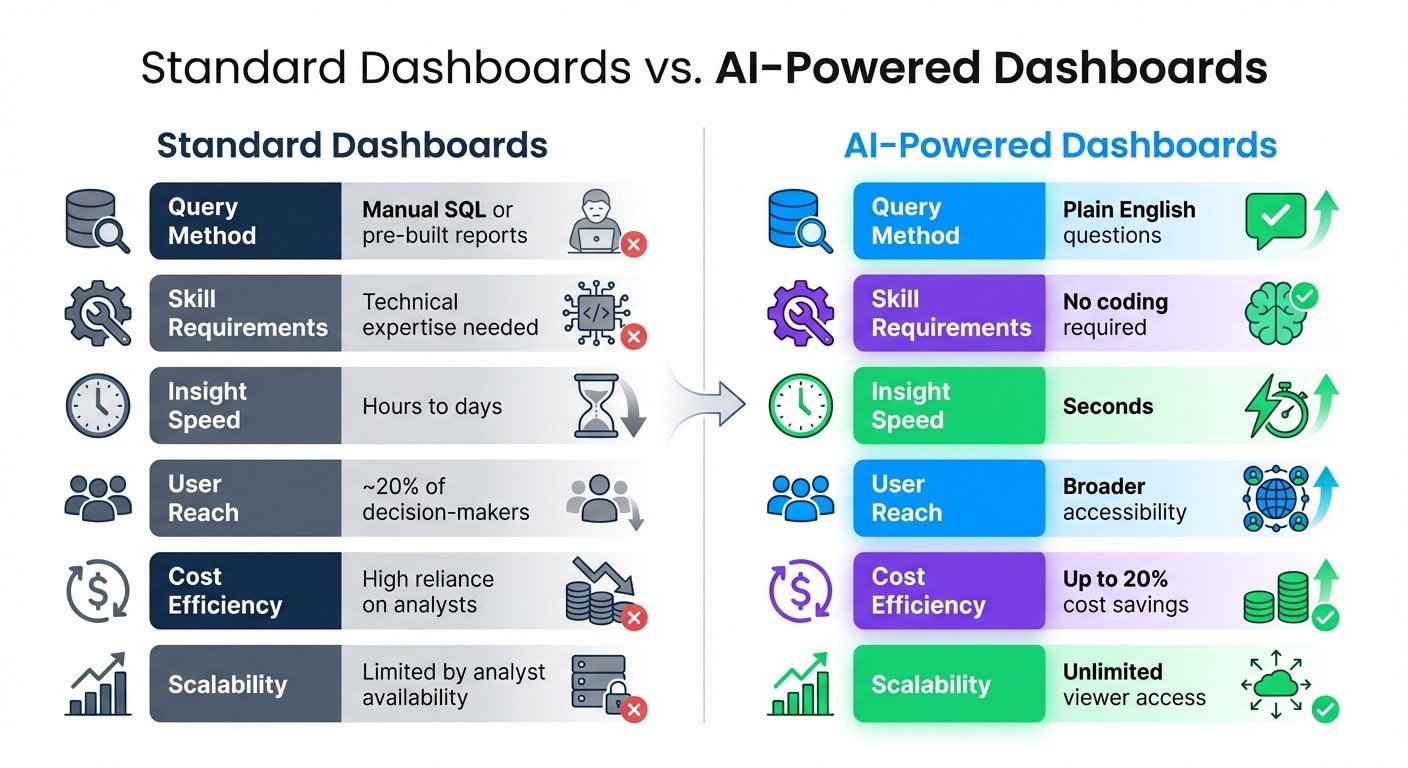
Standard Dashboards vs. AI Dashboards
The advantages of AI dashboards become even clearer when compared to traditional dashboards:
Feature | Standard Dashboards | AI-Powered Dashboards |
|---|---|---|
Query Method | Manual SQL or pre-built reports | Plain English questions |
Skill Requirements | Technical expertise needed | No coding required |
Insight Speed | Hours to days | Seconds |
User Reach | ~20% of decision-makers | Broader accessibility |
Cost Efficiency | High reliance on analysts | Up to 20% cost savings |
Scalability | Limited by analyst availability | Unlimited viewer access |
Conclusion
Key Takeaways for SaaS Leaders
AI dashboards have become a necessity for competitive SaaS platforms. The move away from traditional BI tools - tools that only benefit about 20% of decision-makers - toward AI-powered systems marks a major shift in how businesses operate. These modern tools remove technical hurdles, allowing users to make faster decisions, cut costs, and drive adoption across all departments by enabling plain English queries.
Organizations that successfully implement AI across their operations see real benefits: data costs drop, operational expenses shrink by 30%, and deployment speeds increase by 40%. Instead of waiting hours or days for analyst reports, teams can now access insights in seconds, transforming how decisions are made.
"The question isn't whether AI will reshape software; it's whether SaaS founders will lead this transformation or be swept aside by it." - Marc Steven Schröder, Investor
When rolling out AI-powered analytics to your product, begin with 5–7 business-critical KPIs. Success hinges on team adoption and the ability to deliver faster insights - not just on technical specs. The goal is to make data accessible to everyone, not just a select group of technical experts.
These metrics highlight the importance of solutions tailored to bring AI-powered analytics directly to the teams that need them most.
Querio's Solution for AI-Powered Analytics
Querio offers a unique approach by blending AI-native natural language querying with custom Python notebooks designed for AI agents. This allows non-technical users to ask questions in plain English while giving analysts the tools for deeper, more complex analyses using unified, governed data. With direct integrations to Snowflake, BigQuery, and Postgres, Querio ensures your team works with live data. A semantic layer simplifies context, joins, and business definitions, guaranteeing that every query delivers accurate, consistent results.
Querio also prioritizes ease of use and enterprise-level standards. Features like SOC 2 Type II compliance, unlimited viewer access, and drag-and-drop dashboards for tracking KPIs make it possible to achieve enterprise-grade analytics without the usual complications.
FAQs
How do AI dashboards help SaaS users make faster decisions?
AI dashboards simplify decision-making by delivering real-time insights through tools such as natural language queries, predictive analytics, and automated alerts. Instead of spending time manually analyzing data, users can concentrate on making decisions and taking action.
These dashboards provide immediate access to essential information, enabling SaaS users to quickly adapt to trends, seize opportunities, or address challenges. This approach makes data-driven decisions quicker and more effective.
How do AI dashboards use predictive analytics to improve decision-making?
Predictive analytics within AI dashboards enables businesses to anticipate future trends and outcomes by examining both historical and real-time data. This capability helps organizations make quicker, more informed decisions by spotting opportunities and potential risks before they materialize.
These dashboards deliver practical insights, such as sales forecasts, customer behavior trends, or areas for improving operations. By simplifying complex datasets into straightforward, forward-thinking recommendations, predictive analytics equips users to act decisively and stay ahead in competitive markets.
How do AI dashboards help teams maintain consistent data?
AI dashboards play a crucial role in maintaining data accuracy by linking directly to live data sources and enforcing secure governance rules. They establish a single source of truth by standardizing metrics and definitions, ensuring everyone on the team is working with consistent, up-to-date information.
By reducing inconsistencies and minimizing manual errors, these dashboards simplify teamwork and empower teams to make quicker, well-informed decisions grounded in trustworthy data.
Related Blog Posts


