Business Intelligence
Embedded AI Insights for Product Teams
Embedded AI makes product teams self-sufficient analysts by surfacing live, consistent insights from your data warehouse via plain-English queries and predictive dashboards.
Embedded AI tools simplify data analysis for product teams, enabling faster, more informed decisions. Instead of waiting on analysts or wrestling with technical tools, embedded AI integrates directly into your workflows, offering real-time insights through natural language queries. Here's what you need to know:
What it is: Embedded AI connects directly to your data warehouse (e.g., Snowflake, BigQuery) and allows plain-English questions like, “What features had the highest adoption last quarter?”
Why it matters: It eliminates delays, ensures consistent data definitions, and empowers teams to act on up-to-date metrics.
How it helps: Tools like Querio streamline feature prioritization, user behavior analysis, and performance forecasting with live data, AI-powered notebooks, and predictive dashboards.
Key takeaway: Embedded AI transforms how product teams analyze data, making insights accessible, consistent, and actionable without technical expertise.
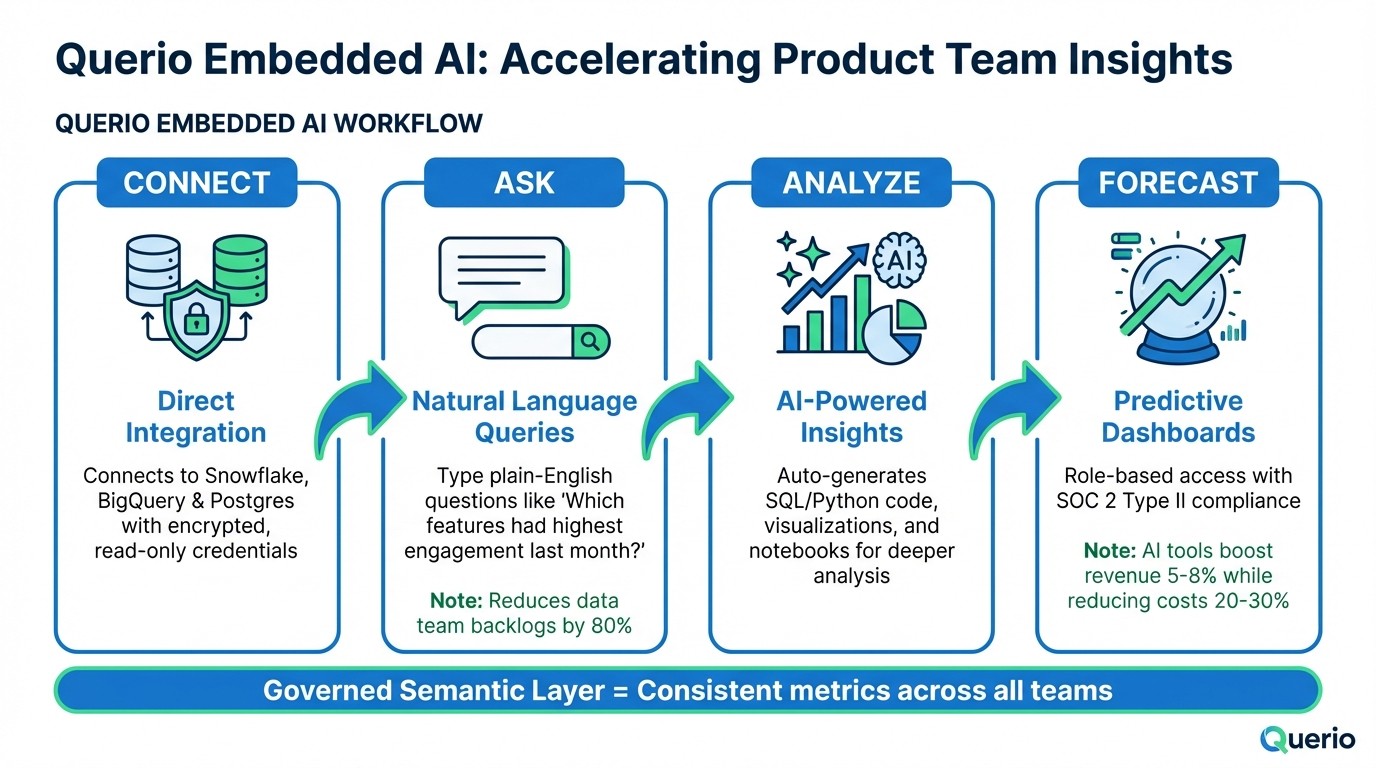
How Querio Embedded AI Works for Product Teams
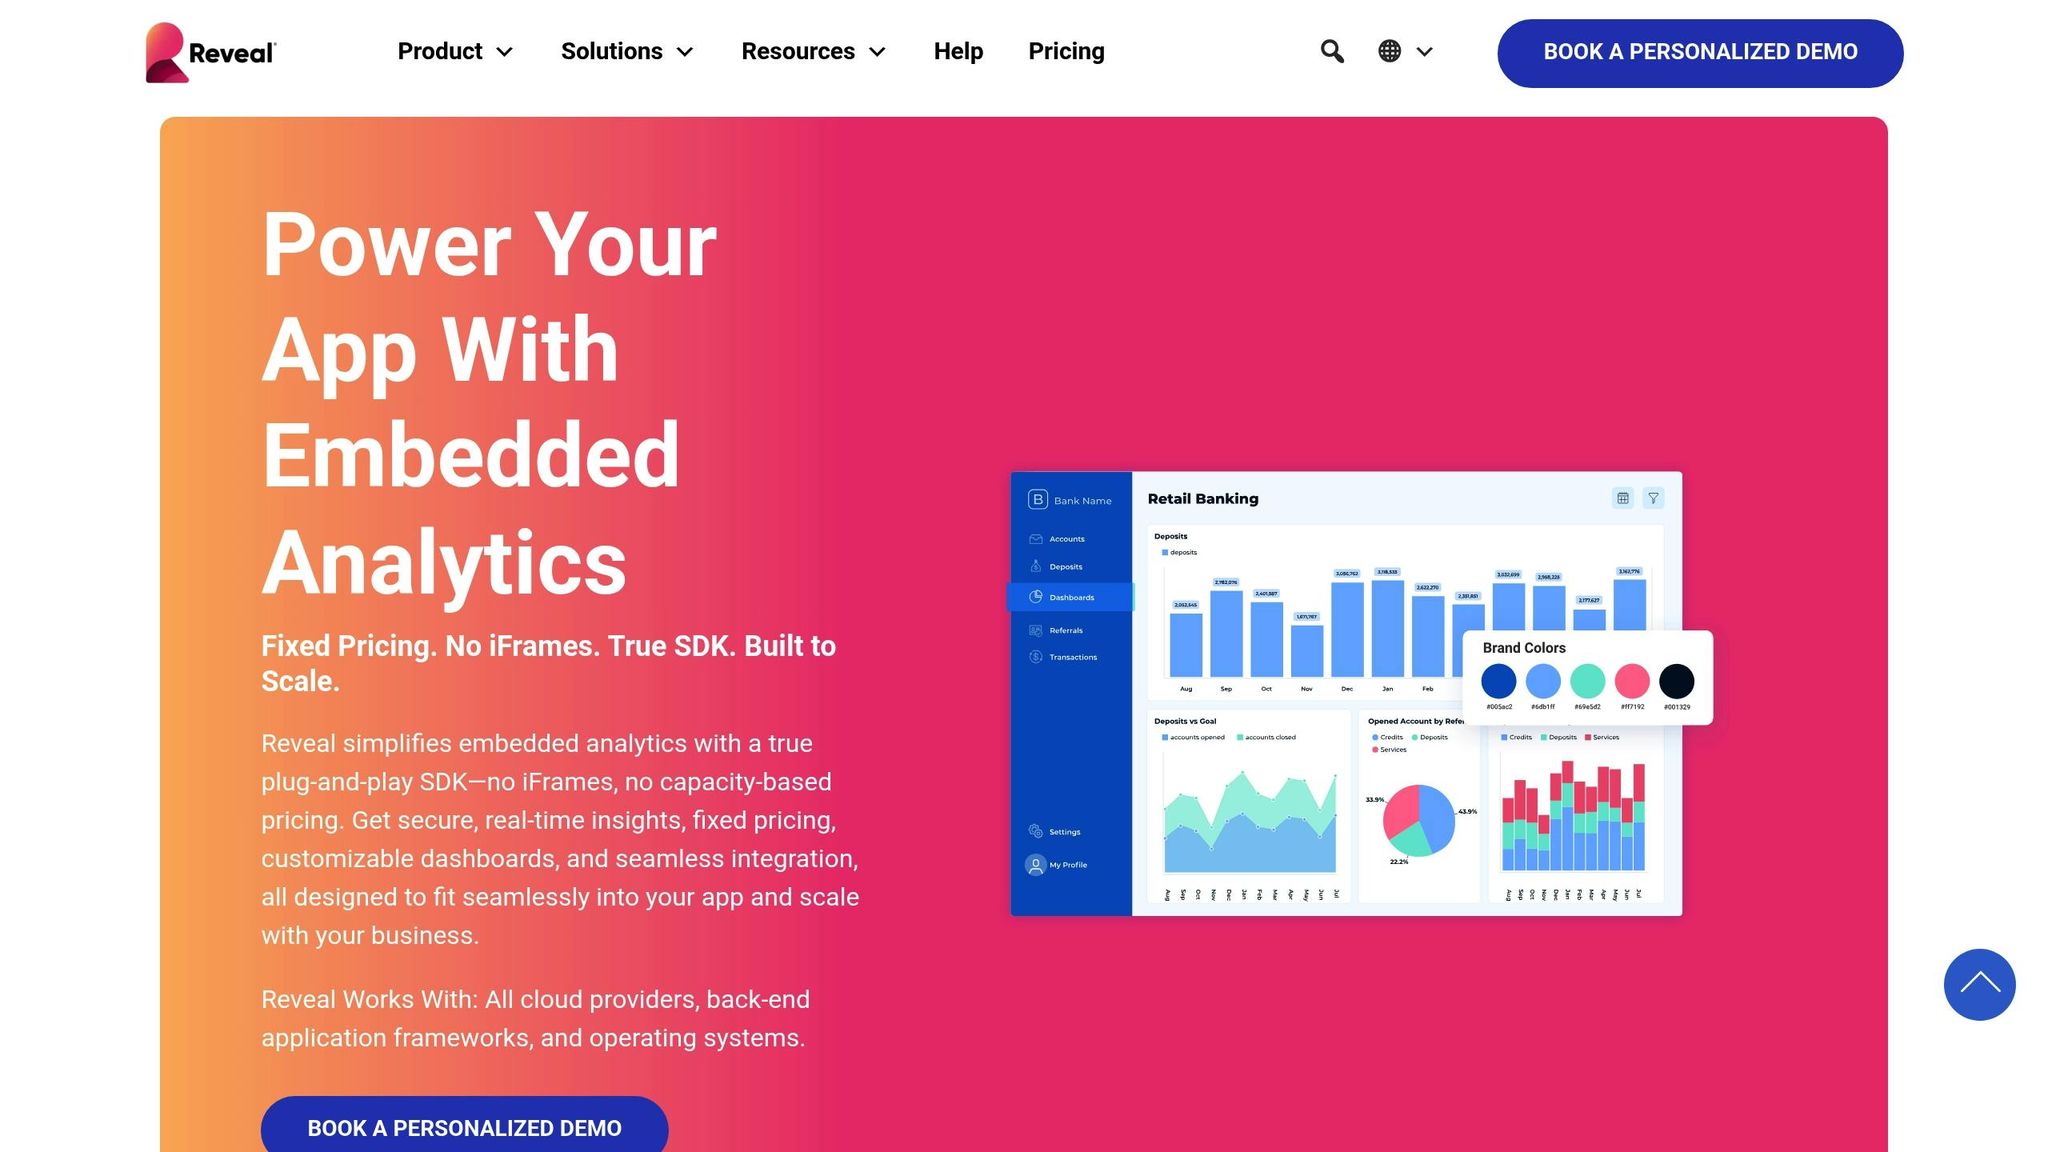
Reveal's AI-powered Embedded Analytics in Action
How Querio's Embedded AI Helps Product Teams
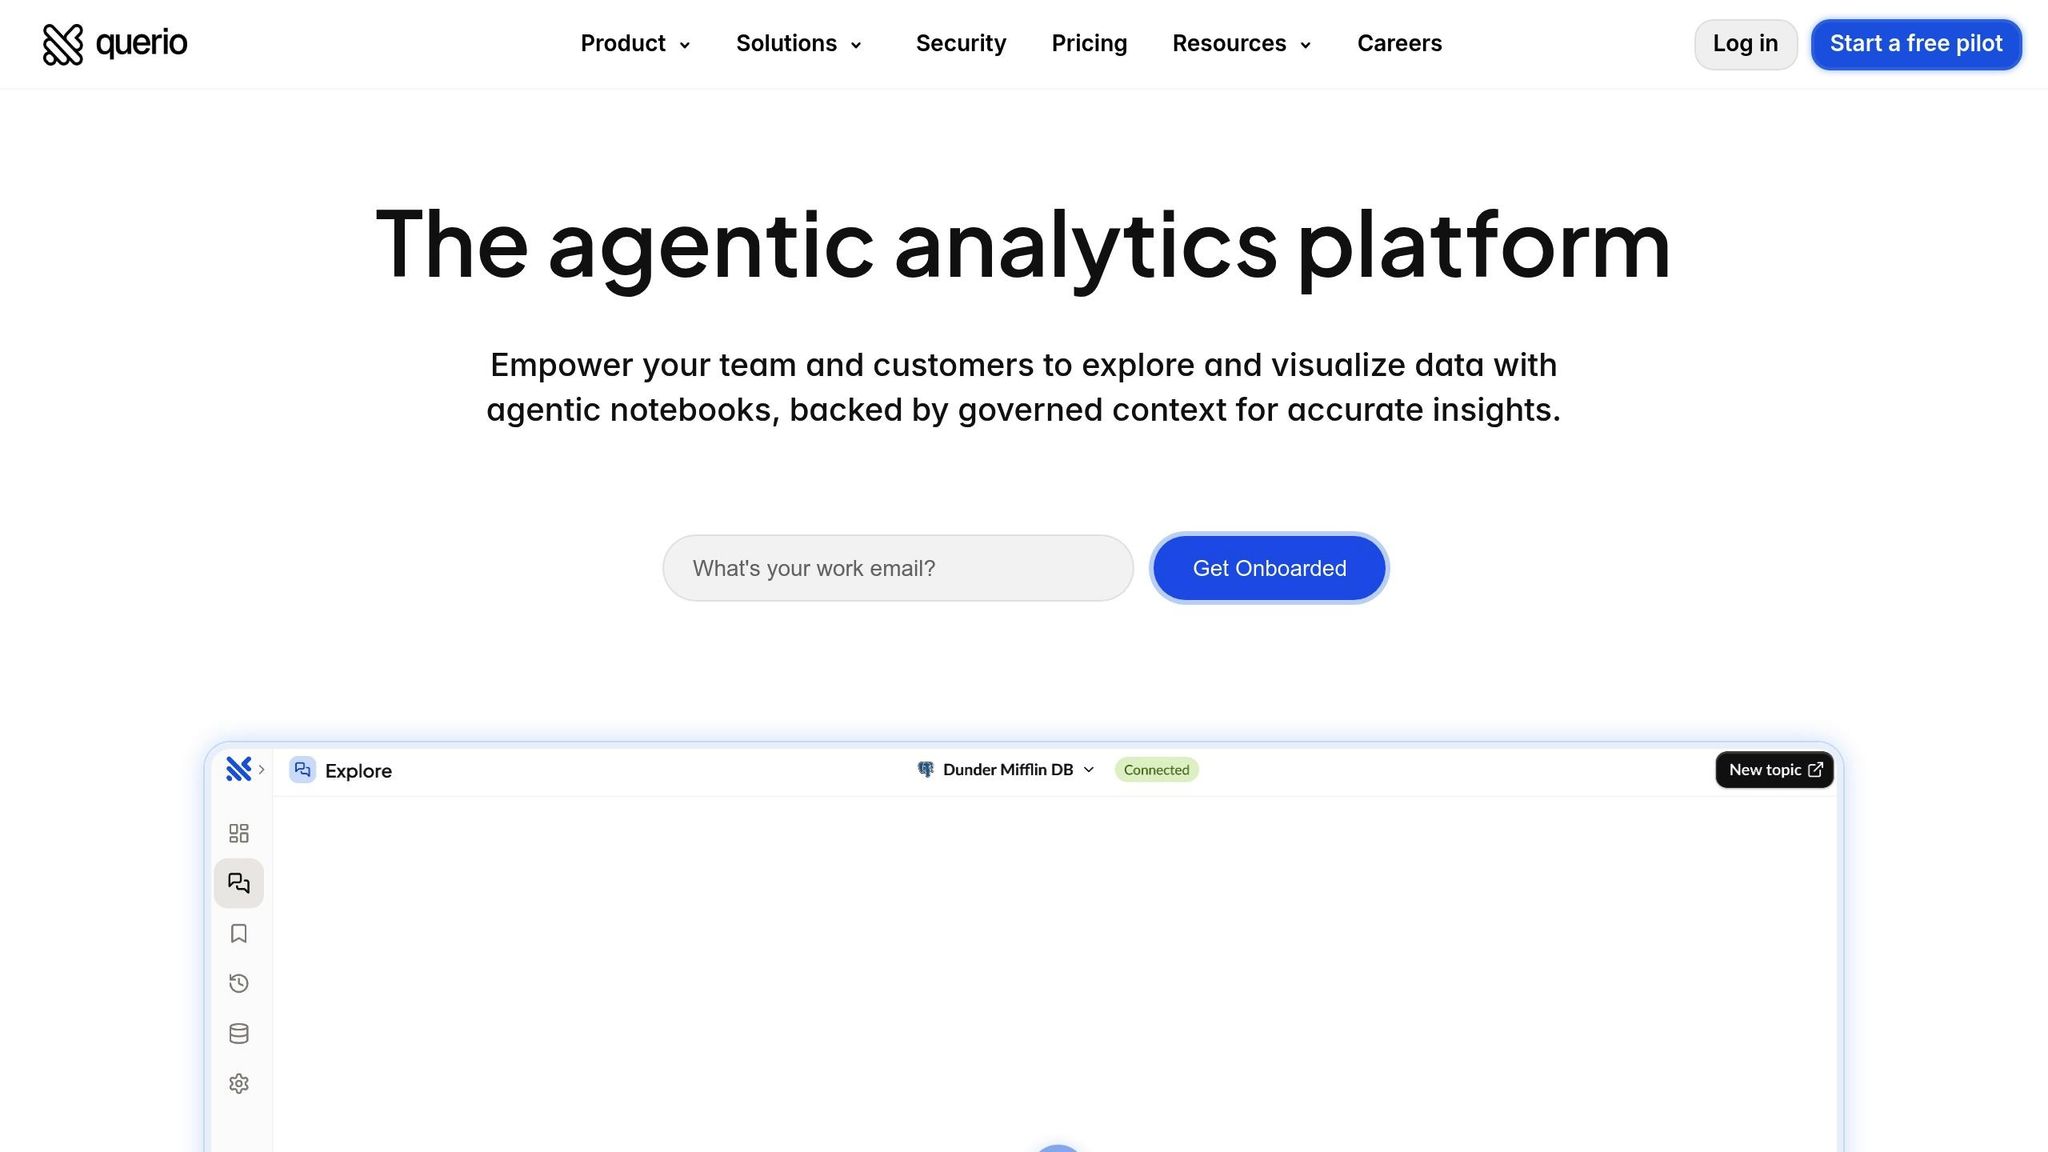
Querio takes the concept of embedded AI and turns it into a powerful tool for product teams, simplifying data analysis and speeding up decision-making with practical, easy-to-use features.
By transforming your data warehouse into a conversational analytics tool, Querio gives product teams the ability to get answers instantly. No more waiting days for an analyst or wrestling with SQL - just immediate insights, ready when you need them. The platform integrates seamlessly with your existing systems, automatically generating secure code to ensure accuracy and maintain governance, all while significantly cutting down the time it takes to make informed decisions.
Live Data Access for Up-to-Date Insights
Querio connects directly to Snowflake, BigQuery, and Postgres using encrypted, read-only credentials. This direct link means your team can query live data from your warehouse without duplicating it or relying on outdated exports. For example, when you ask about yesterday's feature adoption rates, you're looking at the real numbers - not data from last week's batch update. By eliminating unnecessary data handling, Querio ensures your decisions are always based on the most current information.
Natural-Language Queries Made Easy
With Querio, you can simply type a question like, "Which features had the highest engagement among enterprise customers last month?" The AI instantly translates your query into precise SQL or Python code and picks the best visualization - like bar charts for comparisons or line graphs for trends. Want to refine your results? Just ask follow-up questions, such as filtering for customers who joined after July 1, 2025. This intuitive approach, common among the best conversational AI analytics tools, can reduce data team backlogs by 80% [1], giving analysts more time to focus on strategic projects while product managers get the answers they need, fast.
A Governed Semantic Layer for Consistency
Querio’s shared context layer ensures that everyone on your team is working with the same definitions for key metrics. Whether someone asks about "active users" or "monthly recurring revenue", the AI pulls from standardized terms set by your data team. This eliminates the risk of inconsistent definitions or conflicting reports. The semantic layer translates technical table names into straightforward business language, making it easy for the AI to understand product-specific terminology and deliver consistent insights across all queries, dashboards, and reports. This consistency helps teams prioritize features, analyze user behavior, and predict performance more effectively.
Feature Prioritization with Querio Embedded AI
With Querio's embedded AI, product teams can prioritize features based on real-time, actionable insights. Let’s face it - not every feature request is practical, and relying solely on gut feelings can lead to missteps. Querio removes the guesswork by tying decisions to actual usage data and measurable outcomes. This approach ensures that feature prioritization is guided by facts, not assumptions.
Analyze Feature Adoption and Usage Metrics
Querio takes feature evaluation to the next level by offering instant insights into how users interact with your features. Want to know how many users activated a new export feature in the past 48 hours? Just ask Querio, and you'll get the answer immediately. It also processes A/B test results and engagement KPIs, allowing you to validate new features before full rollout. For instance, if a feature sees strong initial adoption but a quick drop in retention, it’s a clear signal that adjustments are needed before committing more resources[2].
Align Features with Business Goals
While usage metrics are important, they don’t tell the whole story - revenue and retention impacts matter just as much. Querio’s semantic layer bridges this gap by connecting metrics to key business outcomes. By defining your "source of truth" in the semantic layer - where metadata and join logic are documented - you ensure that every team member gets consistent results when analyzing feature usage[1]. This shared clarity makes it easier for product managers and executives to make informed decisions. Plus, Querio integrates A/B test results directly into its dashboards, offering instant, data-backed recommendations on feature viability. This not only streamlines decision-making but also helps you confidently present your case to stakeholders[2].
User Behavior Analysis with Querio's AI-Driven Notebooks
Understanding user behavior is a critical piece of the puzzle when it comes to building successful products. It’s not just about looking at the numbers on a dashboard - it’s about digging deeper into how users interact with your product and identifying the challenges they face.
Querio’s AI-driven notebooks provide product teams with a powerful tool to explore these behaviors. This workspace allows teams to analyze user interactions and retention patterns through iterative, conversational queries, all without needing to leave the platform.
Iterative Analysis in AI-Powered Notebooks
Querio’s notebooks are designed with flexibility in mind, seamlessly integrating SQL and Python so you can switch between languages without any hassle [1]. Even better, the AI co-pilot takes plain-English questions and translates them into code using natural language text-to-SQL, making advanced analysis accessible even for those without SQL expertise.
For example, if you’re investigating a drop in retention for users who signed up during a specific period, the AI can instantly generate and execute the query against your live data warehouse. Results appear immediately, and you can dive deeper by asking follow-up questions like, “What features did these users engage with before they churned?” or “How do their session lengths compare to those of retained users?” The notebook adapts to your line of questioning, offering suggestions, running additional analyses, and uncovering patterns - such as which features are commonly used by users who churn [5]. This iterative process allows for a deeper understanding of user behavior, providing the insights needed to refine your product strategies.
Identifying Retention and Churn Trends
Once you’ve identified patterns, Querio’s text-to-SQL query tools help turn those insights into action. Retention analysis isn’t just about tracking numbers - it’s about finding early warning signs of churn and addressing them before it’s too late. Querio’s notebooks allow you to set up real-time health scores to monitor whether users are hitting critical onboarding milestones. If a user skips an essential step within the first 72 hours, the system flags it immediately, prompting your team to intervene [3].
Beyond that, the AI can detect anomalies that traditional dashboards might overlook, such as sudden drops in engagement or unexpected spikes in usage. These insights can be game-changing. Research shows that AI-powered next-best-experience tools can boost revenue by 5% to 8% while reducing service costs by 20% to 30% [4]. By understanding and responding to user behavior in real-time, you’re not just improving retention - you’re directly impacting your bottom line.
Performance Forecasting with Querio Dashboards
Once product teams grasp current user behavior, the next step is to anticipate what lies ahead - be it daily active users, churn rates, or infrastructure demands. Forecasting, built on real-time and historical data, allows teams to act before issues arise. It complements insights into feature prioritization and user behavior, giving you a comprehensive view of product performance. Waiting for a problem to show up in your data often means it's too late to respond effectively. With forecasting dashboards, you can identify trends early and make informed decisions about your roadmap, resource distribution, and capacity planning.
Let’s explore how Querio transforms forecasting into a clear, actionable visual story.
Creating Dashboards for Predictive Insights
Building a forecasting dashboard in Querio begins by identifying the questions you need answered. Are you estimating weekly active users for the next three months? Or checking if you’ll meet your Q3 monthly recurring revenue goals? Start by defining your forecasting objectives and pulling data signals from Querio’s governed semantic layer [6][7].
Querio’s AI-assisted tools make it easy to generate baseline time series for your metrics [6]. From there, you can layer predictive models that incorporate trends, seasonality, and confidence intervals. Use visuals like line charts with shaded confidence ranges or goal markers to distinguish historical data from future projections. Add filters for specific segments, plans, or regions, enabling stakeholders to view forecasts from different angles. Adjustable assumptions let you plan for scenarios like annual revenue or active users over varying timeframes, from a few months to a year.
For scenario planning, you can tweak assumptions - such as signup rates, activation percentages, or churn rates - linked to calculated metrics [6][8]. Sliders allow you to toggle between scenarios and instantly compare outcomes with side-by-side charts. Threshold indicators can highlight when a scenario might exceed operational limits. For example, you can answer questions like, “If we launch this feature by May and see a 20% growth spike, when will we need to scale our infrastructure?”
Role-Based Access for Security
Securing forecasting insights is just as important as generating them. These dashboards often contain sensitive data, such as revenue projections, customer trends, and capacity constraints. Querio’s role-based access controls ensure that users see only the level of detail relevant to their responsibilities while still maintaining a shared view of forecasts [7][8][9]. For instance, executives might access high-level organizational forecasts and financial metrics, while product managers and analysts can dive into specific product or feature-level details. Engineering teams can monitor performance and capacity forecasts tied to usage metrics without viewing sensitive financial data.
Permissions are managed through roles, groups, and row-level filters that are applied automatically. For U.S.-based organizations, Querio offers SOC 2 Type II compliance, single sign-on integration, and data encryption (both at rest and in transit), ensuring enterprise-grade security to meet compliance and risk management needs [7][8][9]. Scheduled reports can also be configured for time zone–specific delivery - such as every Monday at 8:00 AM ET - aligning with your team’s regular meeting schedules. AI-generated narrative summaries further enhance usability by highlighting forecast variances, explaining anomalies, and flagging metrics that exceed alert thresholds. This approach integrates forecasting into your team’s regular workflow, making it an ongoing process rather than a one-time effort.
Conclusion
Key Benefits Recap
Querio's embedded AI transforms natural-language queries into SQL and Python in seconds, delivering answers almost instantly. With live data, you’re always working with the most up-to-date insights. The governed semantic layer ensures metrics stay consistent across your organization, creating a shared "data language" for everyone - from product managers to executives.
The platform also offers AI-powered notebooks for refining user behavior analysis and forecasting dashboards that turn historical trends into actionable predictions. Plus, robust security controls ensure your data remains accurate and protected. These features equip your team to make quicker, data-driven decisions with confidence.
Next Steps for Product Teams
Ready to harness Querio's capabilities? Start by connecting the platform to your data warehouse using encrypted, read-only credentials. Define your core metrics in the semantic layer, and dive into queries around feature adoption and user engagement. From there, build a forecasting dashboard to track critical metrics like monthly active users or churn rates.
To streamline your workflow, set up scheduled reports to align with your team’s routine - say, every Monday at 8:00 AM ET - so insights are ready when you need them most. As your processes evolve, consider embedding these governed analytics into customer-facing applications, offering your users the same reliable insights your team depends on.
FAQs
How does Querio protect data and ensure compliance with governance standards?
Querio operates with a multi-layered security and governance framework, designed to protect your data while giving product teams the confidence to explore insights. Connections to cloud data warehouses - such as Snowflake, BigQuery, and Postgres - are established through read-only service accounts, ensuring secure, encrypted transport. Plus, Querio holds SOC 2 certification, meeting industry standards for data protection and audit readiness.
Inside the platform, row-level security (RLS) ensures that users can only access data they’re permitted to view. The semantic layer guarantees consistent metric definitions across all dashboards, eliminating discrepancies. Additionally, governance tools help meet privacy regulations, standardize critical business definitions, and maintain detailed audit logs, ensuring alignment with corporate policies and legal obligations.
How do natural-language queries improve data analysis for product teams?
Natural-language queries let users ask questions in plain English, making data analysis quicker and easier for everyone - even those without technical skills. By understanding the intent behind a query, these tools provide instant answers without needing SQL knowledge or complex visualizations. This speeds up decision-making and reduces the need to rely on analysts for every data request.
When integrated directly into workflows, natural-language queries boost productivity by allowing users to stay within the tools they’re already familiar with. For instance, asking something like, "What were our top-selling features last month?" can instantly produce clear metrics or visuals without requiring a platform switch. This minimizes context-switching, removes bottlenecks, and allows for faster, more agile product decisions.
AI-powered natural-language queries take things even further by offering advanced insights, including trend forecasts, anomaly detection, and predictive analytics. This enables product teams to explore different scenarios, prioritize features, and make informed, data-driven decisions effortlessly, leading to better product outcomes.
How do Querio's forecasting tools support product teams in making better decisions?
Querio’s forecasting tools bring AI-driven predictive analytics right into the heart of product workflows. This means teams can ask "What-if" questions in straightforward English and get instant, actionable insights. The tools dive into data like current usage patterns, feature adoption rates, and performance metrics to forecast trends such as user churn, spikes in demand, or the effects of upcoming releases.
Armed with these insights, product managers can focus on high-impact features, allocate resources wisely, and create achievable timelines. Querio’s forecasting engine goes a step further by spotting anomalies and simulating how changes - like a UI redesign or pricing tweaks - could influence user engagement or revenue. By running these scenario analyses, teams can cut down on guesswork, avoid potential risks, and ensure their product roadmap stays in sync with evolving market trends. This approach helps drive the success of new features faster and more effectively.
Related Blog Posts


