Business Intelligence
Gartner Magic Quadrant for Analytics & BI 2026: Analysis
Gartner 2026 favors governed, warehouse-native analytics with built-in AI; shortlist by live connectivity, semantic governance, and SQL transparency.

Here’s the short answer: Gartner’s 2026 BI view favors platforms that pair governed metrics, live warehouse access, and AI inside daily analysis - not dashboard tools with AI added on later.
If I were shortlisting vendors today, I’d read this report as a screening tool, not a final pick. The main test is simple: Can the platform query Snowflake, BigQuery, Redshift, or Postgres live, keep metric definitions under control, and show the SQL behind AI-generated answers?
What I’d keep in mind right away:
- 6 vendors landed in the Leader quadrant: Microsoft, Salesforce (Tableau), Google (Looker), Qlik, ThoughtSpot, and AWS QuickSight
- Gartner puts more weight on agent-like AI behavior, such as anomaly checks and root-cause work
- The report is less helpful on day-to-day fit issues like extract limits, SQL visibility, row-level access, and pricing caps
- For teams using dbt and a cloud warehouse, the top buying checks are:
- live connectivity
- semantic-layer control
- governance ownership
- AI output you can inspect
- ease of use for non-technical teams
Quick comparison
| Platform | Main signal from the article | Best fit in plain English | Main watch-out |
|---|---|---|---|
| Power BI | Big Microsoft footprint | Microsoft 365 and Azure shops | Mixed live/extract model |
| Tableau | Strong visual analysis | Teams led by analysts and dashboard builders | Extract-heavy setup |
| Looker | Governance-first model | BigQuery and engineering-led teams | Fit depends on model setup |
| ThoughtSpot | Search-led self-serve | Business users who want fast answers | Needs close testing on governance flow |
| AWS QuickSight | AWS scale and pricing clarity | AWS-native and embedded BI use cases | Best fit is narrower than broad BI suites |
| Qlik | Large-enterprise BI platform | Large companies with broad BI needs | Must test warehouse workflow fit |
| Sigma | Mentioned in buyer context | Spreadsheet-style warehouse analysis | Not covered in Gartner’s Leader list here |
Bottom line: I’d use Gartner to narrow the field, then test each tool on my own schema, metrics, access rules, and cost model. A BI tool that is right only 85% of the time - and can’t show why - is a drag, not a help.
What the 2026 Gartner Magic Quadrant says about the BI market
The 2026 Gartner Magic Quadrant shows a BI market that has moved past dashboard-first tools and toward governed, AI-ready analytics. That change helps explain why Gartner now puts so much weight on governance and AI readiness when judging BI platforms. It also explains why execution and vision don’t carry the same meaning they did a few years ago.
Why governed, AI-ready analytics is now the center of BI evaluation
AI by itself doesn’t set a platform apart anymore. What matters now is AI that works inside governed workflows. In plain English: can the system look into the data, explain what changed, spot anomalies, surface root causes, and return findings without an analyst having to ask the perfect question first?
That’s the bar.
For teams working in Snowflake, BigQuery, Redshift, or Postgres with dbt-defined logic, the issue is pretty direct. Does the platform keep metrics consistent with a semantic layer? Does it connect live to the warehouse? Does it support governed self-serve without turning reporting into a free-for-all?
The table below makes the shift pretty clear:
| Dimension | Legacy BI | Governed Warehouse-Native AI BI |
|---|---|---|
| Data access | Extracts, CSVs, batch loads | Live warehouse-native access to Snowflake, BigQuery, Redshift, and Postgres |
| Logic layer | Defined per dashboard/report | Centralized semantic layer, often with dbt or LookML |
| User interface | Static dashboards | Conversational, natural-language workflows |
| AI role | None or basic forecasting | Guided query generation and anomaly detection |
| Governance | IT-owned and siloed | Version-controlled semantic logic and shared definitions |
Gartner turns that market move into two scoring dimensions: execution today and vision for the next wave.
How Gartner scores vendors: Ability to Execute and Completeness of Vision
The four Magic Quadrant groups still follow the same basic logic. Leaders execute well today and show where the market is headed next. Challengers execute well too, but with a narrower point of difference. Visionaries have stronger ideas than proof. Niche Players fit narrower use cases.
In 2026, the report favors platforms that combine strong execution with AI built into the warehouse-native workflow, not layered on around the edges.
Where the major vendors land in 2026
::: @figure 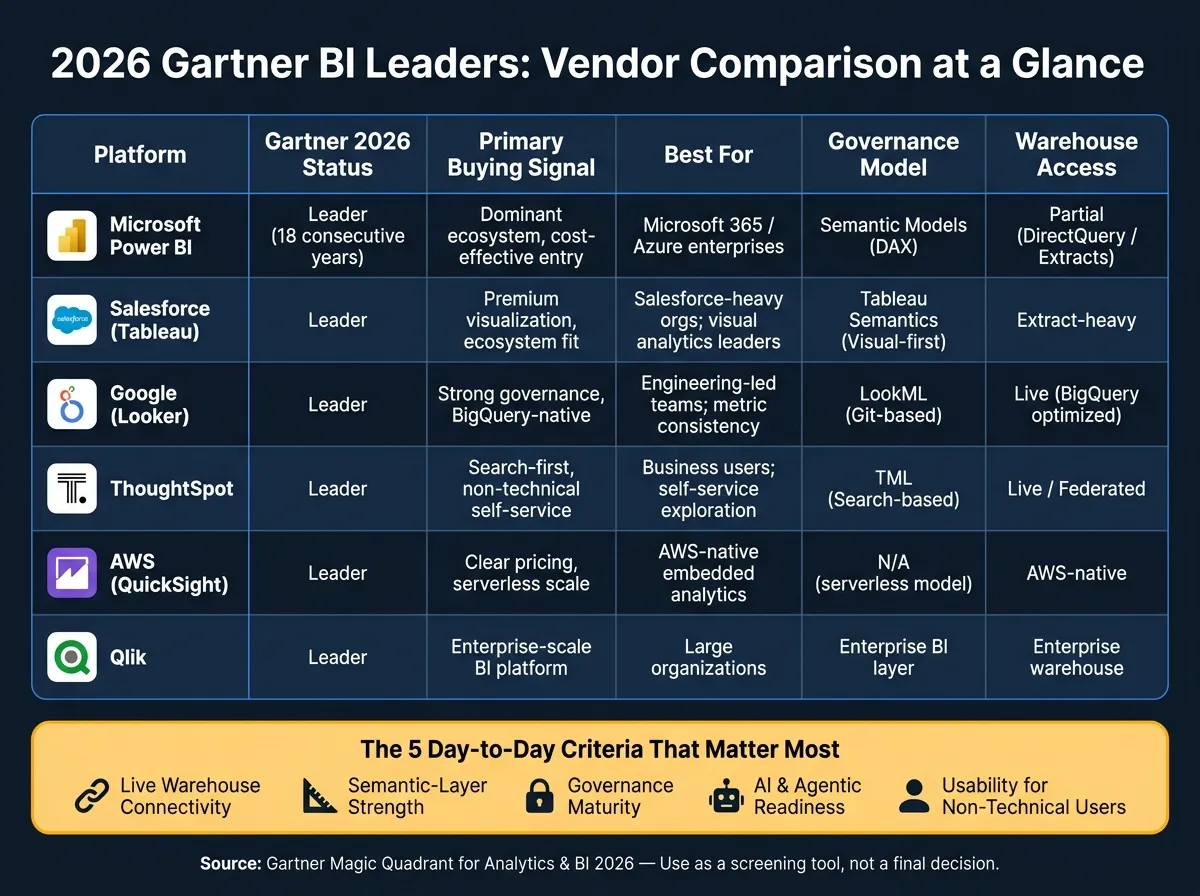 {2026 Gartner Magic Quadrant BI Leaders: Vendor Comparison at a Glance}
:::
{2026 Gartner Magic Quadrant BI Leaders: Vendor Comparison at a Glance}
:::
Using Gartner’s execution-and-vision lens, the 2026 quadrant separates vendors by buyer fit as much as rank. The 2026 Gartner Magic Quadrant for Analytics and Business Intelligence Platforms placed six vendors in the Leader quadrant: Microsoft, Salesforce (Tableau), Google (Looker), Qlik, ThoughtSpot, and AWS (QuickSight) [1][2].
That group matters, but not because every vendor does the same job. They don’t. Each landed there for its own reasons, and those differences can shape your shortlist in a big way.
What a Leader placement actually signals to buyers
A Leader placement usually points to proven execution, broad adoption, and the ability to serve large enterprises. Microsoft Power BI is a good example. It has held a Leader position for 18 consecutive years [1]. That kind of staying power often means a deep ecosystem, a huge user base, and steady product investment over time.
But that’s only part of the story.
Smaller teams often care less about broad enterprise reach and more about things like governed metrics, live warehouse access, and self-serve ease of use. And Gartner’s quadrant doesn’t show usage caps or other adoption limits. Those details can matter just as much as seeing a vendor in the top-right corner.
Here’s what those placements mean in direct buyer terms:
| Platform | Gartner 2026 Status | Primary Buying Signal | Best For |
|---|---|---|---|
| Microsoft | Leader | Dominant ecosystem, cost-effective entry | Microsoft 365/Azure enterprises |
| Salesforce (Tableau) | Leader | Premium visualization, Salesforce ecosystem fit | Salesforce-heavy orgs; visual analytics leaders |
| Google (Looker) | Leader | Strong governance, BigQuery-native | Engineering-led teams; metric consistency |
| ThoughtSpot | Leader | Search-first, non-technical self-service | Business users; self-service exploration |
| AWS (QuickSight) | Leader | Clear pricing, serverless scale | embedded analytics tools |
| Qlik | Leader | Enterprise-scale BI platform | Large organizations |
Visionaries, Challengers, and Niche Players in plain buying terms
The same lens applies outside the Leader box, but the buying question changes. At that point, it’s less about scale and more about workflow fit. Quadrant position tells you about scale and product direction. It does not tell you whether a tool fits the way your team already works.
That gap matters for teams running Snowflake, BigQuery, Redshift, or Postgres with dbt-defined logic. In those setups, the key issue is whether a vendor’s direction lines up with a warehouse-native workflow.
For warehouse teams, the real test is simple: does that placement turn into governed metrics, live access, and low-friction self-serve? That’s what the next section looks at directly.
What quadrant placement means for teams running a real warehouse
Quadrant placement shows where a vendor sits in the market. But if your team runs on Snowflake, BigQuery, Redshift, or Postgres, that label only goes so far.
What matters day to day is much simpler: Does the BI platform respect governed definitions and give business users answers they can trust? That’s the real test. The five checks below help turn a market signal into a shortlist you can actually use.
The 5 criteria that matter most in day-to-day analytics
Use these five checks to judge whether a platform fits a real warehouse, not a polished demo.
- Live warehouse connectivity - This means direct, read-only queries instead of extracts or CSVs. Tools that rely on extracts add lag and create a second source of truth.
- Semantic-layer strength - This is about consistency. Every user should see the same metric definition. If someone asks for NRR or churn rate, the answer should match whether the question comes from a data analyst or a VP of Sales.
- Governance maturity - Who owns metric definitions and approvals? Governance is more than access control. It also covers whether the logic behind an answer is auditable, editable, and controlled by your team instead of buried inside a vendor platform.
- AI and agentic readiness - Gartner's 2026 report puts the spotlight on Agentic Analytics: AI that autonomously investigates data, detects anomalies, and runs root-cause analyses instead of only showing charts [1]. In practice, the key test is whether the AI can produce inspectable SQL and admit uncertainty when data is missing.
- Usability for non-technical users - Governed self-serve falls apart if business users don’t trust the output. The best platform is the one your finance, ops, or RevOps team can use without turning every new question into a ticket.
Vendor comparison table
Read the table as a fit check, not a ranking.
| Platform | Governance Model | Warehouse Access | Warehouse Fit |
|---|---|---|---|
| Looker | LookML (Git-based) | Live (BigQuery optimized) | Engineering-led teams on Google Cloud |
| ThoughtSpot | TML (Search-based) | Live / Federated | Business teams; search-first BI |
| Power BI | Semantic Models (DAX) | Partial (DirectQuery / Extracts) | Microsoft-standardized enterprises |
| Tableau | Tableau Semantics (Visual-first) | Extract-heavy | Analyst-led visual storytelling |
| Hex | Notebook-based / dbt integration | Live / Notebook-native | Analyst-heavy teams using SQL and Python |
Where Gartner's framing holds up - and where it falls short
Gartner gets the direction right. The weak spot is how these platforms behave against your actual warehouse data. Its focus on Agentic AI as the defining shift for 2026 lines up with the move away from reactive dashboards and toward autonomous investigation and root-cause analysis [1].
Where the framing misses the mark is what it doesn’t test. The Magic Quadrant does not measure whether a vendor’s AI produces inspectable SQL, admits uncertainty when data is missing, or supports governance that your team owns. If an AI tool can’t show its work, it slows down the analyst it’s supposed to help.
Test each platform against your dbt models, your metric definitions, and the questions your business users ask.
How to turn the report into a shortlist
The report tells you which vendors look credible. It does not tell you which one fits your warehouse, team size, or governance model.
The fastest way to turn that signal into a shortlist is simple: match the platform type to your team’s maturity.
Matching platform type to team size and analytics maturity
Small teams usually need governed self-serve that cuts analyst bottlenecks without wrecking metric consistency. In practice, platforms with live warehouse connectivity to Snowflake, BigQuery, Redshift, or Postgres tend to fit better than tools that need a lot of engineering work to get running and keep running.
Established companies that are updating legacy BI often deal with split workflows. One tool handles notebook-style exploration. Another handles dashboards. And metric definitions sit in the middle, with nobody fully trusting them. For these teams, consolidation matters more than a slick feature demo.
Be careful with AI accuracy claims. Governed semantic definitions matter more than model claims.
Once you know the right fit class, put the vendor under pressure with your own warehouse, metrics, and access rules.
A buyer checklist for demos, trials, and reference calls
Use these tests to separate polished demos from actual warehouse fit.
-
On schema fit: Run the demo on your own schema. A strong test question is: "Show me our NRR trend for customers acquired before our last pricing change, excluding logos that churned within 90 days." Then ask to see the SQL it generated [4].
-
On governance: Revoke access in the middle of the demo and confirm the change takes effect right away. If the platform can’t show real-time row-level access control, that’s a gap your security team will find later [4].
-
On SQL transparency: Ask directly: "Can I see and edit the SQL behind this answer?" If a tool generates SQL you can’t inspect or fix, it often gives analysts more cleanup work, not less.
"A tool that is right 85% of the time, with no way to know which 15% is wrong, is slower than the analyst it replaced." - Valiotti Data [2]
- On pricing: Confirm whether pricing is per seat, per usage, or capped. Also check whether AI queries trigger separate consumption charges or hidden query limits that only show up after production starts. Querio, for example, includes AI usage in its flat monthly plans with an optional hard cap, so usage stops at the limit instead of creating surprise bills [3].
Reference calls with teams that use a similar warehouse setup can help confirm limits, pricing, and governance behavior. Those checks say a lot about where the market is heading in 2026.
Why this market shift favors governed, warehouse-native AI analytics
AI-driven BI works best when it runs on live warehouse data, uses governed definitions, and lets teams inspect the queries behind each answer.
That’s the plain-English takeaway from the 2026 quadrant: governed, warehouse-native systems beat AI features stacked on top of stale data.
Here’s why. Stale extracts hurt freshness and snap the audit trail. If the data is old, the answer is old too. And if no one can trace how a metric was built, trust starts to slip. The smart move is to define metrics and joins first. Accuracy comes from the semantic layer, not from the model alone.
Querio is built around that setup. Its context layer lives as plain SQL, Markdown, and Python files synced to GitHub alongside your dbt project. It connects live, in read-only mode, to Snowflake, BigQuery, Redshift, and Postgres. And every answer includes inspectable, editable SQL and Python inside a reactive notebook.
That split matters in day-to-day work. Non-technical users get governed self-serve. Analysts get the full notebook and code they can inspect and edit. In both cases, teams stay out of a black box.
Key takeaways for data leaders shortlisting analytics platforms in 2026
For buyers, this turns into four shortlisting rules:
- Governance and semantic consistency matter more than model hype. Put metric definitions, joins, and auditability ahead of flashy AI claims.
- Live warehouse access is non-negotiable. Extract-based setups can’t meet the freshness and consistency needs of modern analytics.
- Team size and workflow shape the right fit. Small data teams at B2B SaaS, healthcare, and finance companies need governed self-serve that cuts analyst bottlenecks with AI without giving up consistency.
- Auditability is a real requirement, not a nice-to-have. If a platform can’t show the SQL behind an answer, trust can fall apart during security reviews and compliance audits.
Use these rules when you compare demos, trials, and reference calls.
FAQs
::: faq
How much should Gartner rankings influence my shortlist?
Gartner rankings should help shape your shortlist, but they shouldn’t make the final call for you. Think of the Magic Quadrant as a gut check for Gartner’s fit areas: AI-driven BI, self-service, and governance.
Then test that fit with a live POC using your actual Snowflake, BigQuery, Redshift, or Postgres warehouse. Use your own models. Use your own metrics. That’s where things get real.
Production trust comes down to two things: governed semantics and SQL/Python that teams can inspect and edit on live warehouse data. :::
::: faq
What should I test in a BI demo beyond AI features?
Beyond AI features, look at how the platform holds up in day-to-day production: governance, SQL transparency, performance, and workflow fit.
Run the test in your own warehouse, not a vendor sandbox. That’s where the cracks usually show. You want to see if the platform respects row- and column-level security, shows the SQL or Python behind the answers, and lets your team edit that logic when needed.
It should also support a governed semantic layer so teams use the same metric definitions instead of making them up on the fly. And it needs to work with the tools people already use, like Slack or embedded dashboards, so insights don’t just sit in yet another app. :::
::: faq
How do I tell if a platform is truly warehouse-native?
Check that it connects straight to your warehouse, not to stale CSV exports. It should also respect the same permissions and governance rules your warehouse already uses.
You’ll also want outputs you can inspect. That means deterministic, editable SQL or Python your team can rerun in Snowflake, BigQuery, Redshift, or Postgres.
For metrics, look for a governed semantic layer, such as dbt-defined logic. That way, answers stay consistent across users and dashboards. :::