The Meaning of Ad Hoc Reports Explained for Modern Business
Finally understand the real meaning of ad hoc reports. This guide breaks down what they are, how they work, and why they are crucial for smart, fast decisions.
https://www.youtube.com/watch?v=Zmpcz0DLX-Y
published
Outrank AI
meaning of ad hoc reports, ad hoc reporting, self-service analytics, business intelligence, data-driven decisions
7ed84f8d-a939-479c-a00f-de4bf32d25e8

Think of an ad hoc report as a one-time, custom-built deep dive into your data. It’s created to answer a very specific, often urgent, business question that your regular, scheduled reports just can't address. It’s essentially an on-demand data investigation to get quick, targeted answers right when you need them.
What Exactly Are Ad Hoc Reports?
Let's use an analogy. Your standard weekly sales report is like your daily commute—you know the route, you see the same landmarks, and you get a consistent overview every time. It's predictable and reliable for monitoring your key performance indicators.
An ad hoc report, on the other hand, is like taking a spontaneous road trip to a place you've never been. You have a specific destination in mind (the answer to your question), and you chart a direct course to get there, uncovering new insights along the way.
The whole point of an ad hoc report is its custom nature. These reports aren't pre-built or automated. Someone creates them on the fly to dig into a particular issue—like figuring out why customer sign-ups suddenly dropped last Tuesday, measuring the immediate impact of a flash sale, or understanding why one product is flying off the shelves in a single city.
The Anatomy of an Ad Hoc Report
This responsive approach to data lets your team stop just watching metrics and start actively investigating them. The process of building these reports is often called ad hoc analysis, a topic we cover in much more detail in our guide on ad hoc analysis.
An ad hoc report is really just a conversation with your data. You ask a unique question, and the report is the specific answer that empowers you to make a smart decision without waiting around.
To make things crystal clear, here's a quick summary table breaking down the key characteristics of these reports.
Ad Hoc Reports at a Glance
Aspect | Description |
|---|---|
What | A custom, one-off report built to answer a specific, timely question. |
Why | To investigate anomalies, explore new opportunities, or solve an immediate business problem that isn't covered by standard reporting. |
When | Created on an as-needed basis in response to unforeseen events or urgent queries. |
Who | Traditionally built by data analysts, but modern tools empower business users in marketing, sales, and operations to create them. |
Ultimately, these reports are about agility. They give you the power to react to business changes in real-time instead of waiting for the next scheduled reporting cycle.
Ad Hoc Reports vs. Standard Reports vs. Dashboards
It’s easy to get these business intelligence tools mixed up, but they each have a very specific job to do. Knowing when to use an ad hoc report versus a standard report or a dashboard is the key to getting real value from your data. Think of it like maintaining your car.
A dashboard is your car's main console—the speedometer, the fuel gauge, the temperature warning light. It gives you a live, high-level snapshot of what’s happening right now, designed for quick glances, not deep analysis.
A standard report, on the other hand, is like your car’s regular maintenance record. It’s generated on a predictable schedule—daily, weekly, or monthly—and gives you a consistent look at performance over a set period. These are essential for tracking progress toward your goals.
When to Use Each Tool
So where do ad hoc reports fit in? An ad hoc report is what the mechanic pulls out when your "check engine" light suddenly pops on. It’s a one-off deep dive created to figure out a very specific, often unexpected, problem or opportunity. For example, if your sales dashboard shows a sudden nosedive, you’d create an ad hoc report to pinpoint why.
This concept map really gets to the heart of what an ad hoc report is all about—a targeted investigation to answer a unique business question.
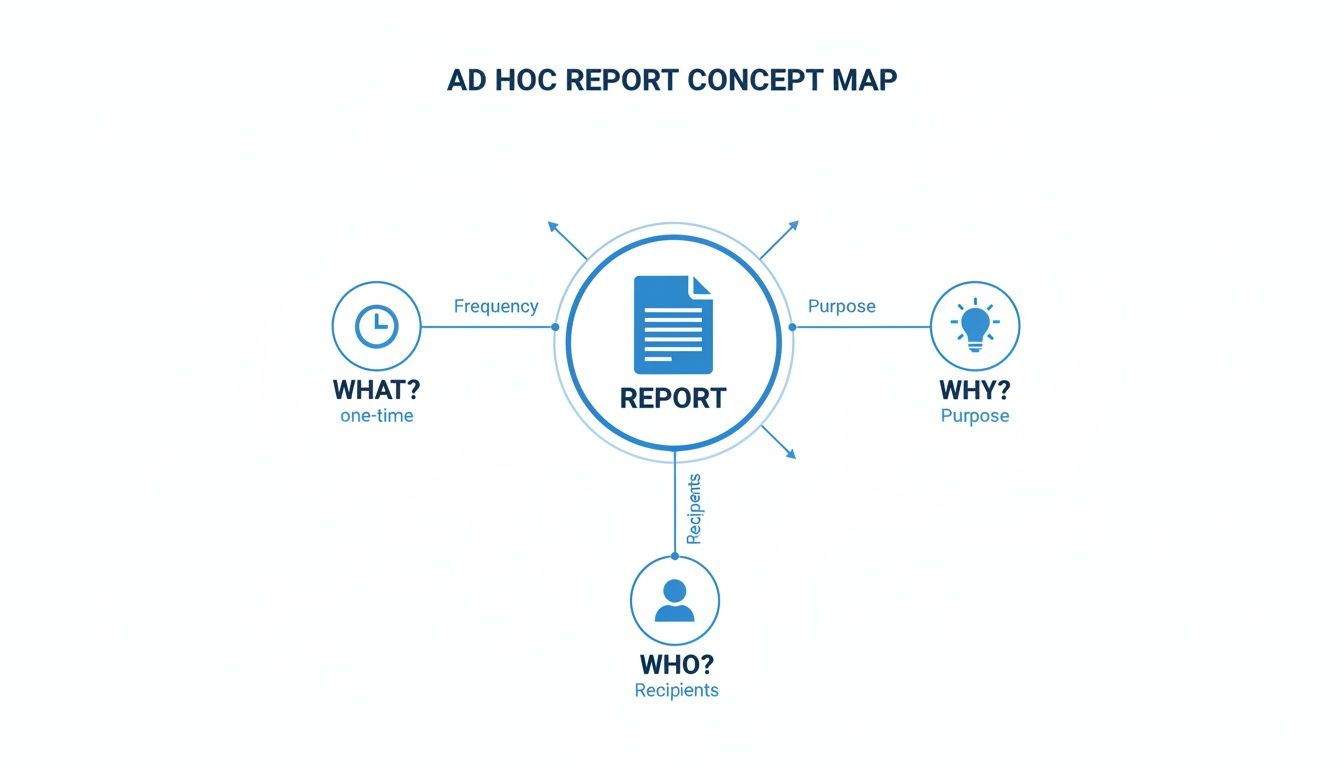
As you can see, the value of an ad hoc report comes from its ability to answer a specific "why" for a particular person or team at a single point in time. If you want to get better at creating these kinds of visual summaries, our guide on data visualization and dashboards is a great place to start.
The biggest difference really comes down to intent. Dashboards monitor, standard reports track, and ad hoc reports investigate. Each one plays a critical role in a healthy data strategy.
To get the full picture, it's also helpful to understand the fundamental differences between BI and reporting. This context helps show how each tool builds on the other to create a culture where decisions are truly informed by data.
To make it even clearer, I’ve put together a simple table that breaks down the key distinctions at a glance.
Choosing Your Tool Ad Hoc vs Standard vs Dashboard
This comparison table highlights the core differences between these three essential business intelligence tools, helping you decide which one is right for your specific need.
Attribute | Ad Hoc Report | Standard Report | Dashboard |
|---|---|---|---|
Purpose | Answer a specific, one-time business question. | Monitor performance against KPIs over time. | Provide a high-level, real-time visual summary. |
Frequency | On-demand, as needed. | Scheduled (daily, weekly, monthly). | Continuous, real-time updates. |
User | Business analysts, managers, executives. | Anyone in the organization. | Teams needing a quick operational view. |
Scope | Narrow and deep, focused on a single issue. | Broad, covering established metrics. | Wide but shallow, summarizing key data points. |
Ultimately, choosing the right tool depends entirely on the question you're trying to answer. Are you monitoring health, tracking progress, or digging for a root cause? Your answer points directly to the right tool for the job.
How Teams Use Ad Hoc Reporting in the Real World
So, we've covered the theory. But what does ad hoc reporting look like when the rubber meets the road? Let's move past the definitions and dig into real-life examples of how teams use these on-the-fly investigations to solve everyday business puzzles.
At its heart, ad hoc reporting turns your team into data detectives. They're not just reading scheduled updates; they're launching targeted inquiries to answer specific, urgent questions that a standard report just can't touch.
Of course, getting reliable answers means sticking to solid data analysis best practices. Garbage in, garbage out still applies, even when you’re moving fast.

Uncovering Insights Across Departments
Imagine a marketing team sees a blog post suddenly take off. Their standard dashboard shows the "what"—a huge spike in traffic. But an ad hoc report can find the "why." By quickly pulling referral data, they might discover a single influencer's post on a niche social network is driving all the traffic, a crucial insight for their next campaign.
Or think about a finance team trying to figure out an unexpected jump in expenses. Instead of waiting for the end-of-month summary, they can run an ad hoc query right now. This lets them drill down into the raw transaction data and pinpoint the exact project or vendor responsible, allowing them to fix the problem today, not discuss it weeks from now.
Ad hoc reporting transforms teams from passive observers of data to active participants in discovery. It empowers anyone to ask "Why did that happen?" and get a factual answer.
Here are a few more common scenarios where teams turn to ad hoc reports:
Operations: An operations manager might dig into shipping logs to find the root cause of a sudden spike in delivery delays, quickly isolating a struggling carrier or a bottleneck at a specific warehouse.
Sales: A sales leader could create a one-off report to understand why one rep is crushing their quota on a new product, comparing their deal size, sales cycle length, and customer profiles against the rest of the team.
Product: A product manager might investigate user engagement data right after a feature launch to see if the right customer segments are actually using it as intended.
These real-world examples show how on-demand reporting builds a more proactive, data-savvy culture. You can dive into more of these situations in our guide to self-service analytics use cases.
The Real-World Impact of On-Demand Insights
Knowing what an ad hoc report is only scratches the surface. The real story is about understanding their financial and competitive punch. These on-demand insights are what give a business the agility to pivot and react to market shifts with genuine speed.
Think about it. Instead of waiting weeks for a scheduled report to tell you what went wrong, your team can spot an opportunity or a threat the moment it happens. This completely changes the game, moving decision-making from a slow, backward-looking exercise to a dynamic, forward-looking one. It’s the difference between discussing last month’s problems and actively solving today’s.
And there's a huge operational benefit, too. When you empower teams with self-service analytics, you lift a massive weight off your IT and data departments. Business users can finally answer their own questions, freeing up your technical experts from a never-ending line of report requests.
Driving Growth and Smarter Operations
This shift lets IT focus on what they do best: high-impact strategic work like improving data governance, scaling infrastructure, or building advanced predictive models. They stop being a report factory and start being a strategic partner. The results you see from this change are tangible and hit the bottom line hard.
At its heart, ad hoc reporting builds a culture of curiosity and ownership. When anyone can dig into an anomaly or test a hunch with real data, the entire organization gets smarter and faster on its feet.
The numbers back this up. Recent industry research shows that organizations embracing ad hoc tools have seen their decision-making time for marketing pivots shrink by an average of 55%. That speed translates to money, with campaign ROI improving by 12–18% as teams quickly moved budgets to what was working right now.
On the flip side, roughly 60% of these companies reported a significant drop in IT support tickets for simple data pulls, proving the massive efficiency gains. You can find more details in this report on the impact of ad hoc analytics from industry research.
Ultimately, ad hoc reporting closes the gap between asking a question and taking action, giving you a serious competitive edge.
Navigating the Common Risks and Governance Hurdles
The power to pull a custom report whenever you want is a game-changer. But without some ground rules, that freedom can quickly turn into a free-for-all. It's a classic case of too much of a good thing.
Before you know it, you're wading through "data chaos." This is what happens when different teams start pulling their own numbers from unverified sources, leading to a dozen different "truths" floating around the company. The sales team's revenue number doesn't match finance's, and nobody knows which one is right.
This problem gets worse when analysts create tons of one-off reports without using certified datasets or consistent logic. A poorly written query can also hog server resources, slowing down the entire system for everyone else. It's a common growing pain for companies that jump into self-service analytics without a solid plan.
We saw this happen on a massive scale during the COVID-19 pandemic. Businesses needed fast answers and leaned heavily on quick, one-off analyses to pivot. The result? A 30–45% spike in siloed spreadsheets and custom reports. As Mode's blog on governance challenges points out, companies later had to scramble to consolidate everything just to stop departments from using conflicting KPIs.
Building a Practical Governance Framework
So, how do you prevent this mess? The answer isn't to lock everything down. It’s about creating a lightweight governance strategy that provides guardrails, not roadblocks.
The goal of governance isn't to restrict access. It's to empower people with trusted, reliable data so they can explore with confidence and speed.
A good framework makes sure ad hoc reports bring clarity, not confusion. It usually comes down to a few core ideas:
Certified Data Sources: Think of these as the "gold standard" datasets. You clearly mark which sources are clean, validated, and ready for analysis. This naturally guides everyone toward using reliable information.
User Training: You can’t just hand over the keys and walk away. A little training goes a long way. Teach people the basics of data best practices, how to use your BI tool, and most importantly, how to ask good questions.
Tool-Level Controls: The right BI platform helps you manage this behind the scenes. Administrators should be able to set permissions, control who sees what data, and keep an eye on query performance.
By putting these simple but effective elements in place, you can foster a healthy culture of on-demand analytics. For a deeper dive, check out our guide on data governance best practices.
How Modern Tools Are Redefining Ad Hoc Analysis
In the past, generating a one-off report meant emailing the IT or analytics team and then counting the days until you heard back. Business decisions often hit the brakes while data sat in someone else’s queue. It felt like waiting in line at the DMV—slow and frustrating.
Now, modern BI platforms hand the keys to the business user. They plug straight into live data sources and offer drag-and-drop design so anyone can build charts, tables or dashboards without writing a single SQL query.
Here are some of the features that set today’s tools apart:
Live Data Connections: Direct links to databases, cloud applications and spreadsheets for real-time insights.
Intuitive Interfaces: Visual builders that guide users step by step, no coding required.
Template Libraries: Ready-made report layouts to jump-start your analysis.
And there’s more: artificial intelligence is rewriting the rules. With natural language query (NLQ), you just type or speak your question like you would into a search engine—and the system delivers an answer in seconds.

The Rise Of AI In Self-Service Analytics
This shift isn’t a minor tweak—it’s a new mindset. By 2024, roughly 70% of new feature requests for ad hoc reporting tools focused on AI-driven capabilities like NLQ and automated insights, rather than basic chart builders.
Imagine asking, “Which marketing channels had the highest customer acquisition cost last quarter?” and getting a clear, visual answer in moments—not days.
This trend also has procurement teams rethinking their wish lists. Instead of prioritizing flashy dashboards alone, 62% of IT leaders now rank enterprise data governance among their top-three must-have features.
For more on how AI is shaping analytics trends, see How AI is shaping analytics trends from recent reports. Modern platforms are making ad hoc analysis faster, more accessible and far more secure than ever before.
Your Ad Hoc Reporting Questions, Answered
Let's clear up a few common questions that pop up when people start talking about ad hoc reports.
Who Actually Builds Ad Hoc Reports?
It used to be that if you needed a custom report, you had to file a ticket with the IT department or a data analyst team. They were the only ones who knew how to write the code to pull the right information, which often created a frustrating backlog.
That's changed. With modern business intelligence (BI) tools, people in marketing, sales, finance—you name it—can now build their own reports. The power has shifted from a small group of technical experts to the people on the front lines who understand the business context best.
Are They Strictly a One-And-Done Thing?
Not always. While the initial spark for an ad hoc report is usually a single, specific question, its life doesn't have to end there. Sometimes, a one-off report uncovers a critical metric that nobody was tracking before.
When a one-off report proves to be incredibly valuable, it often gets a promotion. It might be saved and automated to run weekly, becoming a new standard report, or its key chart might find a permanent home on a team dashboard.
What Skills Do I Need to Create Them?
The most critical skill isn't technical at all—it's business curiosity. You have to know what question to ask and why the answer is important. The technical hurdles have gotten a lot lower.
Modern tools have come a long way. Many now let you ask questions in plain English or use simple drag-and-drop interfaces to build your analysis. This means you don't necessarily need to be a wizard in languages like SQL to get the answers you're looking for.
Ready to empower your team to answer their own data questions in seconds? Querio uses AI to turn business curiosity into accurate, actionable insights without waiting for an analyst. Explore how Querio makes ad hoc reporting accessible to everyone.

