Business Intelligence
data modeling best practices
Build clear, scalable data models: define grain, align metrics, pick the right schema, enforce naming, testing, and dbt workflows.
A strong data model is the backbone of reliable analytics. Poorly designed models can lead to errors, conflicting dashboards, and AI making incorrect predictions. On the other hand, clear and structured models improve decision-making, reduce inconsistencies, and ensure scalability as businesses grow.
Key takeaways from this guide:
Align models with business needs: Define key metrics, terms, and goals to avoid confusion across teams.
Choose the right techniques: Use star schemas for fast reporting, data vaults for integration and auditing, and normalization for transactional systems.
Define data granularity: Specify what each row represents to ensure accuracy and prevent errors.
Adopt clear naming conventions: Consistent, logical names reduce analyst confusion by 50%.
Prioritize data quality: Version control, testing, and monitoring prevent costly mistakes.
Leverage tools like dbt: Simplify transformations, improve efficiency, and maintain consistency across systems.
These practices help businesses make faster, data-driven decisions while minimizing errors and technical debt.
Data Modeling Best Practices! Best Practices for Designing Your Data Models!
Aligning Data Models with Business Requirements
A data model should do more than just store data - it needs to address the specific needs of the business. Even the most technically advanced schema loses its purpose if it can't answer the practical questions driving decisions. For instance, your sales team might need weekly insights, while executives focus on monthly revenue trends. Complicating matters, different departments often interpret key terms differently. Take the term "customer": Marketing might define it as anyone who downloaded a whitepaper, Finance might only count paying accounts, and Sales might track revenue at contract signing, while Accounting waits for payment clearance. These inconsistencies can lead to conflicting dashboards, eroding trust in analytics. When stakeholders see data that "doesn't add up", they often fall back on spreadsheets, which undermines the investment you've made in your data platform. Aligning data models with business needs is the foundation for setting clear goals and metrics.
Setting Clear Goals and Metrics
Start by interviewing key stakeholders to define specific metrics and KPIs. Avoid vague goals like "better customer insights." Instead, break down business questions into four clear components: Facts, Dimensions, Filters, and Order [7].
Create a conceptual model in plain language and ensure stakeholders approve definitions for key entities [1][9]. This step ensures everyone - from executives to engineers - is aligned.
Next, focus on defining the grain of your data. The grain specifies what a single row in the dataset represents. For example, it could be "one row per line item in an order" or "one row per daily summary for each store." A well-defined grain acts like a contract, preventing double counting and ensuring consistent metric calculations. Organizations that clearly define their data grain can reduce inconsistencies by up to 40% [1].
Once goals are clear, structure your data models to support easy and intuitive reporting.
Structuring Models for Reporting
When designing models, prioritize self-service analytics over purely efficient storage. A star schema - with a central fact table linked to dimension tables - makes it easier for users to "slice and dice" data without writing complicated SQL queries [1][10]. For instance, a sales fact table might link to dimension tables for Date, Customer, Product, and Store. This setup allows analysts to quickly identify trends, like top-performing products by region or time period.
In cloud-based environments, denormalization often works better than traditional normalization. Flattened, wider tables in the Gold layer reduce the need for joins, cutting compute costs and speeding up dashboard performance [10][2]. While transactional systems benefit from normalized structures to maintain data integrity, analytical data warehouse models focus on simplifying queries for end users.
To further streamline reporting, precompute complex calculations during the transformation process. This not only ensures faster reporting but also prepares your data for AI applications. Machine learning algorithms work best when they have access to clean, pre-aggregated features rather than raw transactional data [7][8].
Core Data Modeling Techniques
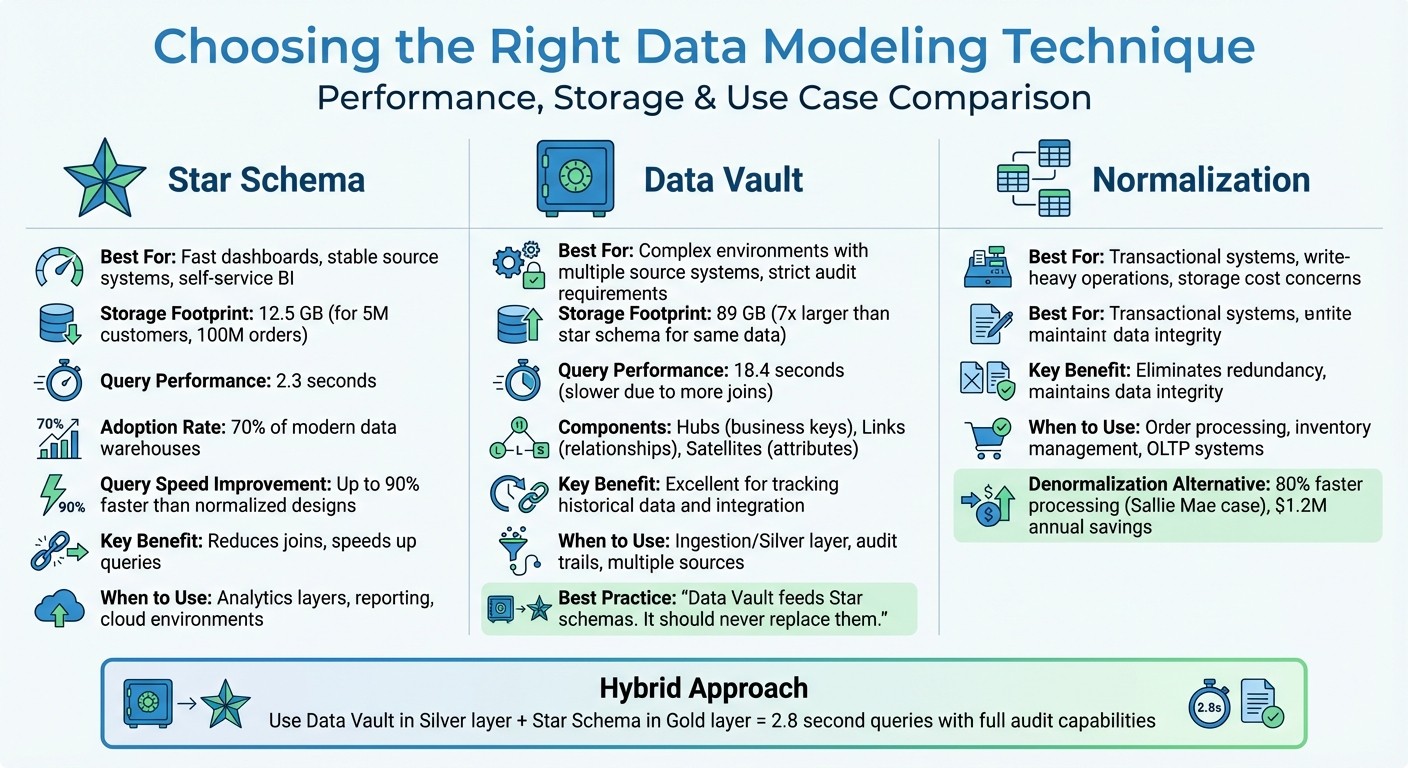
Data Modeling Techniques Comparison: Star Schema vs Data Vault vs Normalization
When designing your data architecture, picking the right modeling technique is a game-changer. It can make queries faster, reduce maintenance headaches, and keep your system flexible. The three most common approaches - star schema, data vault, and normalization - each serve specific purposes. Understanding when to use each can save you from costly redesigns down the road.
"The pain of thoughtful upfront design is significantly less than the pain of rebuilding a poorly architected system." - Kathryn Chubb, dbt Labs [5]
A smart starting point is the star schema. Add complexity only if your requirements demand it. For example, in a January 2026 case study, Reliable Data Engineering used a star schema to model data for 5 million customers and 100 million orders. This resulted in a 12.5 GB footprint and 2.3-second query times. When they switched the same data to a data vault for audit purposes, storage ballooned to 89 GB, and query times slowed to 18.4 seconds. They addressed this by layering a star schema "information mart" on top of the vault, restoring query times to 2.8 seconds while keeping the audit benefits [13].
Star Schema Design
A star schema centers around a fact table, which holds measurable data like revenue or order quantities, surrounded by dimension tables that provide context (e.g., customer names, product categories, dates). This design is ideal for platforms like Snowflake and BigQuery because it reduces the number of joins needed, speeding up queries. It’s also perfect for self-service analytics, as discussed earlier.
One key practice is defining the grain of your fact table in a single sentence, such as: "One row represents one product purchase by one customer." This clarity prevents double counting and ensures metrics remain consistent.
"If your team can't state the grain in one sentence, your Star schema is broken." - The Data Forge [12]
Star schemas deliberately duplicate some dimension data to simplify queries. While this increases storage slightly, it can cut query times by up to 90% compared to normalized designs [15]. Given that cloud storage is cheap but compute costs can add up, this trade-off makes sense. Unsurprisingly, over 70% of modern data warehouses use star schemas for their analytical layers [15].
Data Vault Modeling
The data vault approach is designed for the ingestion layer and works well in environments with multiple source systems or strict audit requirements. It uses three core components: Hubs (business keys like Customer ID), Links (relationships between entities), and Satellites (attributes and historical changes). While this structure excels at tracking historical data and integrating sources, it requires more joins, which can slow down reporting [12][13].
In the Reliable Data Engineering example, moving to a data vault caused storage to increase by 7x compared to the star schema [13]. A common solution is to use the data vault in the Silver layer for integration and history tracking, then build star schema marts in the Gold layer for faster reporting.
"Data Vault feeds Star schemas. It should never replace them." - The Data Forge [12]
If you’re working with a single source system or a relatively stable schema, you can often skip the data vault altogether. Many analytics teams never need it [12]. However, in more complex environments, combining both approaches can give you the best of both worlds.
Normalization vs. Denormalization
Normalization breaks data into smaller, related tables to eliminate redundancy and maintain integrity. It’s the go-to for transactional systems where frequent updates require consistency. For example, an e-commerce platform’s order processing system benefits from normalization to avoid duplicate customer records and ensure accurate inventory counts.
Denormalization, on the other hand, consolidates data into wider tables, trading storage efficiency for faster queries. This approach works best for analytical environments. For instance, Sallie Mae improved processing speeds by 80% and saved $1.2M annually by using optimized denormalized models in Snowflake [14].
The general rule is simple: normalize for transactional systems and denormalize for analytics [1]. A typical data pipeline might look like this: the Bronze layer stores raw, normalized data from source systems, the Silver layer uses data vault for integration and audit trails, and the Gold layer adopts denormalized star schemas for speed and simplicity.
Modeling Approach | When to Apply |
|---|---|
Star Schema | Fast dashboards, stable source systems, and self-service BI |
Data Vault | Complex environments with multiple source systems and strict audit requirements |
Normalization | Transactional systems or when storage costs and write-heavy operations are a concern |
Designing Accurate and Scalable Data Models
Now that we've covered aligning data models with business needs, let's dive into practical steps for ensuring both accuracy and scalability. Once you've chosen your modeling technique, focus on three key practices: defining the right level of detail, setting clear naming conventions, and implementing robust quality controls.
Defining Data Granularity
The "grain" of a table - essentially, what one row represents - is the foundation for building accurate models. Before creating any fact table, define its grain in a single, clear sentence. For instance: "One row per sales order line item" or "One row per account per month." This simple step can make troubleshooting much easier.
"By explicitly stating the grain for every single table, you're creating a contract. This contract is the unbreakable rule that governs all analysis, ensuring every calculation is accurate and every report is consistent." - Querio [1]
Storing data at the atomic grain - the smallest possible level of detail, like individual transactions - offers the most flexibility. You can always aggregate data to higher levels (e.g., daily or monthly), but you can't break down pre-aggregated data into smaller parts. Companies that define a clear grain experience a 40% drop in data inconsistencies [1].
However, storing data at such a granular level requires careful planning. For example, high-cardinality columns (those with many unique values) can slow down queries and consume more memory. Splitting a DateTime column into separate Date and Time columns can reduce model size by 20% to 40% while improving compression [3].
Once you've nailed down granularity, the next step is to ensure clarity with consistent naming conventions.
Applying Consistent Naming Standards
After defining granularity, adopting clear and consistent naming conventions is essential for keeping your models scalable and easy to understand. Here are some best practices:
Use plural nouns for table names (e.g.,
customers,orders).Stick to snake_case for column names (e.g.,
revenue_usd,created_at).Format primary keys as
<object>_id(e.g.,customer_id,order_id) and prefix boolean columns with terms likeis_orhas_(e.g.,is_active,has_discount).Use
_atfor timestamps (e.g.,created_at) and_datefor date-only fields.Avoid unclear abbreviations -
amt3is far less intuitive thanrevenue_usd.
Standardized naming reduces confusion among analysts by 50% [1]. To keep everyone aligned, document your naming conventions in a style guide. This guide should include approved abbreviations, forbidden terms, and any domain-specific vocabulary. Additionally, ordering columns consistently - starting with IDs, followed by strings, numerics, booleans, dates, and timestamps - can make tables easier to read [17].
Implementing Data Quality Controls
Data quality controls are critical for preventing errors from creeping into your reports. Start with shift-left testing, which means running validation checks early in the development process. This approach reduces the cost and complexity of fixing issues later [16].
Treat analytics work like software development. Use version control, work in non-production branches, and require peer reviews through pull requests before changes are merged [16][19]. Automated CI/CD pipelines should test data in pre-production environments to catch errors before they impact users.
Even after deployment, continuous monitoring is key. For example, regularly confirm that the count of a primary key column matches the number of unique rows to ensure data integrity [18]. Security measures like Role-Based Access Control (RBAC) and Single Sign-On (SSO) can further protect your data from unauthorized changes [16].
Poor-quality data costs businesses an average of $406 million annually [16]. By prioritizing strong quality controls and governance from the start, you can avoid costly mistakes and ensure reliable insights.
Tools and Technology for Data Modeling
Modern tools like dbt are transforming how teams approach data modeling, making processes more streamlined and scalable. dbt has become a go-to for SQL-first data modeling, allowing teams to break down complex transformations into manageable, version-controlled components. This modular structure simplifies maintenance and supports scalability over time [23][24].
One standout feature of dbt is its ability to simplify warehouse-specific syntax. Instead of writing separate code for platforms like Snowflake or BigQuery, you just specify what you want to create, and dbt takes care of the rest. Organizations using dbt for SQL data modeling have reported 67% faster data processing and a 335% ROI on their data initiatives [11].
Building Models with dbt
dbt structures data transformations into three layers:
Staging: Cleans raw data.
Intermediate: Adds business logic.
Marts: Produces final tables for reporting.
This approach avoids the pitfalls of massive, hard-to-maintain SQL scripts. Instead, each layer focuses on a specific task, making debugging and updates much simpler [22][24].
"If you cannot explain what a model does in one sentence, it is doing too much." – Nawaz Dhandala, Author, OneUptime [24]
Version control is another key strength of dbt. Every transformation is managed through Git, with pull requests and peer reviews ensuring quality. Combined with automated testing for things like primary key uniqueness and relationship integrity, dbt helps catch errors early - before they affect dashboards or reports [25][11].
For faster workflows, dbt offers tools like dbt Copilot, which uses AI to generate SQL based on natural language prompts, and dbt Canvas, a visual interface for building models without writing code. Even with its drag-and-drop functionality, dbt Canvas still creates version-controlled SQL in the background [21].
Integrating with dbt-built models, Querio allows analysts to query governed tables directly from the warehouse using plain English. This ensures that all analyses align with the logic defined in the dbt project, laying the groundwork for efficient materialization strategies.
Optimizing Materialization Strategies
The way you materialize a model - whether as a view, table, or incremental build - can significantly affect query speed and costs. A tiered approach works best: start with a view, upgrade to a table for better performance, and use incremental materialization for large datasets when build times become a bottleneck [20].
Materialization Type | Best Use Case | Performance Impact |
|---|---|---|
View | Small datasets or frequently changing data | Quick to build, but queries run every time [24] |
Table | Frequently accessed models for BI tools like Querio | Slower to build, but queries are faster [24] |
Incremental | Large datasets (millions of rows) | Processes only new or updated records, saving resources [24] |
Using state-aware orchestration to rebuild only updated models can cut warehouse compute costs by 50% to 70% [11]. With global data creation expected to hit 149 zettabytes in 2024 and surpass 394 zettabytes by 2028, optimizing storage and refresh processes is becoming increasingly important [21].
Querio benefits directly from these strategies. When dbt models are materialized as tables, Querio can query them instantly without reprocessing raw data. This ensures faster responses for users while avoiding duplicate data and unnecessary extracts.
Managing Governance and Security
Once models and materialization strategies are in place, centralized governance ensures consistency across analyses. Governance isn't just about access controls - it’s about maintaining uniform business logic across dashboards, analyses, and AI-generated responses. The dbt Semantic Layer (MetricFlow) helps by centralizing metric definitions in YAML files. For example, a calculation like "Active User" is defined once and applied consistently across all tools [4][21]. This eliminates discrepancies in key metrics.
"If business logic stays in dashboards, governance fails. Push transformations into dbt and keep BI focused on visualization." – Valentina Vianna, Community Manager [25]
Large Language Models are up to 300% more accurate when querying a well-defined semantic layer compared to raw tables [4]. Querio extends this governance by providing a shared context layer where data teams define joins, metrics, and business terms. These definitions flow seamlessly into notebooks, dashboards, and AI-generated insights. For instance, when an analyst asks, "What's our monthly recurring revenue?" in Querio, the platform uses the same certified logic maintained in dbt, ensuring accuracy and consistency.
Security measures like RBAC (Role-Based Access Control) and SSO (Single Sign-On) protect data from unauthorized changes [16]. By separating development, staging, and production environments, teams can validate transformations before they impact user-facing reports [25].
Maintaining and Updating Data Models
Once you've followed the best practices for designing data models, the next step is ensuring they stay accurate and efficient over time. Regular updates are crucial to keep models aligned with changing business needs and to avoid accumulating technical debt. Even the most carefully designed models can drift from their original purpose if left unchecked, leading to inconsistent metrics and malfunctioning dashboards.
Version Control and Documentation
Every data project should live in Git, with all changes reviewed through pull requests before deployment. This approach minimizes the risk of accidental overwrites and keeps a clear audit trail. When introducing breaking changes, version your models instead of overwriting files. For example, create customer_v2.sql rather than modifying the existing file. To ease transitions, include a deprecation_date so downstream users have time to adapt.
"A data model without documentation is a puzzle that only its creator can solve. And even they forget the details after a few months." – Datalakehouse Hub [2]
Good documentation is essential. Aim to document at three levels:
Column level: Include the meaning and origin of each field.
Table level: Specify the grain and ownership of the table.
Model level: Explain how the model connects to business processes.
Tools like dbt can automatically generate user-friendly documentation from YAML files, making it easier for business teams to understand the data. Additionally, standardize naming conventions across your team. For example:
Use
snake_casefor field names.Add
_atto timestamps for clarity.Prefix booleans with
is_orhas_.
Solid documentation paired with consistent naming conventions makes models easier to understand and maintain. Regular audits further ensure models stay relevant and performant.
Conducting Regular Model Audits
Routine audits are critical for identifying potential issues and ensuring that data models keep up with evolving business needs. For instance, reviewing database logs can help pinpoint slow queries, which may indicate a need to convert views into materialized tables. Always confirm that the grain of each fact table is clearly defined to avoid confusion.
An example of the value of audits comes from Bilt Rewards, a loyalty platform. In early 2026, they implemented state-aware orchestration to track which models had changed. By skipping unchanged downstream nodes during execution, they slashed their Snowflake credit usage by nearly 70% [6]. Similarly, organizations that enforce strict versioning and audit cross-project dependencies have seen CI/CD failure rates drop by 35% [6].
Audits can also help streamline models by removing unnecessary elements. For example, unused columns identified during reviews can shrink enterprise data models by 20% to 40% [3]. Tools like VertiPaq Analyzer are particularly useful for spotting high-cardinality columns - such as timestamps with second-level precision - that consume storage without providing meaningful value. Regular trimming ensures your models remain lean and efficient.
Conclusion
Effective data modeling lays the groundwork for dependable analytics. By defining clear data grains, maintaining consistent naming conventions, and aligning models with business goals, organizations create a reliable single source of truth. This approach not only eliminates conflicting data but also reduces inefficiencies. In fact, companies have reported up to a 335% return on investment (ROI) from data initiatives [11]. Additionally, well-structured models help lower technical debt and cut analyst confusion by 50% [1], making it easier to onboard new team members and expand analytics across departments.
As AI-driven analytics become more prevalent, the importance of thoughtful data modeling grows. AI tools and natural language processing rely on clean, structured data to produce accurate predictions and SQL queries. Poorly designed models can lead to incorrect outcomes and a loss of trust. As Querio highlights:
"An AI-ready data model isn't some separate, mystical creation. It's the natural evolution of a well-architected data model built for clarity, scalability, and trust from the very beginning." [1]
This focus on accuracy emphasizes the need for tools that simplify complex data integration. Querio addresses these challenges by automating relationship detection, offering visual drag-and-drop modeling, and enabling natural language querying - removing the need for manual SQL joins. The platform acts as a blueprint, converting plain-English queries into precise SQL, ensuring every result is both accurate and easy to verify. By centralizing governance and enforcing naming standards automatically, Querio ensures that data models remain consistent and trustworthy over time.
Whether you're designing your first star schema or enhancing modern data warehouse architectures, these practices pave the way for faster decisions, reduced costs, and readiness for AI-powered analytics. With the right strategies and tools like Querio, raw data can evolve into a strategic asset that drives meaningful business outcomes.
FAQs
How do I choose between a star schema and a data vault?
Choosing between a star schema and a data vault comes down to your specific data warehouse requirements, like query speed, data complexity, and how much scalability you need.
A star schema is denormalized, making it perfect for fast and straightforward analytics or business intelligence (BI) reporting. On the other hand, a data vault is more flexible, supports historical tracking, and scales well in complex or constantly changing environments.
If speed and simplicity are your priorities, a star schema might be the better choice. But if you need a system that can adapt to evolving needs, a data vault is worth considering.
What’s the best way to define a table’s grain?
Defining a table’s grain means pinpointing the exact combination of columns that makes each row unique. For example, a row could represent a single transaction or a user’s activity on a specific day. Once you've identified this unique combination, you can create a surrogate key based on it. This helps maintain consistency and ensures your data model stays clear and organized.
Which dbt tests should I start with first?
When building confidence in your data, it's important to begin with tests that tackle the most essential quality issues. Here are a few key types to focus on:
Unique tests: These ensure that primary and surrogate keys are free of duplicates, maintaining the integrity of your data structure.
Not_null tests: Critical columns should never contain null values, so these tests help verify their completeness.
Relationships tests: These check for referential integrity, confirming that links between tables are accurate and consistent.
These basic checks lay the groundwork for reliable data. Once these are in place, you can branch out into more specific tests, such as validating accepted values or creating custom checks to further enhance your data's reliability.
Related Blog Posts


