Business Intelligence
understanding key performance indicators
Choose and track 7-10 SMART KPIs, balance leading and lagging indicators, and use real-time tools to make faster, data-driven decisions.
KPIs (Key Performance Indicators) are measurable values that track progress toward specific business goals. Unlike general metrics, KPIs focus on what truly matters for achieving objectives. For example, while website traffic is a metric, a KPI might be the trial-to-paid conversion rate, directly tied to revenue growth.
Here's why KPIs are critical:
They align daily efforts with broader business goals.
Help predict outcomes (leading indicators) and evaluate past performance (lagging indicators).
Focus on a few high-impact metrics (10 or fewer) to avoid distraction.
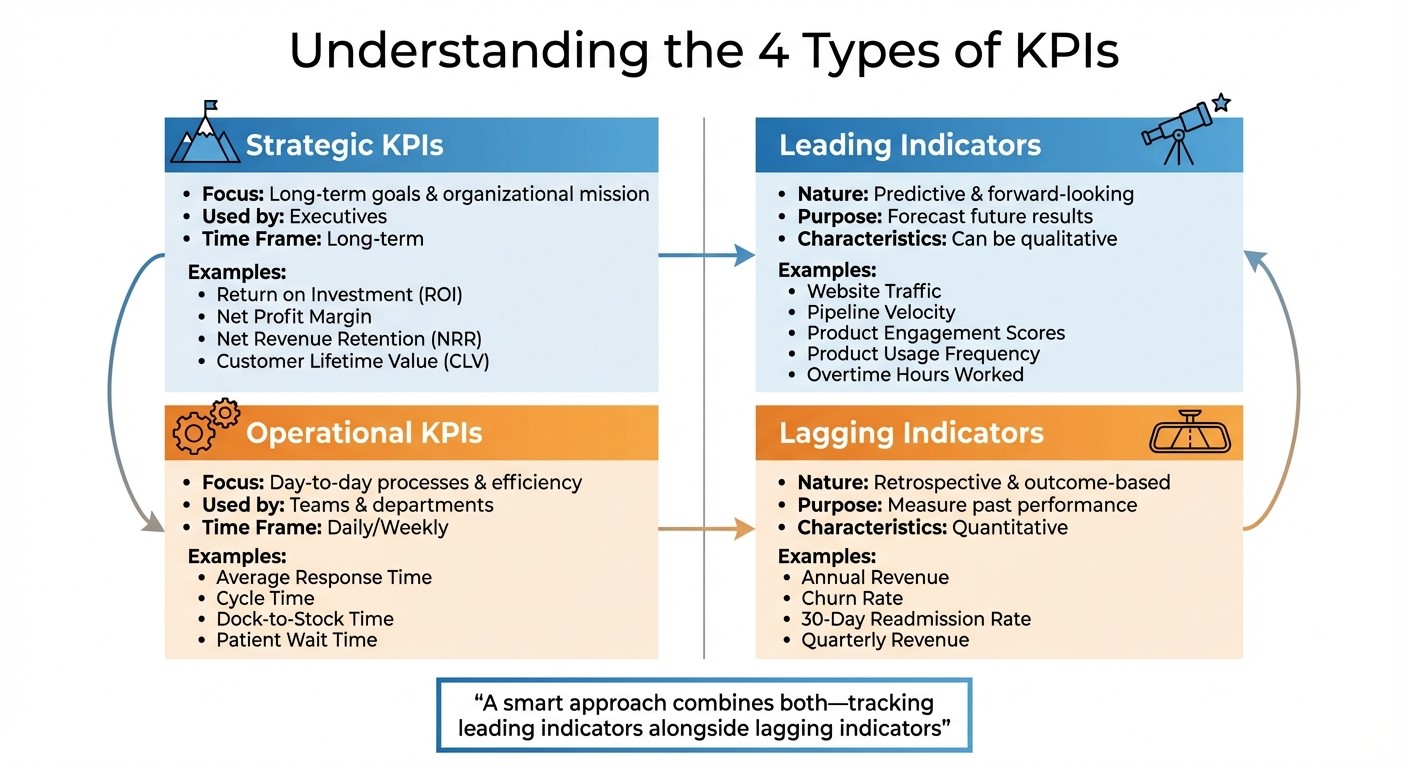
Types of KPIs:
Strategic KPIs: Long-term goals (e.g., ROI, net profit margin).
Operational KPIs: Day-to-day processes (e.g., response time, cycle time).
Leading Indicators: Predict future results (e.g., product engagement).
Lagging Indicators: Reflect past outcomes (e.g., churn rate).
To define effective KPIs, use the SMART framework: Specific, Measurable, Achievable, Relevant, Time-bound. Tools like Querio simplify tracking by connecting directly to live data, offering real-time dashboards, and automating alerts for quick decision-making.
Focus on KPIs that matter most and review them regularly to ensure they remain aligned with your business goals.
What are KPIs and Metrics? | Data Fundamental for Beginners
Types of KPIs and Their Applications
Types of KPIs: Strategic vs Operational and Leading vs Lagging Indicators
Now that we’ve covered the basics of KPIs, let’s dive into their different types and how they’re applied. Not all KPIs are created equal, and understanding the distinctions can help you focus on the metrics that align with your business objectives.
Strategic vs. Operational KPIs
Strategic KPIs focus on the big picture - tracking progress toward long-term goals and the overall mission of the organization. These metrics are often used by executives to assess the company’s health and direction. Examples include return on investment (ROI) and net profit margin, which provide insights into financial performance and sustainability.
On the flip side, Operational KPIs are all about the here and now. They measure the performance of specific processes, teams, or locations on a daily or weekly basis. For instance, metrics like average response time, cycle time, or dock-to-stock time in logistics are operational KPIs that ensure efficiency in day-to-day activities. Together, strategic KPIs guide long-term planning, while operational KPIs ensure the smooth running of daily operations.
Leading vs. Lagging Indicators
The difference between leading and lagging indicators is key to making informed decisions. Leading indicators are predictive - they offer a glimpse into what’s likely to happen based on current actions. For example, metrics like website traffic, pipeline velocity, or product engagement scores can signal future growth or challenges. In manufacturing, tracking overtime hours worked can indicate potential declines in production quality.
Lagging indicators, on the other hand, look backward. They measure outcomes that have already occurred, such as annual revenue, churn rate, or 30-day readmission rates in healthcare. These metrics confirm the results of past efforts. While lagging indicators are often quantitative and retrospective, leading indicators are more forward-looking and can be qualitative. A smart approach combines both - tracking something like product usage frequency (leading) alongside churn rate (lagging) helps businesses anticipate and address customer retention issues.
"The difference between a KPI and a vanity metric is simple. A KPI tells you whether to change course, add resources, or double down. A vanity metric just looks good in a deck." - Xavier Pladevall, Co-founder & CEO, Index.app [4]
KPI Examples by Industry
Different industries rely on different KPIs to gauge success. Here’s how strategic and operational KPIs come into play across various sectors:
Industry | Strategic KPIs | Operational KPIs |
|---|---|---|
Fintech | Return on Equity (ROE), Net Profit Margin | Current Ratio, Days Sales Outstanding |
Logistics | Perfect Order Rate, Transportation Cost as % of Sales | Dock-to-Stock Time, Freight Cost Per Unit |
Ecommerce | Customer Lifetime Value (CLV), Same-Store Sales Growth | Cart Abandonment Rate, Average Order Value (AOV) |
Healthtech | 30-Day Readmission Rate, Treatment Success Rate | Patient Wait Time, Bed Occupancy Rate |
For SaaS companies, Net Revenue Retention (NRR) above 110% signals healthy growth within the existing customer base [4]. In ecommerce, a conversion rate of 2% to 3% is a common benchmark. Meanwhile, healthcare organizations that focus on 7–8 key strategic measures can achieve up to a 22.5% peak completion rate [5][6].
How to Define and Align KPIs with Business Goals
Defining KPIs isn’t about tracking every piece of data you can find. Instead, focus on three to five core business objectives and choose metrics that genuinely reflect progress toward those goals. This way, you avoid wasting time on metrics that might be easy to measure but don’t provide meaningful insights [1].
Steps to Define Effective KPIs
The SMART framework, introduced by George T. Doran in 1981, remains a trusted method for crafting effective KPIs [7]. Each KPI should meet these criteria:
Specific: Clearly defined and unambiguous.
Measurable: Quantifiable in numbers, percentages, or dollar amounts.
Achievable: Realistic given the resources available.
Relevant: Directly tied to your strategic goals.
Time-bound: Associated with a clear deadline.
For example, instead of saying, “improve customer satisfaction,” a SMART KPI would be: “achieve a customer satisfaction score above 90% by the end of Q3 2026.”
Some organizations expand this framework to SMARTER, adding Evaluate and Revise to ensure KPIs evolve with changing market conditions [7]. To keep things organized, document each KPI’s formula, unit of measurement, and time frame. Assign ownership to specific individuals or teams to avoid confusion and ensure accountability [7][9].
"Tracking every KPI available is like highlighting every sentence in a textbook - it defeats the purpose, since the important things get buried in the clutter." - Julia Martins, Asana [10]
Once you’ve defined your KPIs, the next step is aligning them with your organization’s overarching strategy.
Aligning KPIs with Organizational Strategy
Studies show that people can effectively monitor only 5 to 10 variables at a time [1]. So, it’s essential to focus on KPIs that are directly tied to your strategic goals. Typically, a few key metrics per team are enough to maintain focus, with each team owning two to four metrics at most. This clarity ensures everyone understands what’s most important.
To align KPIs with your strategy, integrate them into your operations using these steps:
Share KPIs across departments. For example, marketing’s qualified lead targets should be visible to the sales team to ensure alignment [8].
Balance leading indicators (predictive metrics like website traffic or pipeline velocity) with lagging indicators (outcome metrics like quarterly revenue or churn rate) [1].
Avoid optimizing a single metric in isolation. Pair primary KPIs with supporting metrics to maintain balance. For instance, if tracking lead volume, also monitor lead-to-customer conversion rates to avoid chasing vanity metrics [1].
Set a review schedule. Include weekly team check-ins for tactical adjustments, monthly strategic reviews for leadership, and quarterly audits to retire outdated KPIs [1].
Tracking and Monitoring KPIs with Querio
Once you've defined and aligned your KPIs, keeping a close eye on them is essential to act quickly. Relying on manual reporting can lead to delays, slowing down your ability to make decisions. On the other hand, having real-time access to your metrics means you can respond immediately to any changes in performance.
Visualizing and Tracking KPIs
Did you know that the human brain processes visual information much faster than text - images can be understood in as little as 13 milliseconds [11]? That’s why dashboards are so powerful. They take raw data and turn it into insights you can act on.
Querio integrates directly with live data warehouses like Snowflake, BigQuery, and PostgreSQL, so there’s no need to worry about duplicating data. Dashboards update in real time as new information flows into the warehouse, ensuring you’re always working with the latest insights. These dashboards can also be embedded into tools your team already uses - whether it's customer-facing apps or internal systems like CRMs - making your KPIs accessible wherever they’re needed.
Beyond just displaying real-time data, Querio takes it a step further by using AI to automate analysis and simplify decision-making.
Using Querio's AI-Powered Features
Querio allows you to ask about your KPIs in plain English, cutting out the wait for reports. Its AI translates your questions into SQL or Python code that you can review for accuracy. This transparency ensures you can trust the data and understand how the results are being calculated.
The AI doesn’t stop there. It standardizes metrics through a semantic context layer, so everyone in your organization sees consistent calculations for terms like "churn rate" or "gross margin." It also sends automated alerts when KPI thresholds are reached, keeping your team informed in real time. Plus, Querio’s analytics notebooks let you debug AI-generated queries, refine them, and even apply predictive models like linear regression - all without needing to export your data. This shifts your focus from simply reporting on "what happened" to forecasting "what’s likely to happen" next.
Analyzing and Adapting KPIs for Better Decision-Making
Reviewing KPI Performance
Keeping KPIs relevant and actionable is key to making smarter decisions. With global data creation expected to exceed 180 zettabytes by 2025 [12], it’s easy to get lost in a sea of metrics. Establishing a regular review schedule can help cut through the noise. The frequency of these reviews should align with the pace of each KPI:
Daily huddles for fast-moving metrics like tickets resolved.
Weekly meetings for indicators such as pipeline growth.
Monthly reviews for strategic metrics like customer acquisition cost (CAC) or monthly recurring revenue (MRR).
Quarterly reviews for long-term metrics like net profit or market share [12][3].
Each KPI should have a specific owner who is accountable for tracking changes and driving improvements [12]. To ensure your metrics remain effective, conduct a KPI audit twice a year. During this process, eliminate any metrics that no longer spark discussions, have been replaced by better indicators, or don’t align with your current goals [12][1]. This regular evaluation keeps your focus sharp and relevant.
"The real value of a KPI isn't the number itself, but the conversation it starts." – Querio [12]
Balancing metrics with complementary guardrails can prevent unintended consequences. For instance, if you're tracking lead volume, also measure lead quality to avoid sacrificing conversion rates for quantity [1]. Using tiered targets - Baseline (minimum), Target (expected), and Stretch (ambitious) - can motivate teams and provide clearer performance benchmarks [12].
These structured reviews create a solid foundation for leveraging advanced analytics to predict and adapt performance.
Driving Insights with Querio's Analytics Tools
Querio’s analytics tools take KPI analysis to the next level, transforming it into a dynamic, real-time process. Unlike traditional dashboards that simply display metrics, Querio’s reactive notebooks allow for deeper exploration of performance trends. You can fine-tune AI-generated queries, adjust them using SQL or Python, and even apply predictive models - all within the same platform. Since these notebooks update automatically as data or logic changes, your analysis stays both accurate and up-to-date.
Querio’s context layer ensures your entire organization calculates metrics consistently. For example, once you define a key figure like churn rate or customer lifetime value, that definition is applied across all analyses, dashboards, and reports. This eliminates confusion caused by inconsistent formulas. Additionally, automated threshold alerts can notify you via Slack or email the moment a KPI crosses a critical boundary, enabling you to address issues in real-time rather than waiting for end-of-month reports [2].
This shift from reactive reporting to proactive forecasting changes the focus from "what happened?" to "what’s likely to happen next?" By leveraging tools like Querio, teams can make informed decisions faster and stay ahead of the curve.
Conclusion
KPIs act as the heartbeat of your business, offering a clear picture of whether you're heading in the right direction. To stay focused, it's best to track just 7–10 top-level KPIs. Any more, and you risk spreading your attention too thin. As KISSmetrics wisely points out, "When everything is a KPI, nothing is" [1].
The best organizations don't see KPIs as static; they adapt them as strategies evolve. Regular reviews - like quarterly audits - help phase out outdated metrics. Aligning the review frequency with each KPI's nature is also key: operational KPIs might need daily checks, while strategic ones can be reviewed monthly or quarterly. Research backs this up, showing that humans struggle to effectively monitor more than 5 to 10 variables at a time [1].
Querio takes this a step further, shifting businesses from reactive reporting to proactive decision-making. By connecting directly to your data warehouse, it translates plain English questions into precise SQL and Python queries, cutting out the wait for analyst assistance. Plus, its shared context layer ensures everyone calculates metrics like churn rate or customer lifetime value consistently. Real-time alerts add another layer of agility, letting you act immediately when KPIs hit critical thresholds.
When teams are aligned on KPIs, they make decisions five times faster and with greater accuracy [2]. And with global data creation projected to surpass 180 zettabytes by 2025 [12], honing in on the metrics that matter most is becoming increasingly urgent. Querio excels in this space, transforming raw data into real-time, actionable insights. By integrating focused KPIs with AI analytics tools, it equips your team to make quick, informed decisions that align perfectly with your strategic objectives.
FAQs
How do I pick the right KPIs for my business goals?
When selecting KPIs, it’s crucial to focus on your strategic objectives instead of trying to monitor every possible metric. Aim to identify 10 or fewer KPIs that directly align with your most important business goals. These should clearly indicate progress toward specific outcomes that matter.
Avoid getting distracted by vanity metrics - numbers that look good on paper but don’t actually drive meaningful decisions. Instead, prioritize KPIs that provide actionable insights and help maintain accountability within your team or organization.
As your business grows and changes, make it a habit to regularly review your KPIs. This ensures they stay relevant and continue to reflect your evolving priorities.
What’s the best mix of leading and lagging KPIs?
A balanced mix of leading KPIs and lagging KPIs is key to achieving your business goals. Leading KPIs, like customer engagement or sales activity, give insight into potential future outcomes. On the other hand, lagging KPIs, such as revenue or profit, reflect past performance. By aligning these metrics with your objectives, you can ensure that leading KPIs guide proactive decisions while lagging KPIs validate results, creating a cycle of ongoing improvement.
How often should I review and change my KPIs?
Reviewing your KPIs on a regular basis - ideally every quarter - ensures they remain in sync with your business goals and strategies. This practice allows you to adjust to shifting priorities and stay focused on the metrics that truly contribute to your success.
Related Blog Posts


