Business Intelligence
How to build a semantic layer your non-technical team will actually use
Standardize metrics and enable plain-English queries so non-technical teams can access trusted, live data without analysts.
The Problem: Non-technical teams struggle with inconsistent metrics, reliance on analysts, and complex data systems. This slows down decision-making and creates confusion.
The Solution: A semantic layer standardizes metric definitions, simplifies data access, and enables plain-English queries. Tools like Querio connect directly to data warehouses, allowing teams to self-serve insights quickly and accurately.
Key Steps:
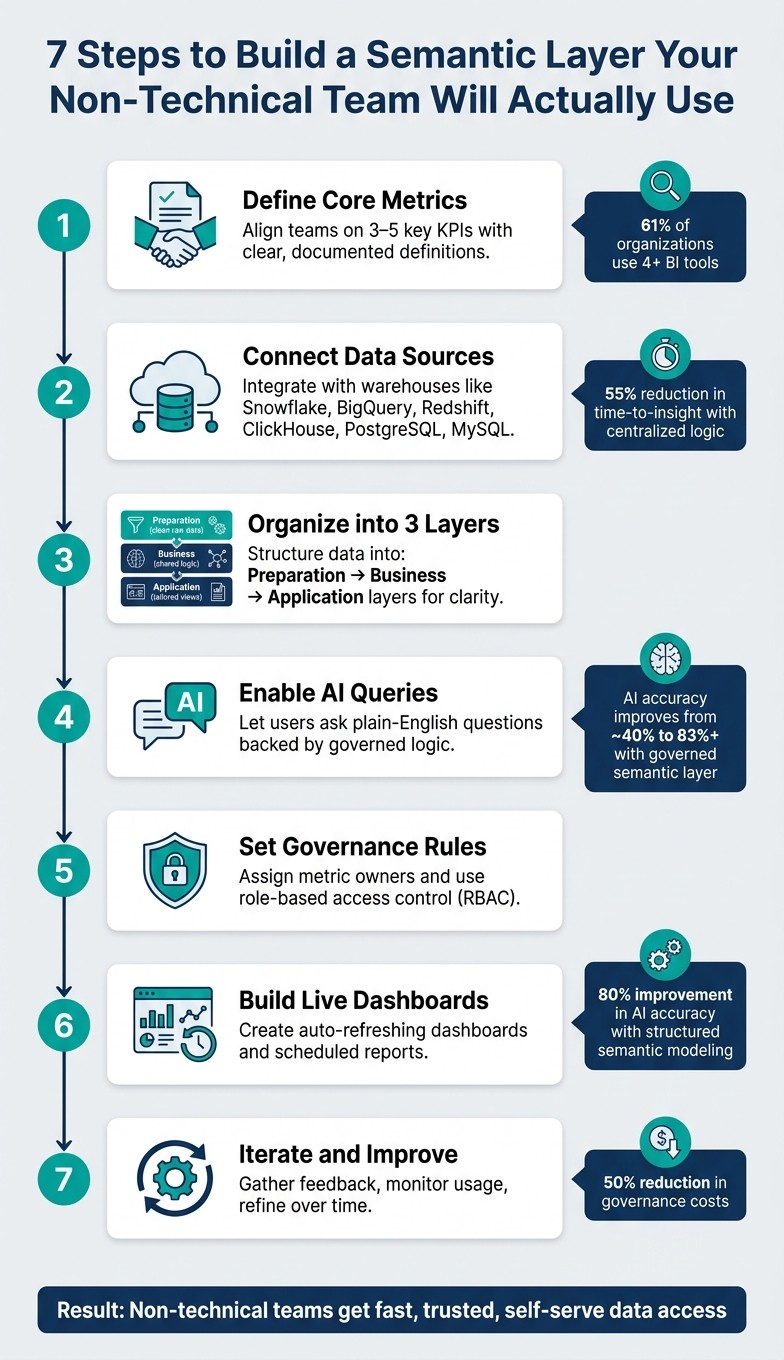
Define Metrics Together: Align teams on 3-5 key KPIs with clear, documented definitions.
Connect Data Sources: Use tools like Querio to map raw data into a centralized model.
Organize for Simplicity: Structure data into three layers - Preparation (clean raw data), Business (shared logic), and Application (tailored views).
Enable AI Queries: Let users ask plain-English questions, backed by governed logic.
Set Governance Rules: Assign metric owners and use role-based access to maintain accuracy.
Build Dashboards: Create live, auto-refreshing dashboards for easy access.
Iterate and Improve: Gather feedback, monitor usage, and refine over time.
Benefits:
Consistent metrics across teams
Faster, self-serve insights
Reduced reliance on analysts
Clear accountability for data accuracy
A semantic layer bridges the gap between raw data and actionable insights, making it easier for everyone - technical or not - to trust and use data effectively.
7 Steps to Build a Semantic Layer for Non-Technical Teams
Closing the AI Readiness Gap, Part 2: The Semantic Layer Imperative
Step 1: Define Your Core Metrics and Business Terms
Creating a semantic layer begins with establishing a shared language. Every team must agree on precise definitions to enable effective self-service analytics. This step is critical - without it, projects often falter. Consider this: over 61% of organizations rely on four or more BI tools, and 25% use 10 or more[5]. Each tool might calculate the same metric differently, leading to inconsistencies.
"The rollout is the hard part. A semantic layer is an organizational change more than a technical one - it forces explicit agreement on metric definitions between finance, product, growth, and leadership." - Dataworkers[1]
Interview Stakeholders Across Teams
Start by talking to key players in teams like Sales, Marketing, Finance, and Product. These conversations will reveal how each group calculates metrics like revenue, churn, or active users. Chances are, you’ll uncover significant differences in their approaches.
Keep it simple at first. Focus on 3 to 5 critical KPIs that shape executive decisions. A short, focused workshop - lasting just a few days - can be enough to achieve alignment before diving into technical implementation[6].
One golden rule: definitions should come from business owners in Finance, Marketing, and Product. The data team’s role is to operationalize these definitions, not create them.
"The data team does not own any metric definitions. The data team owns the infrastructure that makes the definitions operational." - Wesley Nitikromo, Founder, Unwind Data[6]
Once you’ve reached an agreement, document these definitions centrally to ensure consistency across the organization.
Document Metrics in a Shared Context Layer
Use tools like Querio's context layer to store and manage agreed definitions. This centralized approach allows your data team to document joins, metric logic, and business terminology, ensuring consistency across dashboards, queries, and even AI-driven insights.
When documenting metrics, don’t stop at plain language descriptions. Include detailed calculation logic, specific time frames (e.g., a 90-day activity window for "active users"), and how edge cases like discounts, cancellations, or trial periods are handled[4]. The table below shows an example of this process:
Metric | Definition Checklist | Owner |
|---|---|---|
Activated User | Define actions, set time window (e.g., 7 days), document pseudo-code | Head of Product |
MRR | Clarify discounts/taxes, define upgrade/cancellation rules, specify recognition timestamp | Head of Finance |
LTV | Document full formula, define time horizon, specify segment handling | Head of Marketing |
Proper documentation helps prevent "metric drift", where interpretations vary across teams. Querio's context layer ensures these definitions are versioned, reusable, and automatically applied - whether someone is building a dashboard, running a query, or asking a question in plain English.
Step 2: Connect Your Data Sources and Build a Simple Data Model
Now that your metrics are defined and documented, it's time to connect your data. This step is where the semantic layer begins to take form - turning raw warehouse data into actionable insights. Querio integrates directly with modern data sources like Snowflake, BigQuery, Amazon Redshift, ClickHouse, PostgreSQL, and MySQL using encrypted, read-only credentials. Importantly, the data remains in place. By utilizing this live connection, the metrics you documented earlier are reinforced, ensuring your data model stays consistent.
This process brings the stakeholder-approved definitions from Step 1 to life.
"Ambiguity in the English definition becomes ambiguity in the SQL." - Wesley Nitikromo, Founder, Unwind Data [6]
This quote serves as a reminder: clear definitions from the start lead to cleaner, more reliable data models. A messy definition leads to messy SQL - so take the time to get it right.
Start with One Use Case
Once your definitions are in place, your data model should reflect these metrics. Begin by focusing on a single use case, such as tracking monthly revenue by sales rep. This allows you to validate your model with just 3 to 5 key metrics before expanding further [5].
Define Relationships and Joins Once
One common pitfall is duplicating joins across multiple dashboards. This approach creates unnecessary maintenance overhead. Instead, define relationships and joins a single time. A well-structured semantic layer allows you to centralize these definitions, making them reusable across dashboards, plain-English queries, or data notebooks.
In Querio’s context layer, your data team can configure joins, metric logic, and table relationships in one central location. This ensures consistent logic across all tools and reports. For example, U.S. financial firms that implemented this centralized approach saw a 55% reduction in time-to-insight [2]. This consistency not only saves time but also builds trust in self-service analytics by ensuring everyone is working with the same numbers.
Here’s a quick breakdown of the key components involved in connecting your data sources to a semantic layer:
Component | Purpose |
|---|---|
Data Storage | A centralized repository for structured data |
BI Engine | Handles data modeling, visualization, and metrics |
Integration | Links the BI engine to front-end applications |
Security | Manages identity and ensures data segregation |
Step 3: Organize the Semantic Layer for Easy Navigation
Once your data model is structured, the next step is to make it accessible for non-technical users. With your data sources connected and joins defined, how you arrange the semantic layer becomes crucial. This organization allows users to explore data effortlessly and access it directly.
Use a Three-Layer Structure
Divide your semantic layer into three distinct layers, each with a specific role [3].
Layer 1 - Preparation (Raw Data): This layer focuses on cleaning and standardizing raw data from source tables. It’s where cryptic field names like fct_transactions.trans_amt are turned into user-friendly labels such as "Transaction Amount." Null values are managed, data types are standardized, and each source table is mapped into a clean, simplified view. Importantly, no business logic is applied here.
Layer 2 - Business (Logical Model): This layer builds on the clean data from the Preparation layer, introducing shared definitions for metrics like "Net Revenue." These consistent definitions ensure that dashboards, reports, and tools all display the same numbers, fostering trust in the data.
"A semantic layer ensures that terms like 'Quarterly Sales Growth,' 'Customer Lifetime Value,' or 'Active Users' have one undisputed definition. This consistency is the bedrock of any real data-driven culture." - Querio [2]
Layer 3 - Application (Presentation): The final layer is tailored to specific use cases, teams, or tools. For example, a marketing dashboard might combine campaign performance data with customer demographics, while a finance report could show ARR alongside churn metrics. End users access only these curated views, sparing them from dealing with raw tables or complex SQL joins.
Here’s a quick breakdown of the layers and their roles:
Layer | Primary Function | Key Activities |
|---|---|---|
Preparation | Standardize raw source data | Renaming columns, type casting, handling nulls |
Business | Centralize business logic | Defining metrics and establishing join paths |
Application | Tailor data for end users | Creating views for dashboards, AI agents, reports |
The beauty of this structure lies in its flexibility. For instance, if the data team updates a schema or renames a source table, those changes are handled in the Preparation layer. The Business and Application layers remain unaffected, ensuring dashboards and reports continue to work without interruption. This separation makes it easy to implement updates while keeping everything running smoothly for end users.
Step 4: Add Natural Language Queries and AI Assistance
Once your semantic layer is in place, you can take it to the next level by introducing natural language queries. These queries make it easy for non-technical users to pull actionable insights from complex data. With your data sources connected, metrics clearly defined, and layers structured, the focus shifts to ensuring seamless data accessibility. A strong semantic layer is what makes natural language querying accurate and reliable, as it provides the underlying logic needed for precise answers.
Take tools like Querio, for example. They allow users to ask questions in plain English - like, "What was our net revenue by region last quarter?" - and get accurate responses directly from live warehouse data. The key here? Querio operates on top of your semantic layer, meaning it applies your team's shared business definitions. So, when someone asks about net revenue, the answer aligns perfectly with your pre-defined logic, no matter who's asking the question.
Transparency is essential for building trust in AI analytics. Querio ensures this by generating verifiable SQL and Python for every query it answers. This means users can inspect the logic behind any result, ensuring they’re not relying on a mysterious "black box" process. When non-technical users see that answers are based on clear, auditable queries, they’re more likely to trust the insights and act on them.
Feature | Capability | Business Impact |
|---|---|---|
Plain Language Queries | Ask questions in everyday language | Removes the need for SQL or technical skills |
Inspectable Code | Generates verifiable SQL and Python | Builds trust and supports data governance |
Dynamic Dashboards | Identifies relevant data columns | Simplifies and speeds up building visualizations |
Context-Awareness | Applies consistent business terminology | Ensures results are accurate and relevant |
Direct Integration | Connects to live data sources seamlessly | Provides real-time data access and freshness |
Test Usability with Non-Technical Users
Before rolling out these features across your organization, it’s smart to test them with a small group of non-technical users. Choose 5–10 people from teams like marketing, sales, or operations, and ask them to answer three or four real-world business questions using the tool. Pay close attention to where they encounter difficulties, and fine-tune your semantic layer based on their feedback.
If the AI delivers unexpected results during testing, the issue is often not with the AI itself but with the semantic layer. Problems like missing joins, unclear metric names, or undefined business terms in the context layer are common culprits. Querio’s inspectable SQL output makes troubleshooting these issues straightforward. You can see exactly what logic the AI used, identify gaps, and refine your definitions accordingly. This iterative process strengthens your semantic layer, ensuring it becomes a resource your team will trust and rely on daily.
Step 5: Set Up Governance and Metric Ownership
The reliability of your semantic layer hinges on having solid governance in place. Once you've defined your metrics and non-technical users begin accessing data, the real challenge is maintaining accuracy and consistency over time. Without clear ownership and access rules, metrics can drift, definitions may get overwritten, and trust can erode quickly. By implementing structured governance around your semantic layer, organizations can cut governance costs by up to 50% in complex data environments [2]. This approach ensures that as your semantic layer grows, it remains dependable and precise.
Assign Metric Owners
Every major metric in your semantic layer needs a designated owner - ideally someone from the business team that relies on it the most. For example, a revenue metric should be overseen by someone in Finance, while a marketing qualified leads (MQLs) metric would naturally fall under a Marketing manager. These individuals are the subject matter experts who truly understand what each metric represents.
Metric owners play a critical role in maintaining data integrity. They review metric definitions when business processes evolve, flag inconsistencies when results seem off, and approve updates before they're implemented. This creates a clear accountability structure, ensuring there’s always someone responsible for the accuracy and relevance of each metric. Having owners in place also makes it easier to establish customized access controls.
Set Up Role-Based Access Control
Role-based access control (RBAC) limits access based on job responsibilities, which helps protect sensitive data and simplifies the experience for non-technical users. For instance, a customer support representative shouldn't have access to payroll data, and a junior analyst shouldn't be able to alter critical metric definitions. RBAC not only safeguards data but also ensures that users can focus on the information most relevant to their roles, reducing unnecessary complexity.
To make this practical, consider how access might look across the three layers of your semantic layer:
Role | Preparation Layer | Business Layer | Application Layer |
|---|---|---|---|
Data Engineer | ALTER | ALTER | ALTER |
Data Modeler | SELECT | ALTER | ALTER |
Analyst / Data Scientist | None | SELECT | ALTER |
Business Viewer | None | None | SELECT |
Querio supports standard SSO integrations, meaning access control is seamlessly tied to your existing identity provider. When someone joins or leaves a team, their permissions update automatically, eliminating the need for manual adjustments. This ensures teams can work efficiently and securely without unnecessary delays.
Step 6: Make Insights Accessible Through Dashboards and Reports
Once governance and ownership are in place, the next step is ensuring that insights are easily accessible to the people who need them. Clear metric definitions and access controls are great, but they’re not enough if teams can’t view the data without technical help. This is where dashboards, scheduled reports, and embedded analytics tools come into play. These tools act as the bridge between your semantic layer and non-technical teams.
Build Live Dashboards and Scheduled Reports
A semantic layer simplifies things by embedding business logic - for example, filtering out test accounts or focusing on active contracts only. This ensures that dashboards automatically apply the correct filters. No one has to remember to tweak settings manually, and there’s no risk of accidentally including irrelevant data.
With Querio, you can transform any analysis into a live dashboard or a recurring report, both powered by your data warehouse. For instance, a finance team might rely on a monthly revenue dashboard that refreshes automatically each morning, pulling the latest data from platforms like Snowflake or BigQuery. This ensures the numbers remain consistent with the governed definitions used across the organization.
"The biggest risk isn't a wrong number. It's a system where the right number depends on where you ask the question." - Databricks [7]
A well-designed semantic layer eliminates this issue. When dashboards are built on centralized, shared logic, the numbers in an executive report will always align with those in the sales team's weekly updates - no discrepancies, no confusion.
Once your dashboards are set, the next step is bringing analytics directly into the tools your teams already use.
Embed Analytics Into Your Apps and Tools
While live dashboards centralize data, embedding analytics ensures insights are available directly within user workflows. By integrating analytics into internal portals, customer-facing apps, or operational tools, you eliminate the need for users to switch contexts. They get the information they need, exactly where they need it.
Querio makes embedding simple with two options: iframes and a JavaScript SDK. Here’s how they compare:
Factor | iFrames (embedded windows) | Querio JavaScript SDK |
|---|---|---|
Loading Speed | Slower; loads as a separate element | Faster; integrates directly into the app |
Authentication | Complex; may require a separate login flow | Simpler; uses the host app's authentication |
Customization | Limited by frame boundaries | Full control over design and theme |
User Experience | Can feel disconnected or "bolted on" | Seamlessly integrates for a native feel |
For most internal tools, the JavaScript SDK is the better option. It offers a more seamless experience, handles authentication smoothly, and gives you complete control over the look and feel of the analytics. A handy tip: cache API requests to minimize redundant queries to your data warehouse. This keeps things running quickly and helps manage costs [1].
Start by embedding your most critical dashboards - like executive summaries or financial overviews. These high-visibility reports help establish trust in the system and show leadership the value of the semantic layer in action [1].
Step 7: Gather Feedback and Keep Improving
Building a semantic layer isn’t a one-and-done task - it’s an evolving system. Metrics and business logic change over time, and without regular feedback, the system can drift away from what teams actually need.
Regularly Collect Feedback
You need to blend what users say with what the data shows. Stakeholder reviews are a great way to spot misaligned KPIs by asking questions like, “Is this still how we measure success?” Meanwhile, usage monitoring can reveal which metrics are actively being used and which ones are gathering dust. If a metric hasn’t been touched in months, it might either be obsolete or simply not well-known to users.
Another powerful tool is query mining. By analyzing query logs, you can identify recurring filter patterns - essentially uncovering “tribal knowledge.” This refers to business logic that’s understood informally but hasn’t been formally documented in your data model. Capturing and documenting this logic ensures the system is more reliable and accessible to everyone.
Feedback Method | Primary Benefit | Implementation Tip |
|---|---|---|
Stakeholder Reviews | Keeps metrics aligned with goals | Ask: “Are these KPIs still how we measure success?” |
Audit Logs | Detects technical bottlenecks | Monitor query timings and refresh success rates |
Data Champions | Boosts team adoption | Empower champions to lead training within their teams |
Query Mining | Captures undocumented logic | Use AI tools to analyze recurring |
For instance, tools like Querio can track how often metrics are used across dashboards and embedded tools. This ongoing monitoring not only helps refine the system but also strengthens the case for leadership support.
Get Leadership Buy-In Early
Securing executive support is crucial for scaling adoption. When leaders actively use the semantic layer - like showcasing a governed dashboard during a quarterly review - it sends a clear message that this is the organization’s trusted source of truth, not just another tech project.
A well-maintained semantic layer can save analysts from endless one-off data requests, reduce metric inconsistencies across teams, and enable non-technical staff to make decisions more independently. Framing its value in terms of time saved and faster decision-making, rather than just technical jargon, makes it easier to win ongoing support from leadership for maintenance and future upgrades.
Common Pitfalls and How to Avoid Them
Semantic layer projects often run into trouble not because of technical challenges, but due to organizational hurdles. Wesley Nitikromo, Founder of Unwind Data, explains:
"The technical work is rarely what stalls the project. The organizational work is what determines success or failure." [6]
Most setbacks boil down to a handful of recurring mistakes. Recognizing these early can save teams from frustrating rework and delays.
Here’s a breakdown of common pitfalls, their impact, and how Querio’s approach addresses them effectively:
Pitfalls vs. Solutions Table
Pitfall | Impact on Non-Technical Users | Querio-Aligned Solution |
|---|---|---|
Inconsistent metric definitions | Teams report conflicting revenue numbers in meetings, undermining trust in the data. | Define metrics once in Querio's shared context layer. Joins, filters, and business logic are versioned and applied consistently across dashboards, reports, and AI-generated answers. |
Overly complex data models | Users struggle to find what they need, leading them to rely on analysts, which defeats the goal of self-service. | Start small with one use case and expand gradually. Querio's notebook environment allows data teams to build and test logic incrementally before wider publication. |
Unassigned metric ownership leads to disputes | When numbers look wrong, no one knows who to contact for clarification, leaving disputes unresolved. | Assign clear ownership for every metric (e.g., Finance owns revenue). Querio's role-based access controls ensure ownership clarity and block unauthorized changes. |
Lack of documentation | Users don’t understand terms like "Active User" or the data's source, leading to mistrust in the system. [8] | Querio’s AI-powered glossary auto-generates descriptions and labels, making the catalog easy to search and understand. [8] |
Bypassing the semantic layer with raw SQL undermines governance | analysts skip governed definitions for speed, quietly eroding self-service analytics. [1] | Querio ensures governed queries are fast and transparent - every AI-generated answer includes the underlying SQL, so analysts retain control without sacrificing governance. |
AI miscalculations | Without governed logic, AI tools can produce plausible but incorrect numbers, creating more harm than good. | Querio anchors AI agents in governed definitions, boosting answer accuracy from about 40% to over 83%. [6] |
Organizations that prioritize well-structured semantic modeling report an 80% improvement in AI accuracy and a 60% reduction in development and maintenance costs [9]. These numbers highlight the importance of laying a solid foundation.
Conclusion: Giving Non-Technical Teams Direct Access to Data
A strong semantic layer bridges the gap between raw data and the teams who rely on it. Imagine your marketing manager asking, "What was last quarter's customer acquisition cost?" and getting a reliable answer in seconds. That’s the real advantage.
The steps outlined earlier pave the way for a framework that makes self-service analytics possible and practical.
Querio's AI-native, governed approach plays a crucial role in this transformation. It handles the heavy lifting: translating plain English into precise SQL, managing a shared context layer where metrics and joins are defined once and reused everywhere, and ensuring every answer is traceable back to its data source. At the same time, features like role-based access control, row-level security, and versioned logic ensure that analytics remain accurate and compliant.
This goes beyond speeding up reports - it reshapes how decisions are made. Non-technical teams can trust the data because the definitions are consistent, the sources are clear, and the process is governed every step of the way.
FAQs
How do we pick the first 3–5 KPIs to standardize?
Start by identifying the metrics that spark the most debate across teams. Bring together stakeholders from key departments - finance, marketing, sales, and product - to highlight the metrics they find unreliable or inconsistent.
Zero in on metrics that are both heavily relied upon and critical for decision-making, such as revenue or customer lifetime value. Once identified, document everything: clear definitions, calculation methods, and the business rules tied to these metrics. Resolving any disagreements early on is essential to establish alignment and maintain consistency moving forward.
What’s the fastest way to prevent metric drift over time?
To quickly address metric drift, the best approach is to set up a centralized semantic layer that uses consistent definitions and business logic. Here's how you can make it work:
Standardize key metrics: This eliminates the risk of having multiple, conflicting versions of the same metric.
Centralize calculations: Keep all calculations in a single model to maintain uniformity across the board.
Automate updates and validations: This helps you track changes efficiently and ensures everything stays accurate.
By doing this, you’ll keep your data consistent and reduce discrepancies between teams.
How can we make AI answers trustworthy and auditable?
To make AI-generated answers more reliable, it’s essential to establish clear, standardized metrics and well-defined data concepts within your semantic layer. This includes documenting how calculations are performed, assigning ownership for accountability, and setting regular update schedules. These steps help maintain consistency and avoid issues like metric drift over time.
In addition, adopting governance practices is key. Use role-based access controls to manage who can access or modify data, and rely on a single source of truth for all metrics. This approach not only enhances transparency but also ensures data security. By maintaining detailed documentation and versioning data transformations, you can support compliance efforts and strengthen the overall integrity of your AI systems.
Related Blog Posts


