Business Intelligence
The fastest way to get non-technical teams answering their own data questions
Non-technical teams can get instant, accurate answers from live data using plain-English queries and a governed semantic layer.
Non-technical teams often face delays when accessing data insights, with routine requests taking anywhere from 24 hours to weeks. These bottlenecks can lead to costly inefficiencies - such as losing $10,000 daily on ineffective campaigns or wasting 10–20% of marketing budgets on underperforming ads.
Querio solves this problem by enabling teams to query data in plain English and get answers in seconds. It connects directly to your data warehouse, translates natural language into SQL or Python, and ensures consistent definitions across teams. This eliminates reliance on technical teams, speeds up decision-making, and reduces errors.
Key Features:
Instant insights: Answers in under 5 seconds, even for large datasets.
Plain English queries: No coding required; 95% query accuracy on the first attempt.
Data security: Role-based access, SOC 2 compliance, and GDPR/HIPAA support.
Standardized metrics: Shared definitions ensure consistent, error-free reporting.
Scalable dashboards: Live updates and automated reports simplify workflows.
Querio’s setup is quick - connect your data warehouse, define business logic, and train teams to query effectively. By cutting delays and empowering users, it transforms how businesses access and use data.
Back to Basics: Generative BI Pattern for Self-Service Analytics
How Querio Delivers Self-Service Analytics
Querio breaks down the technical walls that often leave non-technical teams waiting for data insights. Instead of grappling with SQL or submitting endless tickets, users can simply type their questions and receive results in seconds. By turning natural language into precise queries, Querio ensures that everyone works with consistent definitions. Let’s dive into how it transforms everyday questions into actionable insights.
Ask Questions in Plain English
Querio’s AI takes plain English questions and translates them into accurate SQL or Python code, running directly against your live data warehouse. For example, type something like, “What were our top-selling products in Q1 2025 in the US?” and the AI delivers 95% query accuracy on the first attempt, cutting out the errors that often come with manual coding [8].
It doesn’t stop at simple queries - Querio handles more complex requests, such as analyzing revenue trends or comparing channel performance. Results are paired with instant visualizations and calculations, making data easier to interpret.
Connect Directly to Your Data Warehouse
Once a query is processed, Querio ensures fast and secure access to live data. The platform integrates with major data warehouses using read-only connections, so there’s no need to export data or set up ETL pipelines. Results come back in under five seconds, even for datasets with over a million rows [8]. For instance, a sales rep asking, “What’s our current pipeline value?” gets real-time numbers - not outdated snapshots.
Security is baked in. Querio enforces role-based access control (RBAC) that mirrors your data warehouse’s permissions. This means a sales rep sees only their region’s data, thanks to row-level security policies. Plus, all queries are logged with user attribution, and the AI pre-validates queries to avoid inefficiencies. The platform meets SOC 2 Type II compliance standards, supports GDPR and HIPAA requirements, and guarantees a 99.9% uptime SLA [7].
Maintain Consistent Definitions Across Teams
Querio doesn’t just make querying easy - it ensures everyone works with the same data definitions. Its shared context layer allows data teams to define business logic once and apply it universally. For instance, you can set rules like “Revenue = bookings - refunds” or “Active Users = logins in last 30 days.” These standardized definitions ensure consistency across teams. So, when someone asks, “Show revenue by active users in Q2,” the platform generates uniform SQL joins, avoiding mismatches - like finance using net revenue while marketing uses gross [1][2].
This shared context layer has real-world impact: forecast accuracy improves from 72% to 92%, planning cycles shrink from two weeks to just one day, and customer lifetime value alignment increases by 15% year-over-year [8].
Getting Started with Querio: A Step-by-Step Guide
3-Step Setup Process for Querio Self-Service Analytics Platform
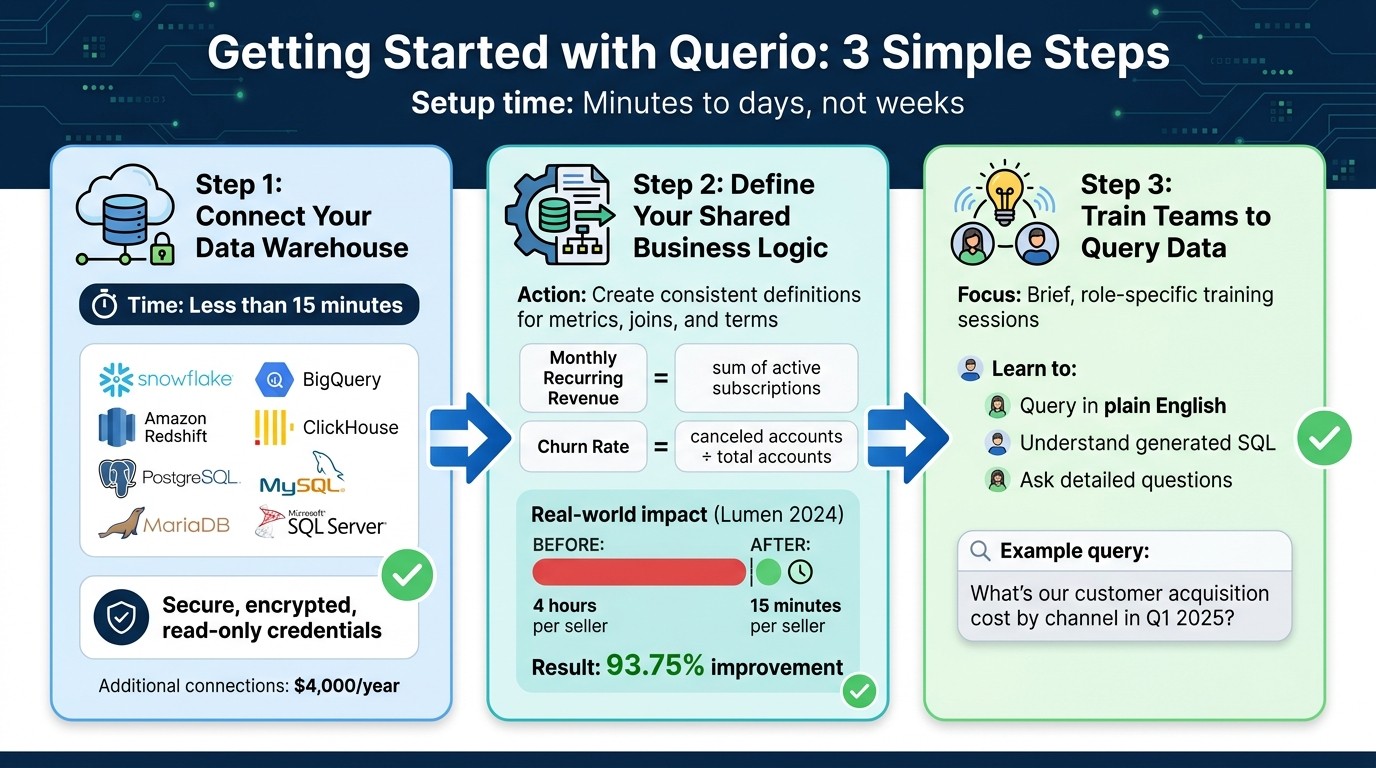
Setting up Querio is designed to be quick and straightforward - taking just minutes to days, not weeks. With its streamlined analytics, the process simplifies everything from connecting your data to training your team. The setup revolves around three main steps: linking your data warehouse, defining shared business logic, and teaching your team how to query effectively. Each step is crafted to reduce technical complexity while ensuring accuracy and usability.
Step 1: Connect Your Data Warehouse
The first step is to connect Querio to your data warehouse using secure, encrypted, read-only credentials. Querio supports a range of platforms, including Snowflake, BigQuery, Amazon Redshift, ClickHouse, PostgreSQL, MySQL, MariaDB, and Microsoft SQL Server. Simply head to the connection settings, choose your warehouse type, and input the read-only connection details. Querio will validate the connection and align with your existing warehouse permissions to ensure secure and appropriate access to data. This process usually takes less than 15 minutes, making it quick and efficient. If you need additional database connections, they’re available for $4,000 per year [9].
Step 2: Define Your Shared Business Logic
After connecting your data, the next step is to establish shared business logic. This involves your data team creating consistent definitions for metrics, joins, and terms within Querio's semantic layer. For example, you might define "Monthly Recurring Revenue" as the sum of active subscriptions or "Churn Rate" as canceled accounts divided by total accounts. These standardized definitions ensure that all queries, dashboards, and reports rely on the same rules.
A great example of this in action is Lumen's 2024 implementation. By standardizing revenue and pipeline metrics, they reduced their sales summary process from 4 hours per seller to just 15 minutes - a 93.75% improvement [9]. This step eliminates confusion, like finance and marketing teams using conflicting revenue definitions, and sets the stage for seamless collaboration.
Step 3: Train Teams to Query Data in Plain English
The final step is training your team to use Querio effectively. These sessions are brief and tailored to specific roles, helping non-technical users learn how to query in plain English and understand the SQL that Querio generates. For instance, instead of vague questions like "Show me costs", users are encouraged to ask detailed ones, such as, "What’s our customer acquisition cost by channel in Q1 2025?" This ensures clarity and improves results.
Additionally, you can encourage users to review the generated SQL to see how Querio interprets their questions. Keep an eye on usage metrics to track adoption and adjust training as needed for better results.
Expanding Usage with Dashboards, Reports, and Embedded Analytics
Once your team is comfortable querying in plain English, it's time to take things further. Querio isn't just about answering one-off questions - it can become a full-fledged analytics powerhouse. By creating live dashboards, automating routine reports, and embedding analytics into customer-facing tools, you streamline workflows and deliver actionable insights to both your team and your customers.
Build Live Dashboards and Automated Reports
Setting up dashboards is quick and straightforward. You can use metrics from your shared business logic library - like monthly recurring revenue or customer churn rate - and simply drag and drop visualizations onto the dashboard canvas. Dashboards can refresh live, either every five minutes or in real time through webhooks, ensuring they always reflect the most up-to-date data from your warehouse. For example, a sales team could create a "top 10 products by US revenue" dashboard that auto-refreshes during quarterly meetings, giving everyone access to the latest numbers without relying on IT [7].
Automating reports is just as simple. After designing a query or dashboard, head to the "Schedule" tab to set how often the report should run - daily, weekly, or monthly. You can also customize the format, with options like PDFs or CSVs that use US-style number formatting (e.g., 1,234.56 for $1,234.56) and date formatting (MM/DD/YYYY). Reports can be delivered via email, Slack, or SFTP, all based on live data, and no coding is required. For instance, a marketing team might schedule a Friday 5:00 PM ET report on "Q2 leads from California", sending it to 50 stakeholders and cutting manual export time by 80% [8]. According to Gartner, self-service reporting improves efficiency in non-technical teams by 40% [8].
Embed Analytics in Customer-Facing Applications
Querio also allows you to embed analytics directly into external applications while keeping your data secure. Using iframe or JavaScript, you can generate an embed code, customize it (e.g., filter by user ID), and integrate it into platforms like Salesforce or custom-built React apps. With row-level security, you can control who sees what. For example, a SaaS company might embed a "your subscription analytics" dashboard into client portals, showing metrics like revenue in dollars and dates in MM/DD/YYYY format. This kind of self-serve access has been shown to boost customer retention by 25% [8].
Security is a top priority. Querio uses JWT-based authentication, row-level security to mask sensitive data (meeting CCPA standards), audit logs to track views, and domain whitelisting to block unauthorized access. Since data never leaves your warehouse - queries are proxied through Querio - it aligns with HIPAA and GDPR requirements for US businesses [10]. If your embedding needs grow, you can add extra database connections for $4,000 per year [9].
Driving Adoption and Measuring Success
Adoption is where the real value lies. Without tracking progress and gathering feedback, it's tough to tell if your investment is hitting the mark - or where changes might be needed.
Monitor Key Usage Metrics
Start by keeping an eye on daily active users (DAU). A good benchmark is achieving 30–50% adoption within the first few months [2]. Another strong indicator? Aim for 20–30% growth in queries month-over-month during the first quarter. Pay close attention to how many questions non-technical users can answer on their own - target at least 70% of queries being handled independently by month six [6].
Other metrics to monitor include response time and accuracy. For a seamless experience, keep average response times under 5 seconds and maintain query success rates of 95% or higher to build user confidence [4][11]. Additionally, track reductions in routine support tickets. For instance, if your data team previously handled 50 routine requests weekly, cutting that by 60% could save around $140,000 annually [2].
By focusing on these metrics, Querio ensures non-technical users can access insights quickly and efficiently. Use these numbers to guide updates and improvements.
Refine Your Setup Based on User Feedback
Usage data is just the beginning - user feedback is essential for making meaningful adjustments. Incorporate in-app surveys after each query, asking simple questions like "Was this helpful?" with thumbs up or down options. For deeper insights, hold quarterly focus groups with a mix of users to uncover any recurring issues. For example, if one team uses "CAC" while another says "customer acquisition cost", adding synonyms to your shared business logic can eliminate confusion.
When prioritizing fixes, focus on the changes that will have the biggest impact. If multiple teams report problems with specific queries, update those definitions regularly. One fintech company, for instance, improved its "CAC" calculations based on feedback from its finance team, reducing escalations by 40% and standardizing monetary outputs to a consistent format (e.g., $250) [3].
Use A/B testing to measure the effectiveness of these refinements. Adjust definitions, track improvements in query success rates, and iterate from there. Gartner highlights that 65% of BI adoption failures stem from ignored feedback, while successful implementations can lead to decision-making that's up to three times faster [5]. Review top user issues every two weeks, make necessary adjustments, and communicate updates to users. This not only builds trust but also keeps engagement high, reinforcing Querio's goal of enabling faster, independent decisions driven by data.
Conclusion
Non-technical teams can now tap into accurate, consistent data insights without waiting on bottlenecks. Querio makes this possible by offering governed self-service analytics. It combines natural language querying with centralized business logic, delivering instant, reliable insights while removing delays that often slow decision-making.
The impact is clear. Organizations that adopt self-service analytics experience 23% faster decision-making cycles compared to traditional BI methods [4]. Even better, companies with well-established programs report a 40% reduction in time spent on routine data requests [12]. Querio stands out with its rapid setup - get started in under 2 hours. Simply connect your data warehouse, define unified business logic, and let your teams start querying immediately. This quick deployment lays the groundwork for scalable, consistent analytics across your entire organization.
For self-service analytics to work effectively, consistency is key. Misaligned definitions and shadow analytics can undermine trust in results. Querio’s semantic layer ensures consistent definitions across teams, so terms like "revenue" always mean the same thing, whether used by sales or finance. Plus, results are formatted correctly - like $1,234.56 for U.S. operations - guaranteeing accuracy and trust in every query.
FAQs
How do we prevent different teams from using different metric definitions?
To keep everyone on the same page when it comes to data, set up a centralized semantic layer in your AI-driven business intelligence platform (like Querio). This layer acts as a single source of truth, ensuring that key terms and metrics are standardized so everyone interprets data the same way.
Here’s how to make it work:
Use role-based permissions: Control who can access and modify specific data to maintain security and accuracy.
Implement data governance: Establish rules and processes to protect the integrity of your data.
Regularly update definitions: Keep key terms and metrics current, and make sure updates are clearly communicated across teams.
Leverage AI tools: Use AI features to automatically enforce consistency in how data is analyzed and interpreted.
By combining these practices, you ensure that every team works from the same, reliable set of data definitions.
What permissions and sensitive-data controls are available for non-technical users?
Querio makes it easy for non-technical users to access data securely. It offers features like role-based permissions, row-level security, data masking, and audit logs. These tools ensure sensitive information stays protected while granting the right level of access for users to gather insights.
What’s the quickest way to train teams to ask better questions in plain English?
The quickest way to help teams ask better questions in plain English is by leveraging AI-powered tools that can translate everyday language into precise data queries. Begin by guiding teams to craft clear and specific questions, ensuring they define key terms and steer clear of vague language. Incorporating real-world examples and using structured templates for practice can boost their confidence. Over time, this method encourages independent data exploration while easing the demand on technical teams.
Related Blog Posts


