How to Build a Data Model That Drives Decisions
Learn how to build a data model from scratch with our practical guide. We cover everything from business requirements to schema design and performance tuning.
https://www.youtube.com/watch?v=YtqmBGALUzw
published
Outrank AI
how to build a data model, data modeling guide, star schema design, analytics engineering, ETL process
d84011e0-7aee-4f0a-842a-e25ed8e7c912

Building a data model isn't just a technical exercise; it's how you create a structured, understandable map of your business data. It involves digging into business requirements, picking the right schema, and then carefully constructing your fact and dimension tables. Think of it as the blueprint that transforms messy, raw data into a powerhouse for analytics.
Why a Great Data Model Is Your Analytics Bedrock
Before you even think about writing a single SQL query or firing up a dashboard, you have to get the data model right. A solid model is the true foundation of any successful analytics program. It’s not some abstract diagram for the IT department; it’s the strategic blueprint that determines the speed, accuracy, and—most importantly—the trustworthiness of every insight your organization relies on.

Without a well-designed model, you're setting yourself up for an analytical house of cards. Queries will crawl, metrics will be inconsistent from one department to the next, and stakeholders will quickly lose faith in the numbers. A great data model is your defense against this chaos, creating a single source of truth everyone can stand behind.
From Technical Task to Business Strategy
Data modeling has moved out of the backroom and into the boardroom. It's now a core business activity that translates the complex reality of your operations into a clear, queryable structure that makes sense. This isn't just a trend; it's a fundamental shift. A recent DATAVERSITY survey found that 64% of organizations are now actively using data modeling, a telling sign of its rising importance. You can dig deeper into data modeling trends and how they solve real-world business problems.
This strategic investment pays off in very practical ways:
Faster, More Efficient Queries: A well-structured model, like a star schema, dramatically simplifies your SQL. This means dashboards load in seconds, not agonizing minutes.
Consistent, Trustworthy Metrics: It locks in a single, universal definition for crucial metrics. "Monthly recurring revenue" gets calculated the same way, every time, ending the debates.
Empowered Self-Service Analytics: A clear model is what allows tools like Querio to work their magic. It gives the AI context to understand data relationships, so non-technical users can ask complex questions in plain English and get answers they can trust.
A data model is the ultimate translator between your business operations and your analytics. It takes the messy reality of how your business runs and organizes it into a clean, logical framework that a computer—and your team—can easily understand.
To kick things off, let's get grounded in the core vocabulary. Understanding these terms is the first step in building a model that works.
Core Data Modeling Concepts Explained
Concept | What It Really Is | Why It's Critical for Your Model |
|---|---|---|
Fact Table | The table holding your numbers—the events and transactions you want to measure. Think sales amounts, clicks, or support tickets logged. | This is the heart of your model. It contains the key metrics your business runs on. |
Dimension Table | Your "who, what, where, when" tables. They provide context to the numbers in the fact table. Examples: Customers, Products, Dates. | Dimensions are how you slice and dice your data. Without them, your facts are just meaningless numbers. |
Schema | The blueprint showing how your fact and dimension tables are connected. Common patterns include star, snowflake, and normalized. | The schema you choose directly impacts query performance, ease of use, and how easily the model can be updated. |
Grain | The level of detail in a fact table. A sales fact table could have a grain of "one row per order line item." | Defining the grain prevents double-counting and ensures every metric is calculated accurately. It's the most important decision you'll make. |
Getting these concepts right from the start is non-negotiable.
Ultimately, investing the time to build a robust data model is really about building confidence. It gives your leadership the assurance to make high-stakes decisions based on data they know is accurate, consistent, and a true reflection of the business. It’s what separates guessing from knowing.
Translate Business Needs into a Technical Blueprint
This is where data projects either fly or fail. You can have the best technical skills in the world, but if you build a model that solves the wrong problem, you've wasted everyone's time. A great technical blueprint is always built on fundamental system design principles for things like scale and reliability, but it starts with talking to people.
The goal here is to get past the surface-level requests. You have to move beyond just asking, "What data do you want?" and start digging into the core business questions that stakeholders are trying to answer.
I’ve seen too many projects build a technically perfect model that nobody uses because it didn't address the real-world challenges. To avoid that trap, you need to put on your detective hat. A vague ask like "we need a better sales dashboard" isn't a requirement—it's a starting point. Your job is to find out what's really driving that request.
Leading Effective Discovery Sessions
The trick is to lead discovery sessions that pull out the "why" behind every "what." Business users are often stuck thinking in terms of the reports and spreadsheets they already have. You need to gently guide the conversation away from describing an old output and toward articulating the tough decisions they're struggling with today.
One of the most effective tools for this is the "5 Whys" method. Seriously, it works. When a marketing manager asks for a report on campaign ROI, don't just nod and start coding. Push back, politely.
Why do you need to see campaign ROI? "To figure out which campaigns are actually working."
Why is that important? "So I can stop wasting money and allocate my budget more effectively."
Why do you need to do that right now? "Because our customer acquisition cost is way too high."
Why is that a problem? "It's crushing our profit margins on new sales."
Why is that the focus? "We have a company-wide initiative to boost profitability by 10% this quarter."
Boom. Just like that, a generic request for an ROI report becomes a mission-critical business objective. Now you know the real goal: build a data model that helps slash customer acquisition costs and drive profitability. This kind of clarity is priceless.
Reverse-Engineer Existing Workflows
Another place to find hidden gold is in all those "shadow IT" spreadsheets people have stashed on their hard drives. Don't look down on them—they're a treasure map. That complicated Excel file the finance team uses for monthly close is packed with hidden business logic, manual overrides, and critical calculations your model absolutely has to get right.
By deconstructing these manual processes, you're not just finding data sources; you're uncovering the unwritten rules of the business. This ensures your new, automated model will be trusted because it reflects the reality of how people already work.
From Vague Requests to Concrete Specs
Once you've gathered all this context, you can finally start translating it into a technical plan. That business need to "increase profitability by reducing acquisition costs" now breaks down into a clear set of requirements for your logical model.
Metrics (Facts): You know you'll need things like
total_spend_by_campaign,new_customers_acquired,customer_acquisition_cost, and maybefirst_purchase_profit_margin.Context (Dimensions): The team will want to slice these numbers by
campaign_channel(like Google Ads vs. Facebook),customer_demographics(age, location), andtime(daily, weekly, monthly).Detail (Grain): You can now define the level of detail needed. For instance, the grain for your customer acquisition fact table might be one row per acquired customer per campaign.
This process of translating conversational business needs into specific facts, dimensions, and grains is the single most important step in the entire process. It’s what separates a data model that just produces reports from one that becomes an analytical engine for driving real business outcomes.
Choosing the Right Schema for Your Use Case
With your business requirements translated into a technical blueprint, it’s time to get into the architecture of the model itself. Honestly, this is one of the most important decisions you'll make. The schema you choose directly impacts everything that comes later: query performance, how easy the model is to maintain, and whether your business users can actually make sense of it.

When it comes to analytics, you’ll hear two terms thrown around constantly: the star schema and the snowflake schema. Forget the dry textbook definitions for a minute. Let’s walk through them with a real-world e-commerce example where we need to analyze sales, products, and customers.
The Star Schema: Your BI Tool’s Best Friend
There's a good reason the star schema is the workhorse of modern analytics—it’s built for speed and simplicity. At its heart is a central fact table holding all your numbers (like sales_amount and quantity_sold). This table connects directly to several dimension tables that provide all the context—the who, what, where, and when (like Dim_Customer, Dim_Product, and Dim_Date).
Think of our e-commerce fact table, Fact_Sales. Each row is a single line item from an order. It's tied directly to dimensions that describe that sale. The Dim_Product table, for example, would have everything about a product in one place: product_name, category, brand, and so on.
This "denormalized" structure is a godsend for BI tools like Querio. When an analyst wants to see sales by brand, the query only has to join Fact_Sales directly to Dim_Product. It’s simple, lightning-fast, and efficient because you're minimizing the number of joins.
The core idea behind the star schema is simple: trade a bit of data redundancy for a massive boost in query performance. For 90% of analytics use cases, this is absolutely the right call.
The Snowflake Schema: When Storage and Integrity Are Paramount
Now, let's look at the snowflake schema. It takes the dimensions from a star schema and normalizes them by breaking them into even more tables. The structure starts to look like a snowflake, with smaller tables branching off the main dimensions.
In our e-commerce example, a snowflake design wouldn't just stuff category and brand into the Dim_Product table. Instead, Dim_Product would link out to a separate Dim_Category table and a Dim_Brand table.
The big win here is eliminating data redundancy. The brand name "SuperWidget" is stored just once in Dim_Brand, not repeated for every single SuperWidget product. This saves storage and makes updates a breeze—change the brand name in one spot, and you're done.
But this efficiency has a price. To get sales by brand, a query now has to join Fact_Sales to Dim_Product, and then join Dim_Product to Dim_Brand. Those extra joins can introduce latency, especially with huge datasets. Grasping these differences is a critical part of picking the right data warehouse model for the job.
Schema Showdown: Star vs Snowflake
Choosing between these two models is a classic engineering trade-off. Are you optimizing for query speed or for storage efficiency and data integrity? This table breaks it down.
Attribute | Star Schema (Optimized for Speed) | Snowflake Schema (Optimized for Storage) |
|---|---|---|
Query Performance | Excellent. Fewer joins mean faster queries, which is a must-have for interactive dashboards and self-serve BI. | Good, but slower. The additional joins can create latency that your end-users will definitely notice. |
Data Redundancy | Higher. Attributes like | Minimal. Normalization cuts down on redundancy, saving storage and making data updates much cleaner. |
Maintenance | Simpler. The structure is clean and direct, with fewer tables and joins to worry about in your ETL/ELT logic. | More Complex. You have to manage more tables and relationships, which can easily complicate your data pipelines. |
Best For | The vast majority of BI and analytics workloads where user query performance is the absolute top priority. | Niche cases with gigantic, complex dimensions or where storage costs are a primary driver of your decisions. |
As you design your model, don't forget that handling complex scenarios often means mastering many-to-many relationships, which can be crucial for analytical flexibility regardless of the schema you choose.
My advice? For almost any modern data warehouse project, the star schema should be your default. Storage is cheaper than ever, making the huge performance gains from a star schema far more valuable than the storage savings you’d get from a snowflake.
Start with a star. Only consider "snowflaking" a dimension if you have a very specific and compelling reason—like a customer dimension with tens of millions of rows where normalization genuinely offers a tangible benefit.
Building Out Your Facts and Dimensions
Okay, you've settled on a schema. Now it's time to roll up your sleeves and start building the real heart of your model: the fact and dimension tables. This isn't just theory anymore; these are the actual tables you’ll create in your warehouse, the ones that will bring your design to life.
The concept is beautifully simple. Fact tables are where you keep your numbers—the quantifiable metrics that track business events. Think sales_amount, quantity_ordered, or page_views. These tables tend to be incredibly long and relatively narrow, with a row for every single event you care about.
On the other hand, dimension tables provide all the rich context. They answer the "who, what, where, and when" behind the numbers in your fact table. They hold descriptive details like customer_name, product_category, or store_location. Dimensions are typically much wider and shorter than facts, packed with the attributes your users will use to slice and dice the data.
Nail Down the Grain (Or Nothing Else Matters)
Before you write a single line of SQL, you have to make what is arguably the most critical decision in the entire process: defining the grain. The grain is the declaration of what one single row in your fact table represents. It is the fundamental unit of your model.
Get this wrong, and you're in for a world of pain. Double-counting revenue, missing key insights, and an endless stream of user complaints are just the beginning. You have to be ruthlessly specific here. "One row per sale" is far too vague. A much better grain would be "one row per line item on a customer's order." See the difference?
A clearly defined grain is your model's contract with its users. It guarantees that every query will produce accurate, consistent results because everyone understands precisely what each row signifies. If you get this wrong, nothing else matters.
Here are a few examples of grains defined with the right level of precision:
Retail Sales: One row per product, per customer, per transaction.
Web Analytics: One row per event during a user's session.
Subscription Business: One row per subscription, per month.
My advice? Always choose the most atomic (lowest-level) grain you can. You can always roll up detailed data into a summary—like aggregating daily sales into a monthly view. But you can never break down an aggregated number to a level of detail you didn't capture from the start.
The Unsung Hero: Surrogate Keys
With your tables defined, you need a rock-solid way to connect them. It’s tempting to just use the natural keys from your source systems—like an order_id from your transactional database—but this is a classic rookie mistake. The professional standard is to generate surrogate keys.
A surrogate key is just a simple, unique integer that you create to be the primary key for each dimension table. It has no business meaning whatsoever; its only purpose is to join your facts and dimensions cleanly and efficiently.
Using them pays off in huge ways:
Decoupling: They insulate your data warehouse from the chaos of source systems. If someone changes the format of a natural key upstream, your warehouse doesn't break.
Performance: Joining on simple integers is dramatically faster than joining on long, clunky strings or composite keys. Your queries will thank you.
Historical Tracking: They are the secret sauce for managing historical changes in your data, which we'll get into next.
Handling Slowly Changing Dimensions
Let's face it, business is messy. A customer moves, a product gets recategorized, a sales territory is redrawn. A Slowly Changing Dimension (SCD) is the technique we use to manage and track these historical changes in our dimension tables.
If you just overwrite old values, your historical reporting becomes a lie. For example, if you simply update a customer's address from New York to California, you erase the crucial fact that all their past purchases happened when they lived in New York.
The most common and powerful approach here is SCD Type 2. With this method, you preserve the full history by creating a new row for an entity whenever a key attribute changes. We typically add columns like start_date, end_date, and an is_current flag to make this work. This allows an analyst to perfectly reconstruct what the business looked like at any point in time. Mastering these techniques is fundamental to building a truly robust model, and you can dive deeper into more advanced strategies in our guide to data modeling best practices.
Bringing Your Model to Life with a Data Pipeline
A well-designed data model is a brilliant blueprint, but it's just a theoretical exercise until you build the machinery to populate it with real data. This is where your data pipeline comes in—it’s the engine that turns your logical design into a physical, queryable asset. This step is all about bridging the gap between theory and execution.
The first big decision you'll face is choosing between two main approaches: ETL (Extract, Transform, Load) and ELT (Extract, Load, Transform). With traditional ETL, data gets extracted from source systems, transformed in a separate processing engine, and then loaded into the data warehouse in its final, clean state. It's a very structured, upfront process.
The more modern ELT approach flips this on its head. You extract raw data and load it directly into your data warehouse first. All the transformation work—cleaning, joining, and shaping data into your fact and dimension tables—happens right inside the warehouse, taking advantage of its massive processing power. For a deeper dive into these methods, check out our guide on the modern analytics stack.
Writing Your Transformation Logic
For most modern data stacks, ELT is the way to go. It lets you tap into the raw power of cloud data warehouses like Snowflake, BigQuery, or Redshift. In this world, your transformation logic will be written almost entirely in SQL, making it the language you use to physically build your data model.
This is where you'll write the queries that actually populate your dimensions and fact tables. For instance, building your Dim_Customer table might involve a SQL script that selects distinct customer records from a raw source table, generates a surrogate key, and cleans up inconsistent address information.
Tools like dbt (Data Build Tool) have basically become the industry standard for managing all this SQL-based transformation logic. Instead of dealing with a messy folder of disconnected .sql files, dbt lets you:
Define dependencies: You can explicitly tell dbt that your
Fact_Salestable should only run afterDim_CustomerandDim_Producthave been successfully updated. No more race conditions.Write modular code: You can create reusable SQL macros to handle common jobs like generating surrogate keys, which keeps your code clean and DRY (Don't Repeat Yourself).
Automate testing: You can write data quality tests directly into your project to ensure primary keys are always unique and foreign keys are never null.
A data pipeline isn't just about shuffling data around; it's about turning your business logic into code. Using a tool like dbt transforms your scripts into a reliable, testable, and maintainable codebase that breathes life into your data model.
Tuning for Performance and Scale
Building the pipeline is only half the battle. Making sure it runs efficiently is just as important, especially as data volumes grow. When you're dealing with massive datasets, performance tuning isn't a "nice-to-have"—it's a necessity. Two techniques are absolutely essential for any serious analytics model.
This flow chart gives you a high-level view of how the pieces fit together, starting with the grain.
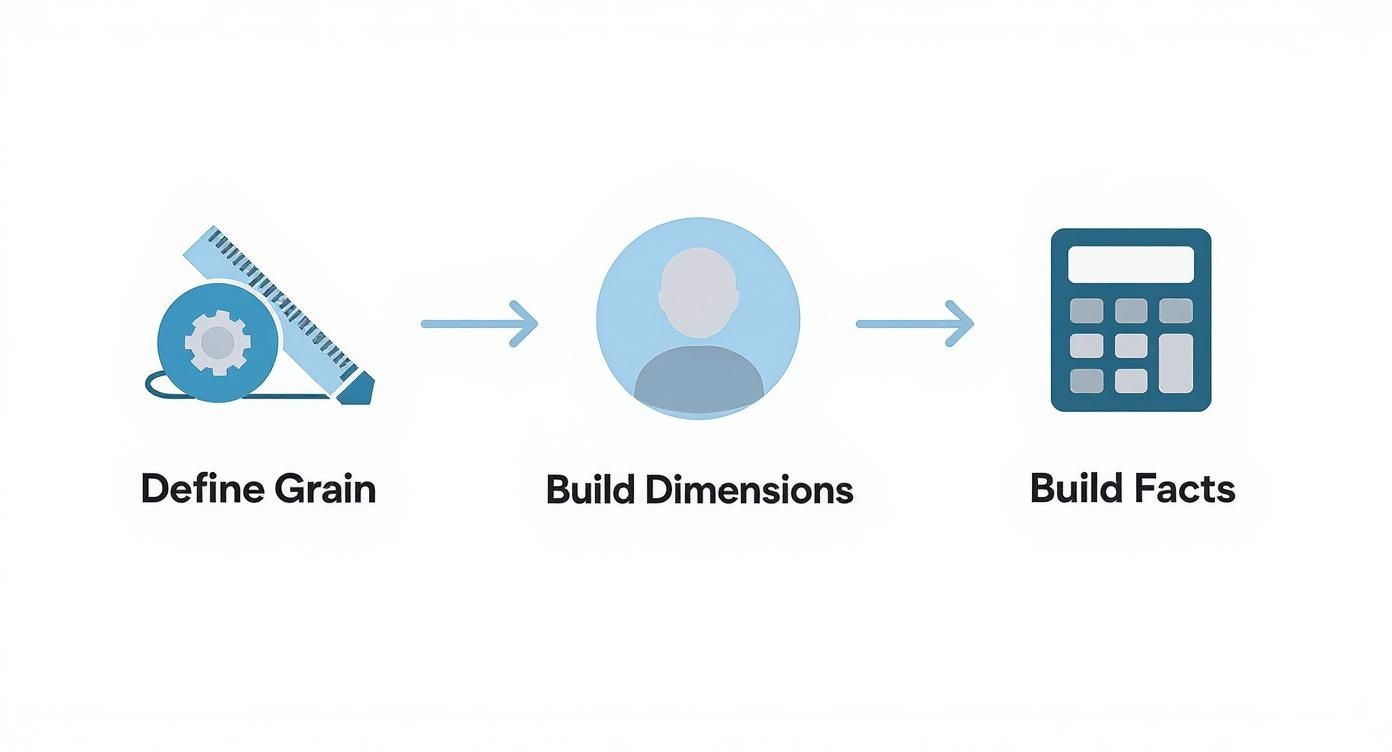
As you can see, defining a clear grain is the foundation. It ensures that the dimensions and facts you build on top of it create a logical and accurate structure.
First up, partitioning is your best friend for enormous fact tables. By partitioning a multi-billion row sales table by a date column (like order_date), you’re physically organizing the data on disk. When a user queries for sales in the last month, the database engine can completely ignore years of irrelevant data, scanning only the handful of partitions it actually needs. This can slash query times from minutes to seconds.
Second, thoughtful indexing (or using clustering keys in warehouses like Snowflake) is critical. Your dimension tables are smaller, but they get joined constantly. Creating an index on the surrogate keys in your dimension tables and the corresponding foreign keys in your fact table makes those joins lightning-fast. This simple step is what makes the connections between your tables work smoothly, which is essential for responsive dashboards in BI tools like Querio.
Ultimately, your goal is a pipeline that is not only correct but also scalable and easy to maintain.
Building Trust with Documentation and Governance
A technically perfect data model is worthless if nobody trusts it. We've reached the final, and frankly, most critical part of this process: establishing the practices that make your model reliable, understandable, and secure. Your job isn't done when the model goes live; the real value comes from maintaining its integrity for the long haul.
If you don't have clear documentation, your model becomes a black box that only you can decipher. I've seen it happen time and again—this quickly leads to misuse, mistrust, and eventually, the model being abandoned altogether. Good documentation is what turns your work into a true company asset, empowering people to self-serve with confidence.
Creating a Culture of Clarity
Your main goal here is to make the data model as intuitive as possible, not just for other data folks but for business users, too. To get there, a couple of documents are absolutely non-negotiable.
First up is the data dictionary. This is your user-friendly guide, defining every table and column in plain English. For a column like fct_sales.gross_revenue_usd, the dictionary should cut through the jargon: "The total sale amount in US dollars before any discounts, returns, or taxes are applied." This simple step demystifies everything.
Second, you need an Entity Relationship Diagram (ERD). Think of it as a visual map showing how all your tables connect. An ERD lets a new analyst see instantly that the fct_sales table joins to dim_customer on customer_key. That’s a whole lot faster and more effective than trying to explain the relationships verbally.
Good documentation isn't a "nice-to-have" for a data model. It's the foundation of user adoption. If people can't easily understand what the data means and how it's connected, they simply won't use it.
Automating Data Quality and Integrity
Trust is incredibly fragile. All it takes is one dashboard showing the wrong numbers to permanently tarnish your model's reputation. This is exactly why proactive data quality testing is a must-have, not an afterthought. You have to get ahead of problems instead of waiting for users to find them.
The good news is these tests don't need to be overly complicated. Start with the basics:
Uniqueness Tests: Is every primary key in your dimension tables actually unique?
Not-Null Tests: Are there any null foreign keys in your fact table? This would create "orphaned" records.
Referential Integrity: Does every foreign key in a fact table actually match a primary key in a dimension table?
Modern tools like dbt make it incredibly easy to bake these tests right into your project. When a test fails, it can stop the pipeline in its tracks, preventing bad data from ever reaching your users.
Implementing Essential Data Governance
Finally, governance is what ensures your data is not only accurate but also secure and properly managed. A huge piece of this puzzle is controlling who can see what. For example, a sales rep in the US should only see data for their region, not the entire company's global sales.
This is where row-level security (RLS) comes into play. RLS is a database feature that lets you build security policies to filter data for specific users or roles. You can create rules like user_region = sales_region, and the database automatically enforces them on every single query. It’s a powerful way to deliver secure, tailored data access at scale.
Putting these practices in place is a core part of any strong data strategy. To dig deeper into this, check out our complete guide on data governance best practices. These final steps—documentation, testing, and security—are what will transform your good data model into a truly trusted engine for business intelligence.
Common Questions About Building Data Models
Even with the best-laid plans, a few questions always seem to surface when you're deep in the weeds of data modeling. Let's tackle some of the most common ones I hear—getting these right will help you sidestep potential roadblocks.
What's the Difference Between a Logical and a Physical Data Model?
I like to think of a logical data model as the architect's blueprint. It’s a high-level design that lays out your business entities, their attributes, and how they relate to one another. At this stage, you're not thinking about databases or technology; it's all about nailing down the business rules.
The physical data model, on the other hand, is the actual construction. This is where you translate that blueprint into real-world database objects: tables, columns, specific data types (VARCHAR, INT, etc.), and indexes for your chosen database system. It's the finished product, ready to be populated with data.
How Often Should I Update My Data Model?
A data model isn't a "set it and forget it" project. It’s a living part of your business infrastructure and has to evolve as your company does. You should absolutely plan to revisit and update your model anytime there's a meaningful change in the business.
What triggers an update?
Launching a new product line.
Expanding into a new market or sales region.
Overhauling a core business process, like how you handle customer support tickets.
As a rule of thumb, I recommend scheduling a formal review of your key models at least once a quarter. And please, use version control. It’s essential for managing changes in a sane way and keeping a history of how the model has grown. Getting this right is a big deal, especially when you consider the global data analytics market is projected to reach $132.9 billion by 2026—and solid data models are the engine driving that value. You can discover more insights on data analytics trends to see where things are headed.
Can I Build a Data Model Without Knowing SQL?
For the conceptual part, yes. You can absolutely design a logical model using visual tools without writing a single line of code. In fact, that's often the best way to collaborate with business stakeholders who don't live in the database world.
But when it's time to build, SQL is non-negotiable. Implementing the physical model and creating the ETL/ELT pipelines to feed it is nearly impossible without it. SQL is the language we use to create tables, transform raw data, and build the fact and dimension tables that form the backbone of a data warehouse. For anyone serious about hands-on data modeling, SQL is a must-have skill.
Ready to make your data model accessible to everyone on your team? Querio's AI-powered platform allows non-technical users to ask questions in plain English and get trusted answers in seconds, turning your well-designed model into a true self-service analytics engine. https://www.querio.ai

