Business Intelligence
9 Best AI-Powered Data Analysis Tools for Non-Technical Users in 2026
Compare nine AI analytics tools that help non-technical teams query live data, use natural language, and maintain governed metrics.
In 2026, AI-powered data analysis tools make it easy for non-technical users to extract insights without coding or SQL knowledge. These tools connect directly to data warehouses, use natural language queries, and ensure consistent metrics through governed layers. Here's a quick rundown of the nine best options:
Querio: Ideal for live, governed analytics with a shared semantic layer and inspectable SQL/Python outputs.
ThoughtSpot: Great for instant answers via natural language search and robust governance features.
Looker: Best for centralized reporting with consistent metrics using LookML.
Microsoft Power BI: Perfect for organizations using Microsoft 365, with AI-driven insights and strong security.
Tableau: Known for polished visual storytelling and interactive dashboards.
Google Looker Studio: Free and user-friendly for simpler reporting, especially for Google ecosystem users.
Zoho Analytics: Affordable and easy for small to mid-size teams, with natural language queries and prebuilt dashboards.
Qlik Sense: Best for exploring complex datasets with its associative engine and strong governance.
Domo: Focuses on real-time dashboards and collaboration, with extensive data connectors.
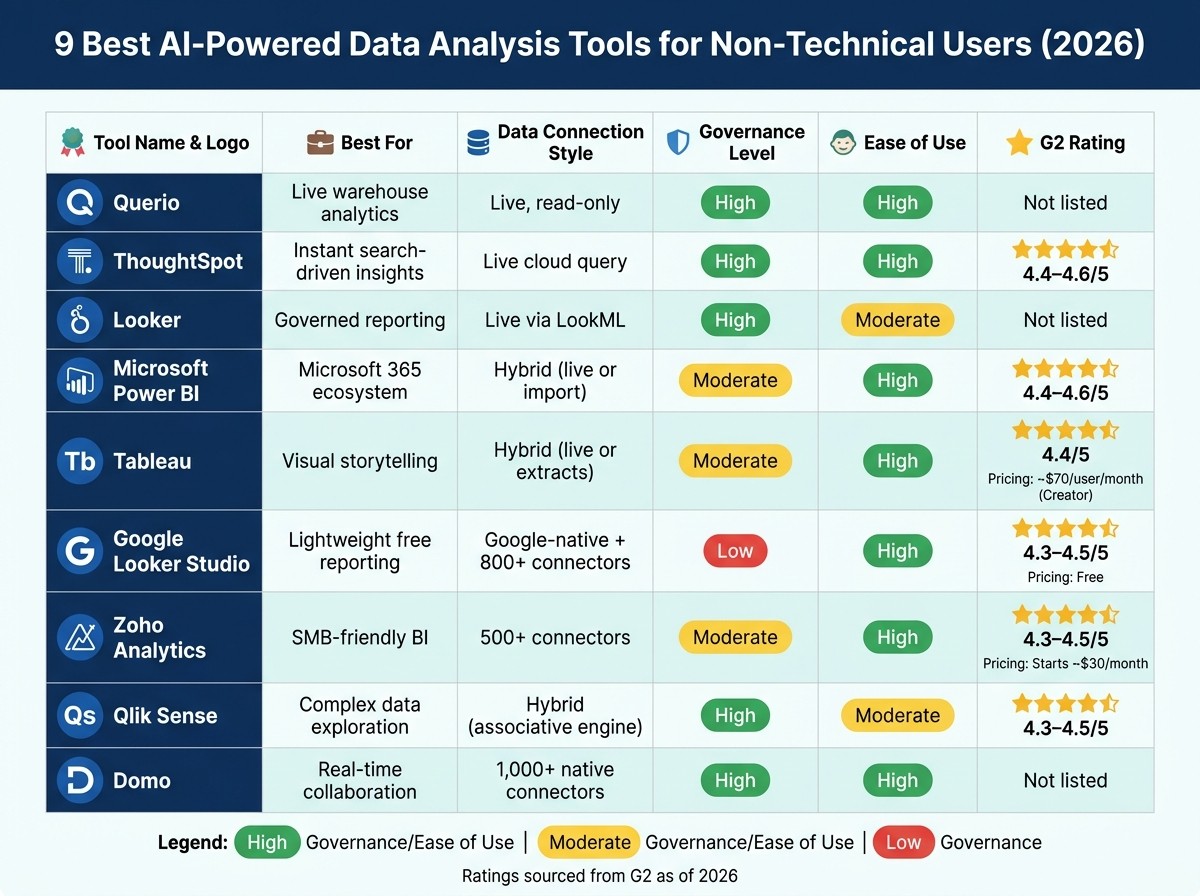
Quick Comparison
Tool | Best For | Data Connection | Governance | Ease of Use |
|---|---|---|---|---|
Querio | Live warehouse analytics | Live, read-only connection | High – Shared semantic layer | High – Natural language queries |
ThoughtSpot | Instant, search-driven insights | Live cloud query | High – Role-based access control | High – Google-like search bar |
Looker | Governed reporting | Live via LookML | High – Centralized logic | Moderate – Requires setup by data teams |
Microsoft Power BI | Microsoft ecosystem integration | Hybrid – Live or import | Moderate – Row-level security | High – Drag-and-drop interface |
Tableau | Visual storytelling | Hybrid – Live or in-memory extracts | Moderate – Certified sources | High – Interactive dashboards |
Google Looker Studio | Lightweight reporting | Google-native and partner connectors | Low – Limited governance | High – Free and easy to use |
Zoho Analytics | SMB-friendly BI | 500+ connectors | Moderate – Role-based access | High – Prebuilt dashboards |
Qlik Sense | Complex data exploration | Hybrid – Associative engine | High – Strong security features | Moderate – Learning curve for advanced use |
Domo | Real-time collaboration | 1,000+ native connectors | High – Certified datasets | High – Mobile-friendly dashboards |
These tools cater to different needs, from small teams needing simple reports to large organizations requiring advanced governance. Choose based on your team's size, data complexity, and integration needs.
9 Best AI-Powered Data Analysis Tools for Non-Technical Users (2026)
Top 8 AI Tools For Data Analysts In 2026 | Best AI Tools Every Data Analyst Must Know | Simplilearn

1. Querio

Querio is an AI-powered workspace tailored for teams working with modern data warehouses. It allows business users to ask questions in plain English - like "What were our top five revenue-generating product lines in Q1 2026?" - and get instant responses in the form of charts, tables, or plain-language summaries. Every query reflects live data, ensuring the information is always up-to-date.
Querio connects securely to major data warehouses such as Snowflake, BigQuery, Amazon Redshift, ClickHouse, and PostgreSQL using encrypted, read-only access. This direct connection ensures that when data teams update tables, all Querio queries automatically reflect the latest changes. For example, a sales director reviewing last week's closed-won deals will always see the most current figures without needing to refresh or recheck.
One standout feature of Querio is its shared business logic layer. Data teams define key metrics - like "monthly recurring revenue", "active user", or "qualified lead" - once, and these definitions are applied consistently across the organization. This means teams like finance and product always see the same churn rate or other metrics, avoiding discrepancies caused by inconsistent formulas or definitions in spreadsheets. This consistency fosters clarity and alignment across departments.
Another key feature is the viewable SQL and Python outputs. While non-technical users benefit from intuitive visualizations, analysts can dive into the underlying SQL or Python to review, refine, and improve query logic. This transparency builds confidence in the data and ensures ongoing optimization.
Querio’s conversational interface includes autocomplete, guided question templates, and safeguards that limit queries to approved data models. These features help reduce errors, like misinterpreted or mis-aggregated data, especially in high-stakes presentations.
Capability | How It Works in Querio |
|---|---|
Live data access | Direct, encrypted read-only connection to warehouses like Snowflake, BigQuery, and Redshift |
Natural language queries | Translates plain English into SQL/Python for seamless querying |
Shared business logic | Metrics defined once are consistently applied across all queries and dashboards |
Viewable outputs | Full visibility into generated SQL/Python, enabling analysts to refine and verify results |
Governance & permissions | Inherits row-level security from the warehouse to safeguard sensitive data |
2. ThoughtSpot
ThoughtSpot is an AI-driven analytics platform that allows business users to ask questions in plain English and receive real-time answers - no need for SQL expertise or waiting on a BI developer. This empowers users to access insights instantly, streamlining decision-making.
The platform connects directly to cloud data warehouses like Snowflake, Google BigQuery, Amazon Redshift, and Databricks through live connections. This means queries are executed against your actual data warehouse in real time. For example, a sales operations leader at a B2B SaaS company could type "pipeline by stage and owner for Q2 2026" and immediately see a live breakdown sourced directly from Snowflake. This approach enables non-technical users to analyze live data without needing specialized skills.
For those concerned about governance, ThoughtSpot offers a robust framework. Data engineers can define trusted metrics, joins, and field names within Analyst Studio using ThoughtSpot's modeling language (TML). These definitions are automatically applied to every query, ensuring consistency and accuracy. Additionally, role-based access control (RBAC) and object-level security ensure that data visibility remains appropriate for each user. Audit logs track query activity, which is particularly valuable for teams in regulated sectors like healthcare or finance. This governance structure ensures users can explore data confidently while maintaining compliance and security.
Transparency is another key strength of ThoughtSpot. The platform reveals the logic behind every result. Its SpotIQ feature not only generates visualizations but also explains the underlying trends, identifying which dimensions influenced the changes. The AI assistant, Spotter, interprets natural language queries and displays the filters and aggregations it applied, making it easy for users to validate results. For those needing deeper analysis, ThoughtSpot exposes the SQL query behind the scenes, allowing analysts to dive further into the data.
Capability | ThoughtSpot |
|---|---|
Data connection | Live queries to Snowflake, BigQuery, Redshift, Databricks |
User Interface | Search bar (Google-like) + Spotter AI assistant |
Logic transparency | SpotIQ explains root causes; SQL view available for analysts |
Governance | TML-based semantic modeling, RBAC, object-level security, audit logs |
Visualization | Liveboards - interactive, real-time, shareable |
ThoughtSpot highlights how how AI is transforming data analytics to bridge the gap between technical and non-technical users. On G2, the platform maintains a strong rating of 4.4–4.6 out of 5, with users frequently praising its intuitive search interface and seamless integration with Snowflake and BigQuery. However, some reviews mention that the initial setup requires skilled data engineers, as the self-service experience depends on the quality of the semantic layer built during implementation.
3. Looker
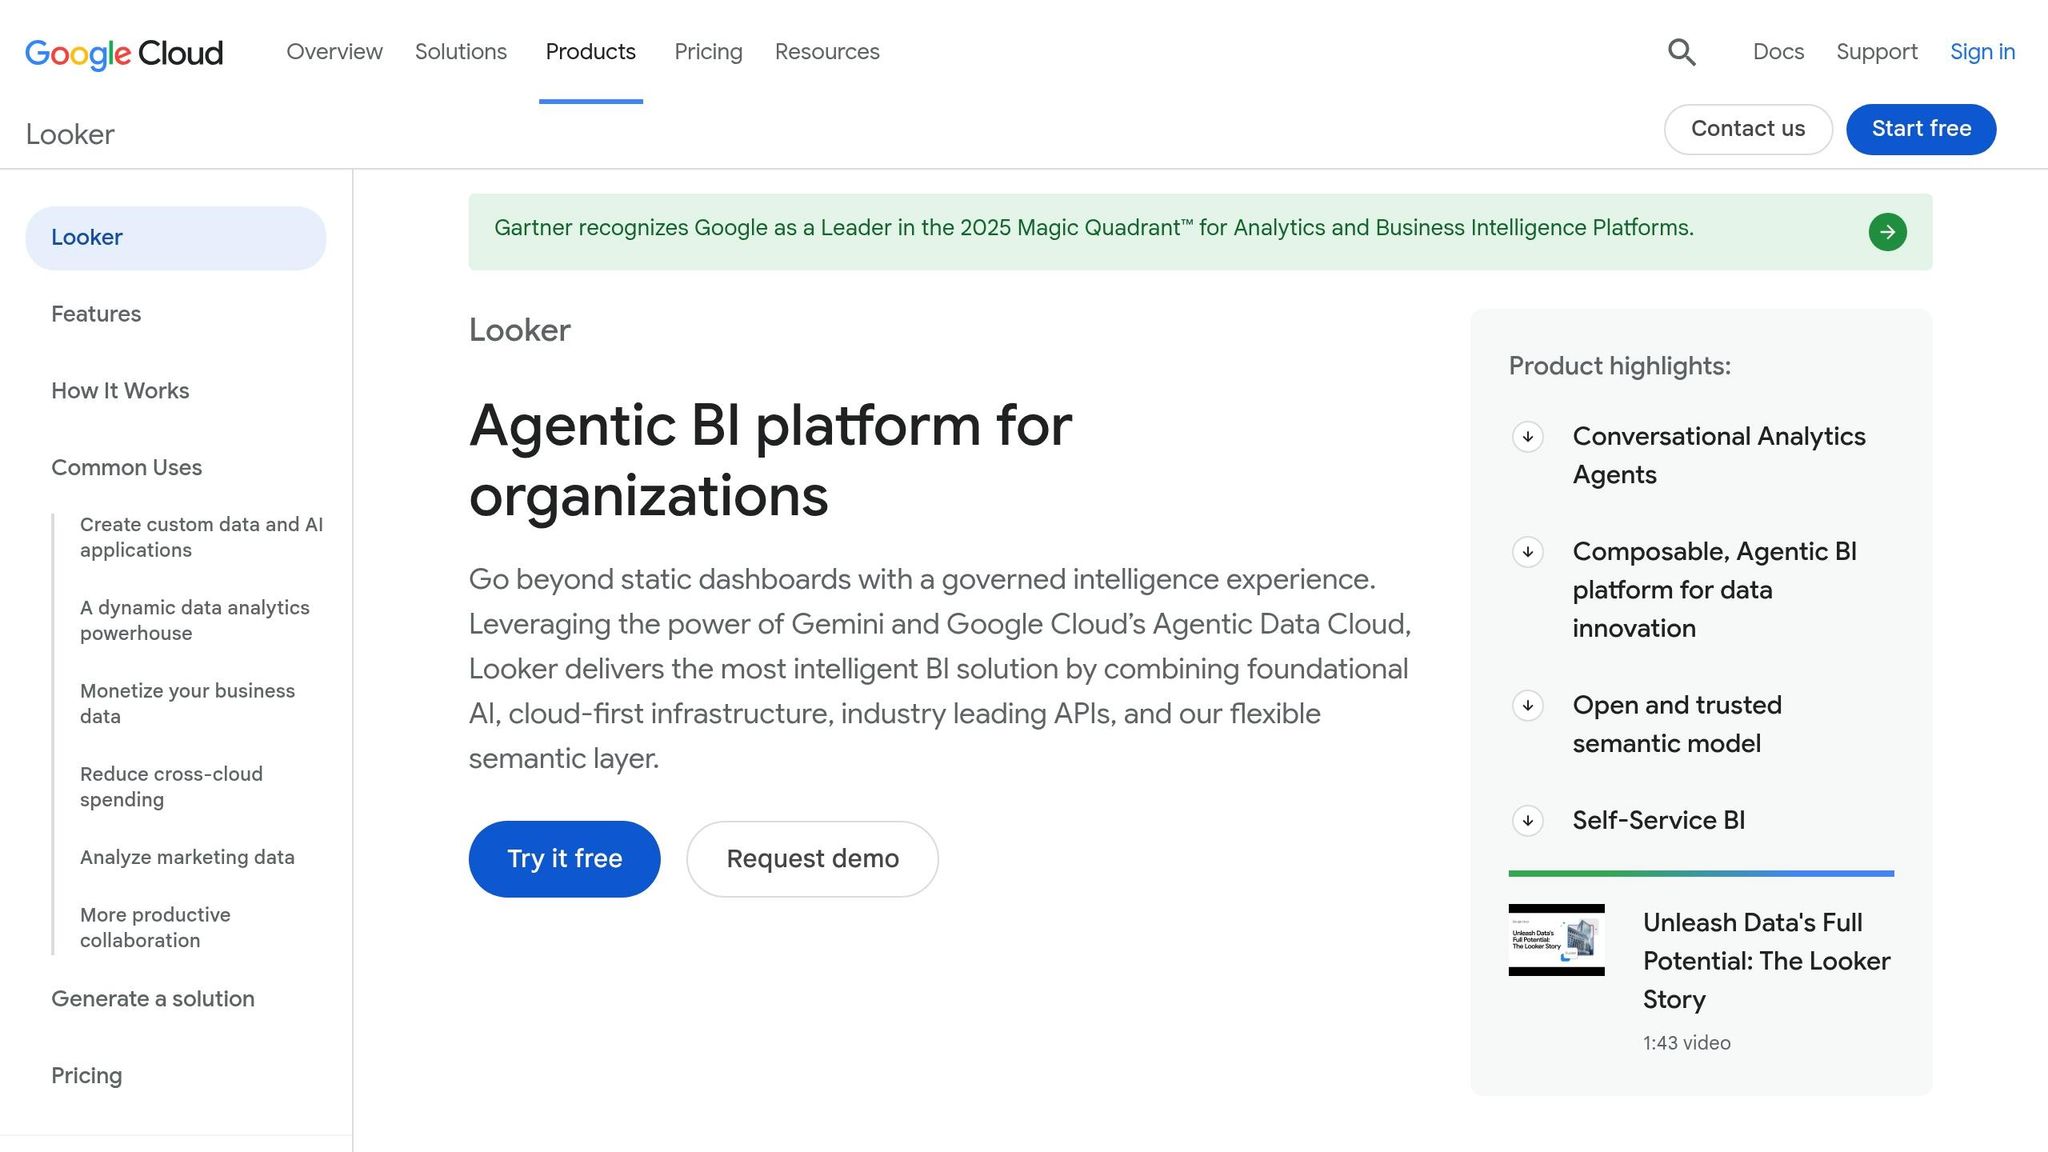
Looker, now part of Google Cloud, is a business intelligence (BI) tool designed to work directly with data warehouses. Powered by LookML, it runs live queries on platforms like Snowflake, BigQuery, Redshift, and Postgres, ensuring the data you see is always up-to-date.
One of Looker’s standout features is its centralized LookML. This allows data engineers to define metrics, joins, and business logic in one place, ensuring consistency across all reports and dashboards. For example, whether a revenue operations manager or a finance analyst pulls metrics like "ARR", they’ll always see the same figure. This is especially helpful for B2B SaaS teams managing intricate metrics like NRR or logo churn.
That said, Looker isn’t the most user-friendly tool for non-technical users. While its pre-built Explores enable basic filtering, pivoting, and visualization without needing SQL, expanding these capabilities often requires a data engineer’s expertise. The lack of a natural language interface and limited visibility into query logic can make it harder for less technical teams to dive deeper into their data.
Capability | Looker |
|---|---|
Data connection | Live queries to Snowflake, BigQuery, Redshift, Postgres |
User interface | Structured Explores; no natural language input |
Logic transparency | LookML visible to developers; limited for end users |
Governance | Centralized LookML semantic layer, RBAC |
Visualization | Dashboards and Looks; embedded analytics available |
Users frequently praise Looker for its consistency and live-data integration. However, its reliance on technical teams to extend LookML can be a hurdle, especially for smaller organizations with limited data engineering resources. Larger teams with strong technical support tend to get the most out of Looker, while others might find the overhead burdensome.
4. Microsoft Power BI

Microsoft Power BI stands out by combining strong data connectivity with seamless integration into the Microsoft ecosystem. Thanks to its compatibility with tools like Excel, Teams, and SharePoint, it allows non-technical users to access dashboards directly within applications they already know. Like other tools covered in this guide, Power BI emphasizes live data connectivity and secure, governed semantic layers, offering real-time insights to users.
Power BI supports a wide range of connectors, including Snowflake, BigQuery, Azure Synapse, Redshift, SQL Server, Salesforce, and Google Analytics. With the option to use either Import mode or DirectQuery, users can tailor their approach to balance performance with the need for real-time data access.
One of Power BI's strengths lies in its data governance capabilities. Shared semantic models allow data teams to define standardized measures, such as "ARR" or "Gross Margin %", and publish them for business users to create reports without altering underlying logic. Row-level security (RLS) ensures that users only access data relevant to their roles - for instance, a regional sales manager will only see metrics for their specific region. According to a 2023 Forrester Total Economic Impact study commissioned by Microsoft, organizations that adopted Power BI reduced IT reporting workloads by 24% and achieved up to 366% ROI over three years [1]. This governance framework forms the foundation for its advanced AI-driven insights.
Power BI's AI features are tailored for non-technical users, making data analysis more accessible. The natural language Q&A feature lets users type simple queries like "total revenue by region in Q1 2026", and Power BI instantly generates the appropriate visuals. The Key Influencers visual identifies factors impacting specific metrics, while Smart Narratives automatically create written summaries - such as "Sales increased 12% month-over-month, mainly driven by the West region" - that update dynamically with filters. On-screen explanations and tooltips help users understand how these insights are generated.
Capability | Power BI |
|---|---|
Data Connection | Import mode and DirectQuery; supports Snowflake, BigQuery, Redshift, SQL Server, Salesforce, Google Analytics, and more |
User Interface | Drag-and-drop canvas; natural language Q&A; Copilot (generative AI) |
Logic Transparency | Shared semantic models with DAX measures; field descriptions available via tooltips |
Governance | Row-level security (RLS), sensitivity labels, workspace permissions, Microsoft Purview integration |
Visualization | Dashboards, reports, Key Influencers, Decomposition Tree, Smart Narratives |
That said, creating or modifying semantic models often requires knowledge of DAX, which can be a hurdle for non-technical users. However, once the semantic model is in place, teams can interact with and query data dynamically. Power BI consistently earns user ratings between 4.4 and 4.6 out of 5 on platforms like G2 and Gartner Peer Insights, with many highlighting its cost-effectiveness and seamless integration within the Microsoft ecosystem.
5. Tableau

By 2026, Tableau continues to make data visualization accessible for non-technical users, aligning with the growing demand for governed, warehouse-native, self-service analytics. Now integrated into Salesforce, Tableau has expanded its AI features and strengthened its connection with Salesforce data, solidifying its reputation as a leader in self-service business intelligence (BI).
Tableau supports 400+ data sources, including major platforms like Snowflake, BigQuery, Redshift, SQL Server, Salesforce, Google Analytics, and Excel. Teams can choose between live connections for real-time data access or in-memory extracts to handle large datasets more efficiently. This flexibility allows business users to work seamlessly with data without needing technical expertise.
The platform ensures data accuracy and governance through certified sources and role-based permissions. For example, standardized definitions like "ARR" or "Churn Rate" ensure users rely on approved data, while row-level security restricts access so that, say, a regional sales manager only views their territory’s data. These features make Tableau an excellent tool for non-technical teams while complementing the live connectivity and governance-focused analytics of tools like Querio.
Tableau’s user-friendly design allows non-technical users to apply filters, drill into data, and use pre-built dashboards with ease. Its natural language interface, Tableau Agent, lets users type plain-English requests like "show me sales by region for Q4" to instantly generate visualizations. Tableau Pulse keeps stakeholders updated by sending personalized metric alerts directly to Slack, email, or Microsoft Teams, eliminating the need to log into the platform. Additionally, Data Stories translates dashboard data into written summaries, making it easier to share insights with decision-makers who prefer narratives over charts.
The platform’s effectiveness is evident in real-world applications. For instance, Charles Schwab's Analytics & Reporting team reported a 30–40% reduction in report development time after adopting Tableau. This improvement enabled wealth management teams to quickly access performance dashboards and deliver faster insights to clients. Tableau’s true potential, however, is best realized when data teams set up certified sources and permissions, aligning with the vision of governed self-service analytics.
Capability | Tableau |
|---|---|
Data Connection | 400+ connectors; supports live connections and in-memory extracts; integrates with Snowflake, BigQuery, Redshift, Salesforce, Excel, and more |
User Interface | Drag-and-drop canvas; Tableau Agent (natural language queries); Tableau Pulse (Slack/email/Teams notifications) |
Logic Transparency | Drag-and-drop actions generate SQL/MDX automatically; users interact visually rather than writing queries |
Governance | Certified data sources, row-level security, role-based permissions (Viewer/Explorer/Creator), AD/SAML/OAuth integration |
Visualization | Interactive dashboards, drill-downs, Data Stories (narrative summaries), Explain Data (AI-driven outlier detection) |
On G2, Tableau scores an average rating of 4.4 out of 5, with users frequently applauding its rich visualization capabilities and active community resources. However, some users note challenges like high licensing costs - Creator seats are approximately $70 per user per month - and the complexity of managing its suite of products (Desktop, Prep, Server/Cloud), particularly for smaller teams.
6. Google Looker Studio
Google Looker Studio, previously known as Data Studio (renamed in October 2022), is a free, browser-based tool designed for creating interactive dashboards. It’s aimed at non-technical users, making it easy to build reports without needing to write any code. While it’s accessible and user-friendly, it doesn’t offer the same level of governance or advanced analytics as some other tools.
One of Looker Studio’s standout features is its data connectivity, especially for users already immersed in the Google ecosystem. It supports over 25 native connectors for Google services like BigQuery, Google Analytics 4 (GA4), and Google Ads. Additionally, there are more than 800 community connectors available. However, some third-party connectors come with a monthly fee, typically ranging from $19 to $39. For teams using BigQuery, the native integration is particularly efficient, capable of handling massive datasets with ease, thanks to BigQuery BI Engine’s in-memory acceleration. This seamless connectivity makes it a go-to for creating reports quickly and efficiently.
The tool is relatively easy to learn. Users can take advantage of drag-and-drop functionality, pre-designed templates (such as GA4 ecommerce or Google Ads performance templates), and simple filter controls to create polished reports in just a few hours. For example, a marketing team could combine data from Google Ads, Search Console, and a Sheets-based budget tracker into a single, shareable dashboard. However, more complex tasks - like using calculated fields or blending multiple data sources - demand a higher level of data expertise. As a result, Looker Studio is better suited for recurring, straightforward reporting rather than in-depth exploratory analysis.
Governance is where Looker Studio shows its limitations. Sharing relies on Google Drive permissions, which works well for small teams but becomes less manageable as the team grows. The free version lacks features like centralized metric definitions, version control, and row-level security. Without a built-in semantic layer, teams must enforce consistency manually, which can lead to duplicate or inconsistent dashboards. Looker Studio Pro, a paid add-on, addresses some of these challenges by offering team workspaces and enterprise-level controls. Google is gradually aligning Looker Studio with the Looker semantic model, but as of mid-2026, the free version still requires sensitive data to be routed through governed sources like BigQuery.
When it comes to explainability, Looker Studio serves as a visualization tool rather than an analytics engine. While users can inspect elements like filters, date ranges, and breakdown dimensions, it doesn’t offer AI-generated insights or anomaly detection. To address this, users can manually add annotations to their reports, explaining metric definitions, data freshness, and any filter assumptions.
Capability | Google Looker Studio |
|---|---|
Data Connection | 25+ native Google connectors (BigQuery, GA4, Ads, Sheets); 800+ community/partner connectors; some third-party connectors require paid add-ons |
User Interface | Drag-and-drop canvas; pre-built templates; filter controls; no coding required for standard reports |
Logic Transparency | Visualization layer only; users can inspect filters and calculated fields, but no AI-driven explanations or SQL visibility |
Governance | Google Drive–style sharing; no centralized semantic layer or version control in free tier; Looker Studio Pro adds enterprise controls |
Pricing | Free (core product); third-party connectors ~$19–$39/month; Looker Studio Pro priced per user/month as enterprise add-on |
On G2, Looker Studio earns a solid rating of 4.3–4.5 out of 5, with users frequently praising its free access and smooth integration with Google tools. However, common complaints include its governance limitations for larger teams, performance issues with complex blended reports, and reliance on paid connectors for non-Google platforms.
7. Zoho Analytics

Zoho Analytics is a self-service BI platform tailored for business users who prefer not to deal with SQL or depend heavily on data teams. Its AI assistant, Zia, simplifies data analysis by allowing users to ask plain-English questions like "Which products had the highest returns last quarter?" and instantly receive visuals such as charts, pivot tables, or KPI widgets. This natural language querying, combined with automatically generated visuals, makes it especially appealing for non-technical managers.
Beyond its query simplicity, Zoho Analytics shines in data integration. Its ability to connect with various data sources is a standout feature. The platform supports over 500 connectors, including cloud databases, SaaS applications, local files (like Excel and CSV), and on-premise databases. It also offers 75+ prebuilt connectors for popular tools like Salesforce, HubSpot, Shopify, and QuickBooks. These connectors come with over 100 ready-made reports and dashboards, enabling teams to uncover insights in just a few hours. For organizations with structured data setups, Zoho Analytics integrates seamlessly with cloud warehouses such as Snowflake, BigQuery, and Redshift.
What sets Zoho Analytics apart is its ability to explain AI-generated insights. Zia Insights provides narrative summaries alongside visual data, highlighting key contributors, seasonal patterns, and anomalies. For instance, a sales manager investigating a revenue dip doesn’t need to sift through spreadsheets - Zia delivers a concise explanation directly on the dashboard, saving time and effort.
Governance features are well-suited for its target audience. Zoho Analytics includes tools like role-based access control, row-level security, SAML SSO (compatible with Okta and Azure AD), audit logs, and GDPR-compliant data residency options. For example, a regional sales manager might only see data for their specific territory, while finance teams retain broader access. These governance tools are configured without the need for custom coding, making them ideal for mid-market teams seeking secure and manageable analytics.
Capability | Zoho Analytics |
|---|---|
Data Connection | 500+ connectors: SaaS apps, cloud/on-premise databases, files; 75+ prebuilt app connectors with ready-made dashboards |
AI Features | Ask Zia (natural language Q&A), Zia Insights (narrative summaries), anomaly detection, forecasting |
How Answers Are Presented | Auto-generated charts, pivot tables, KPI widgets, and plain-language text summaries |
Governance | Role-based access, row-level security, SAML SSO, audit logs, GDPR compliance |
Pricing | Starts at ~$30/month (2 users); higher tiers available for more users and data volume; included in Zoho One |
Zoho Analytics holds a 4.3–4.5 out of 5 rating on G2, based on over 1,000 reviews. Users frequently highlight its ease of use and affordability. However, some report performance issues with very large datasets, and others find its visualization customization less flexible compared to Tableau or Power BI. This makes it a strong choice for SMB and mid-market teams, particularly those already using other Zoho tools, but it may not be the best fit for enterprise environments with complex, data-heavy workloads.
Next, we’ll look at more tools pushing the boundaries of self-service analytics.
8. Qlik Sense
Qlik Sense stands out by using an associative in-memory engine, which replaces static SQL queries and allows users to freely explore data. For example, clicking on a value like a product category or sales region instantly highlights related data (in white) and unrelated data (in gray). This approach enables non-technical users to uncover unexpected patterns without needing to write code.
It supports a wide range of data sources, including cloud warehouses like Snowflake, BigQuery, and Redshift, relational databases such as SQL Server, Oracle, and PostgreSQL, SaaS applications like Salesforce and Google Analytics, and file formats like Excel and CSV. With over 100 native connectors, Qlik Sense simplifies integration. For on-premise data, the Qlik Data Gateway ensures secure access, which is especially important for industries like healthcare and financial services that require strict compliance.
Qlik Sense also emphasizes governance. Data teams can define reusable dimensions and measures - like "Total Revenue (USD)" or "Gross Margin %" - that automatically update across dashboards. Row-level security, managed through section access, ensures users only see the data they’re authorized to view. These governance features are all managed via the Qlik Management Console, eliminating the need for custom coding.
To ensure transparency, Qlik Sense includes a data load editor and a master items panel, allowing users to review KPI formulas and ETL logic. This transparency is crucial, especially when high-stakes decisions depend on accurate data - like a CFO verifying revenue figures during a board meeting.
On G2, users rate Qlik Sense between 4.3 and 4.5, praising its fast in-memory analytics and strong governance features. However, some note that advanced features and data modeling come with a steeper learning curve compared to other tools. Despite this, Qlik Sense’s combination of dynamic exploration and governance makes it a solid choice for mid-to-large organizations.
Capability | Qlik Sense |
|---|---|
Data Connection | Snowflake, BigQuery, Redshift, SQL Server, Oracle, PostgreSQL, Salesforce, Google Analytics, Excel, CSV; 100+ native connectors; Qlik Data Gateway for on-premise |
User Interface | Associative engine with click-to-explore; no coding required |
Logic Transparency | Data load editor and master items panel expose KPI formulas and ETL logic |
Governance | Master items library, section access (row-level security), Qlik Management Console |
Pricing | Subscription-based in USD; separate Professional (authoring) and Analyzer (consumption) tiers; custom quotes required |
9. Domo
Domo is a cloud-based BI platform designed to make real-time data accessible to everyone in an organization. It markets itself as a "data experience platform", seamlessly integrating analytics into daily workflows through dashboards, mobile apps, alerts, and collaboration tools. This approach is particularly beneficial for non-technical professionals, such as sales managers, operations leads, or marketing specialists, who need easy access to actionable insights.
One of Domo's standout features is its extensive connectivity, offering more than 1,000 pre-built native connectors. These connectors link to popular systems like Salesforce, Google Analytics, Microsoft 365, Snowflake, MySQL, and even social media platforms. With a simple point-and-click interface, non-technical users can integrate data sources without needing to write code. For data preparation, Domo's Magic ETL provides a drag-and-drop environment for tasks like joining, filtering, and transforming data. This means, for instance, a marketing analyst can clean up campaign data independently, without relying on a data engineer.
Domo also shines when it comes to governance. Data teams can certify specific datasets and cards to signal which metrics are verified and reliable. The platform's row-level security (Personalized Data Permissions) ensures sensitive information - like detailed compensation data - is only visible to authorized teams, such as HR or finance, while others see only high-level KPIs. Features like data lineage tracking and approval workflows further enhance governance, ensuring accountability as self-service analytics expand across the organization.
For added clarity, Domo includes tools that make data easier to interpret. Its AI Chat, part of the Domo AI suite, allows users to ask natural-language questions like, "What were our sales by region this quarter compared to last quarter?" and receive visual answers they can save directly to dashboards. Automated narratives translate chart trends into plain-English insights, making it easier for non-technical managers to present data-driven stories to stakeholders. According to an ESG economic validation report, businesses using Domo have significantly reduced dashboard creation times - from days or weeks to just minutes or hours - helping users make quick, informed decisions.
Most users interact with Domo through personalized dashboards, respond to alerts triggered by set thresholds, and collaborate using in-platform comments. The mobile app ensures they can stay connected on the go. However, advanced data modeling requires more expertise, and Domo's custom pricing places it in the mid-to-high price range.
Capability | Domo |
|---|---|
Data Connection | 1,000+ native connectors; includes Snowflake, Salesforce, Google Analytics, MySQL, Microsoft 365, and more; drag-and-drop setup |
User Interface | Self-service card builder, interactive dashboards, mobile-first design, no coding required |
Logic Transparency | Automated narrative summaries, AI Chat explanations, driver analysis for metric context |
Governance | Certified datasets, row-level security (PDP), data lineage, role-based access, approval workflows |
Pricing | Custom-quoted in USD; Standard, Enterprise, and Business-Critical tiers; typically tens of thousands of dollars per year and up |
Comparison Table
These nine tools cater to non-technical users by providing AI-powered data analysis with live, governed warehouse connections and clear insights. The table below highlights each tool's key features and strengths.
Tool | Best Use Case | Data Connection Style | Governance & Explainability | Ideal User Type |
|---|---|---|---|---|
Querio | Live warehouse analytics with governed self-serve | Live, read-only connection (Snowflake, BigQuery, Redshift, ClickHouse, Postgres) | High - shared semantic/context layer, inspectable SQL and Python, versioned logic | Data teams and non-technical users at B2B SaaS companies running a modern data warehouse |
ThoughtSpot | Instant visual answers via natural-language search | Zero-copy, live cloud query | High - metadata privacy controls, verifiable query plans | Non-technical business users who need fast, search-driven answers |
Looker | Governed reporting built on a centralized data model | Live warehouse connection via LookML | High - LookML enforces a single source of truth; strong row-level security | Data analysts and BI teams managing consistent metrics across departments |
Microsoft Power BI | Analytics inside the Microsoft 365 ecosystem | Hybrid - DirectQuery (live) or in-memory import | Moderate - row-level and object-level security; DAX-based logic | Organizations already running Microsoft 365, Azure, or Teams |
Tableau | Visual storytelling and executive dashboards | Hybrid - live connections or .hyper extracts | Moderate - Einstein Trust Layer; proprietary VizQL logic | Executives and analysts who prioritize rich, polished visualizations |
Google Looker Studio | Free, lightweight reporting on Google data | Native Google connectors; partner connectors for others | Low to moderate - limited governance; no semantic layer | Small teams and individuals using Google Analytics, Sheets, or Ads |
Zoho Analytics | Affordable all-in-one BI for small to mid-size teams | Import, live connections, and Zoho app sync | Moderate - role-based access, data backup, audit trails | SMBs and teams already in the Zoho ecosystem |
Qlik Sense | Complex, multi-source associative data exploration | Hybrid - QIX in-memory engine or direct query | Moderate to high - dynamic data masking, section access, lineage | Analysts handling large, fragmented datasets across many sources |
Domo | Real-time operational BI with broad connectivity | 1,000+ native connectors; cloud-based data hub | High - certified datasets, PDP row-level security, approval workflows | Operations, sales, and marketing teams needing mobile-friendly, real-time dashboards |
This comparison highlights how live connection capabilities and a governed semantic layer set the standard for modern self-serve analytics.
Key Takeaways
Live connections offered by tools like Querio, ThoughtSpot, and Looker ensure real-time data accuracy by avoiding the pitfalls of static exports.
Governance and explainability are strongest in tools with structured semantic layers. Querio's semantic/context layer, for instance, defines metrics and joins once, ensuring consistent results across dashboards and AI-generated insights. Looker achieves similar outcomes with LookML, though it requires more technical setup.
Tools like Zoho Analytics, Google Looker Studio, and Domo, which don't rely on a dedicated data warehouse, are easier to set up but trade off advanced governance. These tools work best for smaller teams with straightforward reporting needs.
Conclusion
Selecting the right AI-powered data analysis tool comes down to its ability to connect with your data sources, maintain governance, and provide ease of use for non-technical users looking to extract meaningful insights.
For teams already working with modern data warehouses like Snowflake, BigQuery, Redshift, or Postgres, tools offering live, direct connections and a structured semantic layer are the way to go. These features help avoid the common pitfalls of outdated data caused by CSV exports and manual imports. The right choice will align with your existing infrastructure and streamline your workflows.
If your team requires consistent metrics and real-time data access without relying heavily on data teams, Querio is a strong contender with its governed semantic layer and clear query logic. For those deeply integrated into the Microsoft 365 ecosystem, Power BI is an excellent fit. When visual storytelling and creating executive-level presentations take center stage, Tableau shines. Meanwhile, ThoughtSpot is ideal for teams prioritizing search-driven, instant insights. Each tool brings its own strengths, but if governance, inspectable SQL/Python outputs, and live connections to your warehouse are essential, Querio’s warehouse-native approach ensures reliable and consistent insights.
For smaller teams with simpler reporting needs and without a dedicated data warehouse, Google Looker Studio and Zoho Analytics offer user-friendly options to get started quickly, though they may lack advanced governance features.
Ultimately, the best tool is the one that fits your infrastructure and supports your team’s workflows. Trust and regular usage matter more than a long list of features. For data teams seeking a dependable, governed, self-serve solution in a warehouse environment, Querio stands out as a powerful choice.
Related Blog Posts


