Business Intelligence
Top AI tools for data exploration
Explore top AI tools that simplify data exploration for businesses, enabling insights and visualizations without technical expertise.
In today's data-driven world, AI tools are transforming how businesses analyze and understand data. These platforms simplify complex tasks, making it easy for non-technical users to extract insights, create visualizations, and make informed decisions. Here's a quick look at some of the leading AI tools for data analysis:
Querio: Translates plain-English queries into SQL, offers real-time data connections, and ensures data security with SOC 2 compliance. Starts at $14,000/year for unlimited viewers.
Tableau with AI: Features like "Ask Data" and "Explain Data" allow users to interact with data naturally and uncover patterns. Pricing starts at $75/user/month.
Microsoft Power BI Copilot: Integrates seamlessly with the Microsoft ecosystem, enabling natural language queries and automated insights for as low as $10/user/month.
ThoughtSpot: Offers search-driven analytics and automated insights with SpotIQ. Pricing typically ranges from $95-$125/user/month.
Qlik: Provides dynamic data exploration with an associative analytics engine, starting at $30/user/month.
IBM Watsonx: Tailored for enterprise needs, it combines natural language processing with robust compliance features. Pricing is consumption-based.
Each tool has its strengths, from natural language querying to advanced visualization capabilities, catering to different business needs and budgets.
Quick Comparison
Tool Name | Core Features | Starting Price | Best For |
|---|---|---|---|
Querio | AI-driven SQL, real-time connections | $14,000/year | Teams needing broad access to insights |
Tableau with AI | Ask Data, Explain Data | $75/user/month | Advanced visualizations |
Microsoft Power BI | Natural language Q&A, MS integration | $10/user/month | Microsoft users |
ThoughtSpot | Search-driven analytics, SpotIQ | $95-$125/user/month | Self-service analytics teams |
Qlik | Associative engine, AutoML | $30/user/month | Complex data relationships |
IBM Watsonx | NLP, AutoAI, enterprise compliance | Varies by usage | Large enterprises |
These tools empower businesses to analyze data faster and more efficiently, ensuring better decisions and improved outcomes.
I Tested 53 AI Tools for Data Analysis - THESE 5 ARE THE BEST!
1. Querio
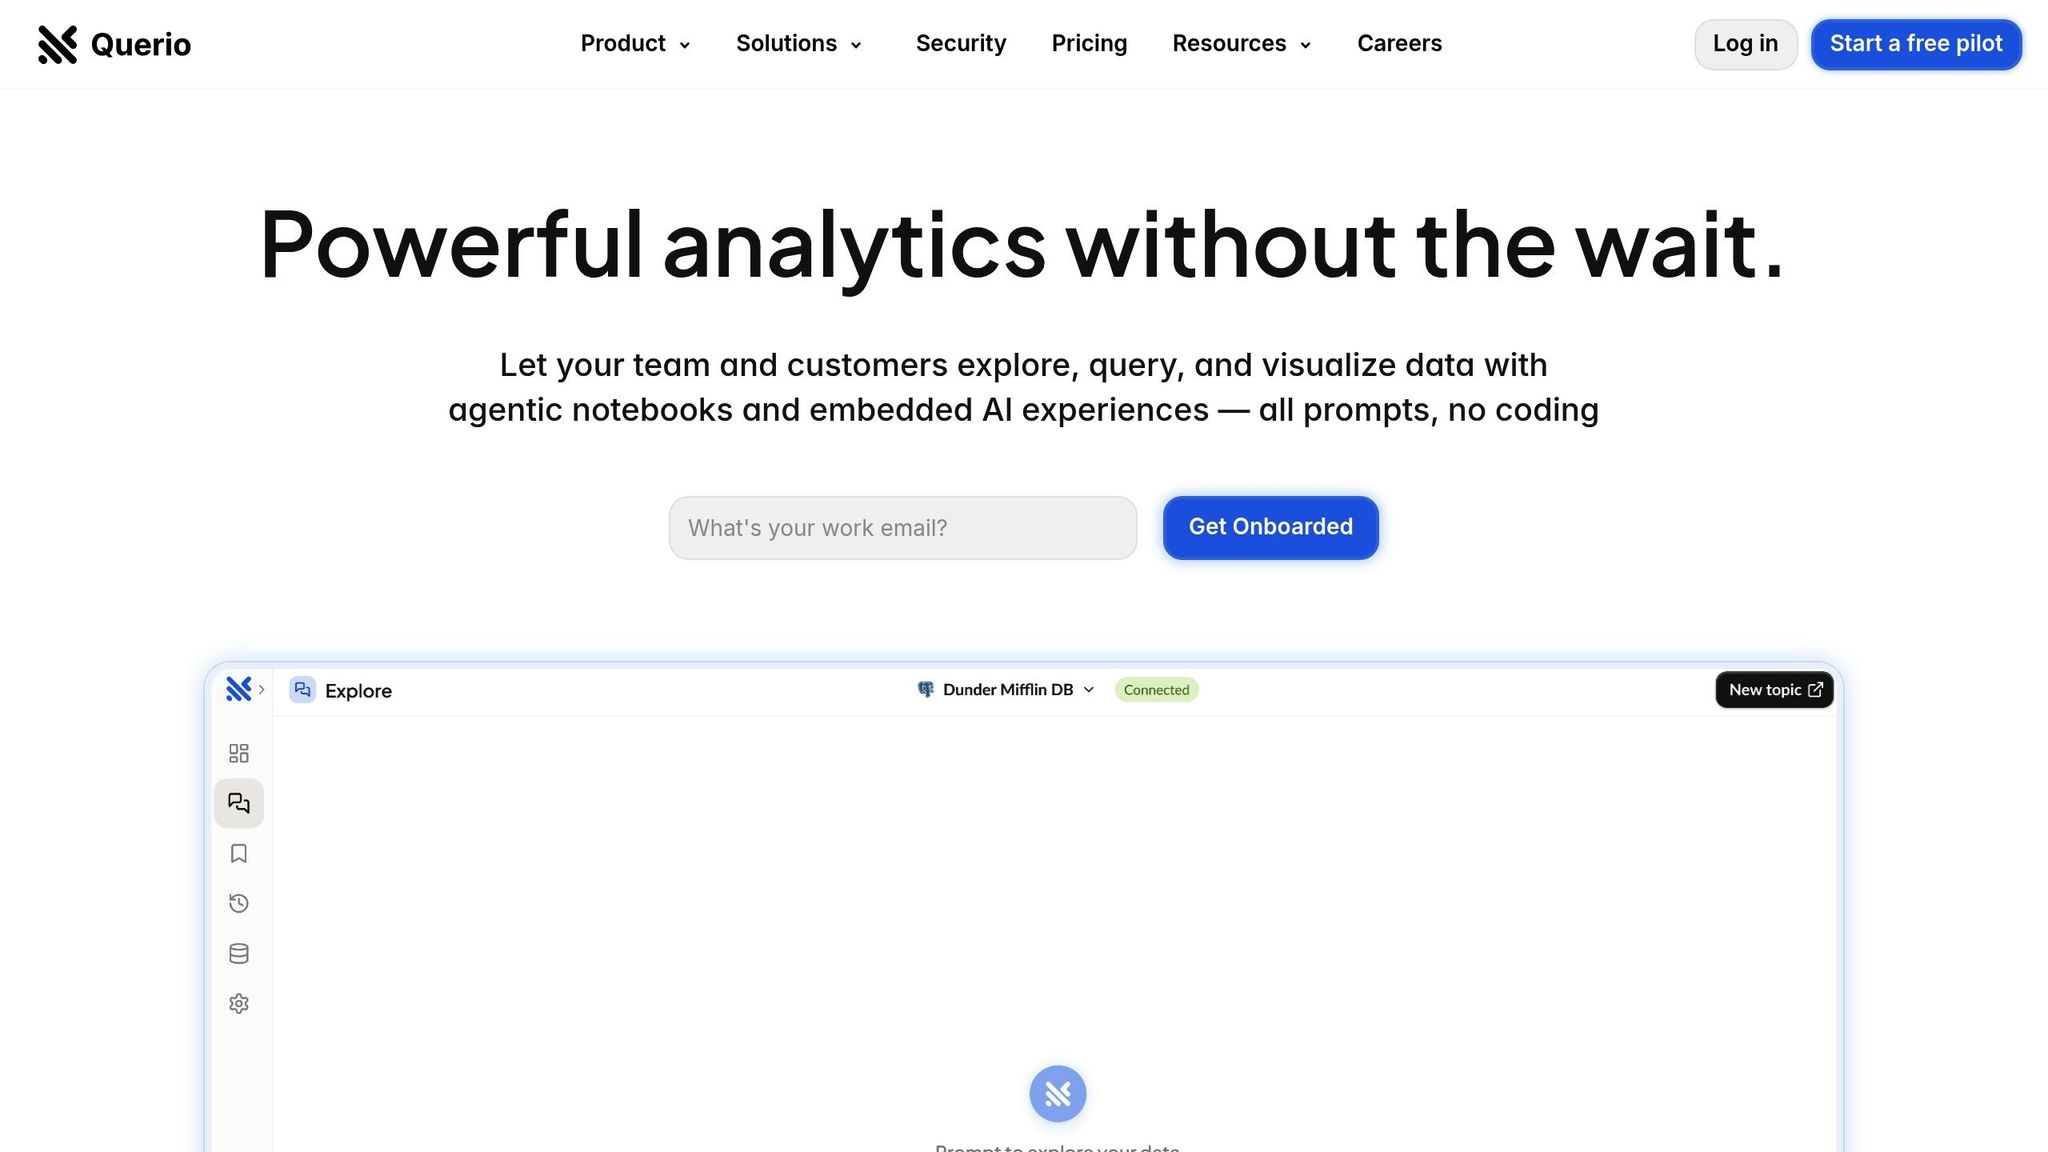
Querio is an AI-powered business intelligence workspace designed to let team members query live data using plain English. It connects seamlessly to major data warehouses like Snowflake, BigQuery, and Postgres without duplicating data, ensuring your information remains secure and current. Its standout feature? An AI agent that translates plain-English queries into SQL and instantly creates visualizations.
AI-driven Natural Language Querying
Querio’s AI engine makes data querying accessible by transforming plain-English questions - such as “What were our top-performing products last quarter?” - into SQL commands, delivering instant visual insights.
A context layer allows data teams to define table relationships, business metrics, and glossary terms just once, ensuring consistent data interpretation across the organization. This feature prevents the miscommunication that often arises when different teams use varying definitions for metrics.
With unlimited viewers and tiered access, Querio makes it cost-effective to share data insights across large teams. Additionally, it offers AI Python notebooks for advanced analysis, bridging the gap between quick insights and more detailed data science work.
Integration with U.S.-centric Data Sources
Querio ensures real-time data access through read-only, encrypted connections, keeping sensitive business data secure while enabling live analysis.
The platform also supports embedded analytics tools for SaaS, allowing businesses to integrate Querio’s intuitive data exploration tools directly into their products. This is especially useful for SaaS companies and enterprises looking to enhance their customer offerings with built-in data insights.
Visualization and Reporting Capabilities
Beyond querying, Querio simplifies reporting with drag-and-drop dashboards for tracking KPIs and creating compelling data stories. Its intelligent visualization engine suggests the best chart types for your data, while still giving users full control to customize and refine their reports. This balance of automation and user flexibility caters to both beginners and experienced professionals.
Pricing and Compliance for U.S. Businesses
Querio offers scalable pricing plans designed to meet varying needs, all while adhering to strict U.S. compliance standards, including SOC 2 Type II, HIPAA, and CCPA [1][2]. The platform secures data with read-only access, granular permissions, and regular external audits [1][5].
For privacy-conscious organizations, Querio guarantees that customer data is never used to train LLMs or AI models [1][5]. With 54.23% of its monthly visitors based in the United States, Querio has established a strong foothold in the American market [4].
Free Plan: Includes 25 monthly prompts, 1 seat, and 2 data sources.
Team Plan: Priced at $40 per seat/month, offering unlimited prompts and support for up to 50 seats.
Enterprise Plan: Custom pricing with dedicated support and API access [3].
Querio also guarantees a 99.9% uptime SLA, ensuring teams have reliable access to critical insights whenever they need them.
2. Tableau with AI Integrations

Tableau stands out as a go-to analytics platform, now enhanced with AI tools that make data exploration more accessible. With its natural language capabilities, users can ask questions in plain English and receive instant visual insights - no need for advanced technical expertise. Let’s dive into how AI is transforming data analytics through Tableau’s specialized features.
AI-driven Natural Language Querying
Tableau’s Ask Data feature transforms how users interact with data. Instead of crafting complex formulas, users can type straightforward questions like, "What are our sales trends by region this year?" The platform then instantly generates visualizations that answer the query. Another standout tool, Explain Data, goes a step further. It analyzes patterns to shed light on unusual data points, helping users understand potential causes behind anomalies.
Integration with U.S.-centric Data Sources
Tableau seamlessly connects to a wide range of data sources frequently used by U.S. businesses, including real-time links to enterprise data warehouses. This ensures analysts can work with up-to-date information. It also recognizes standard U.S. conventions, such as currency symbols and date formats, and uses machine learning to improve data accuracy - all while adhering to compliance standards.
Visualization and Reporting Capabilities
Creating compelling visuals is a breeze with Tableau’s Show Me feature. This AI-powered tool suggests the best chart or map type based on the data you’re working with, helping users present information clearly and effectively. The platform also automates tasks like generating visualizations, recommending calculated fields, and applying filters or formatting, making the entire process more intuitive.
Pricing and Deployment
Tableau provides a range of pricing and deployment options, allowing businesses to choose what best suits their needs. Whether you’re a small team or a large enterprise, there’s flexibility to match your requirements.
3. Microsoft Power BI Copilot
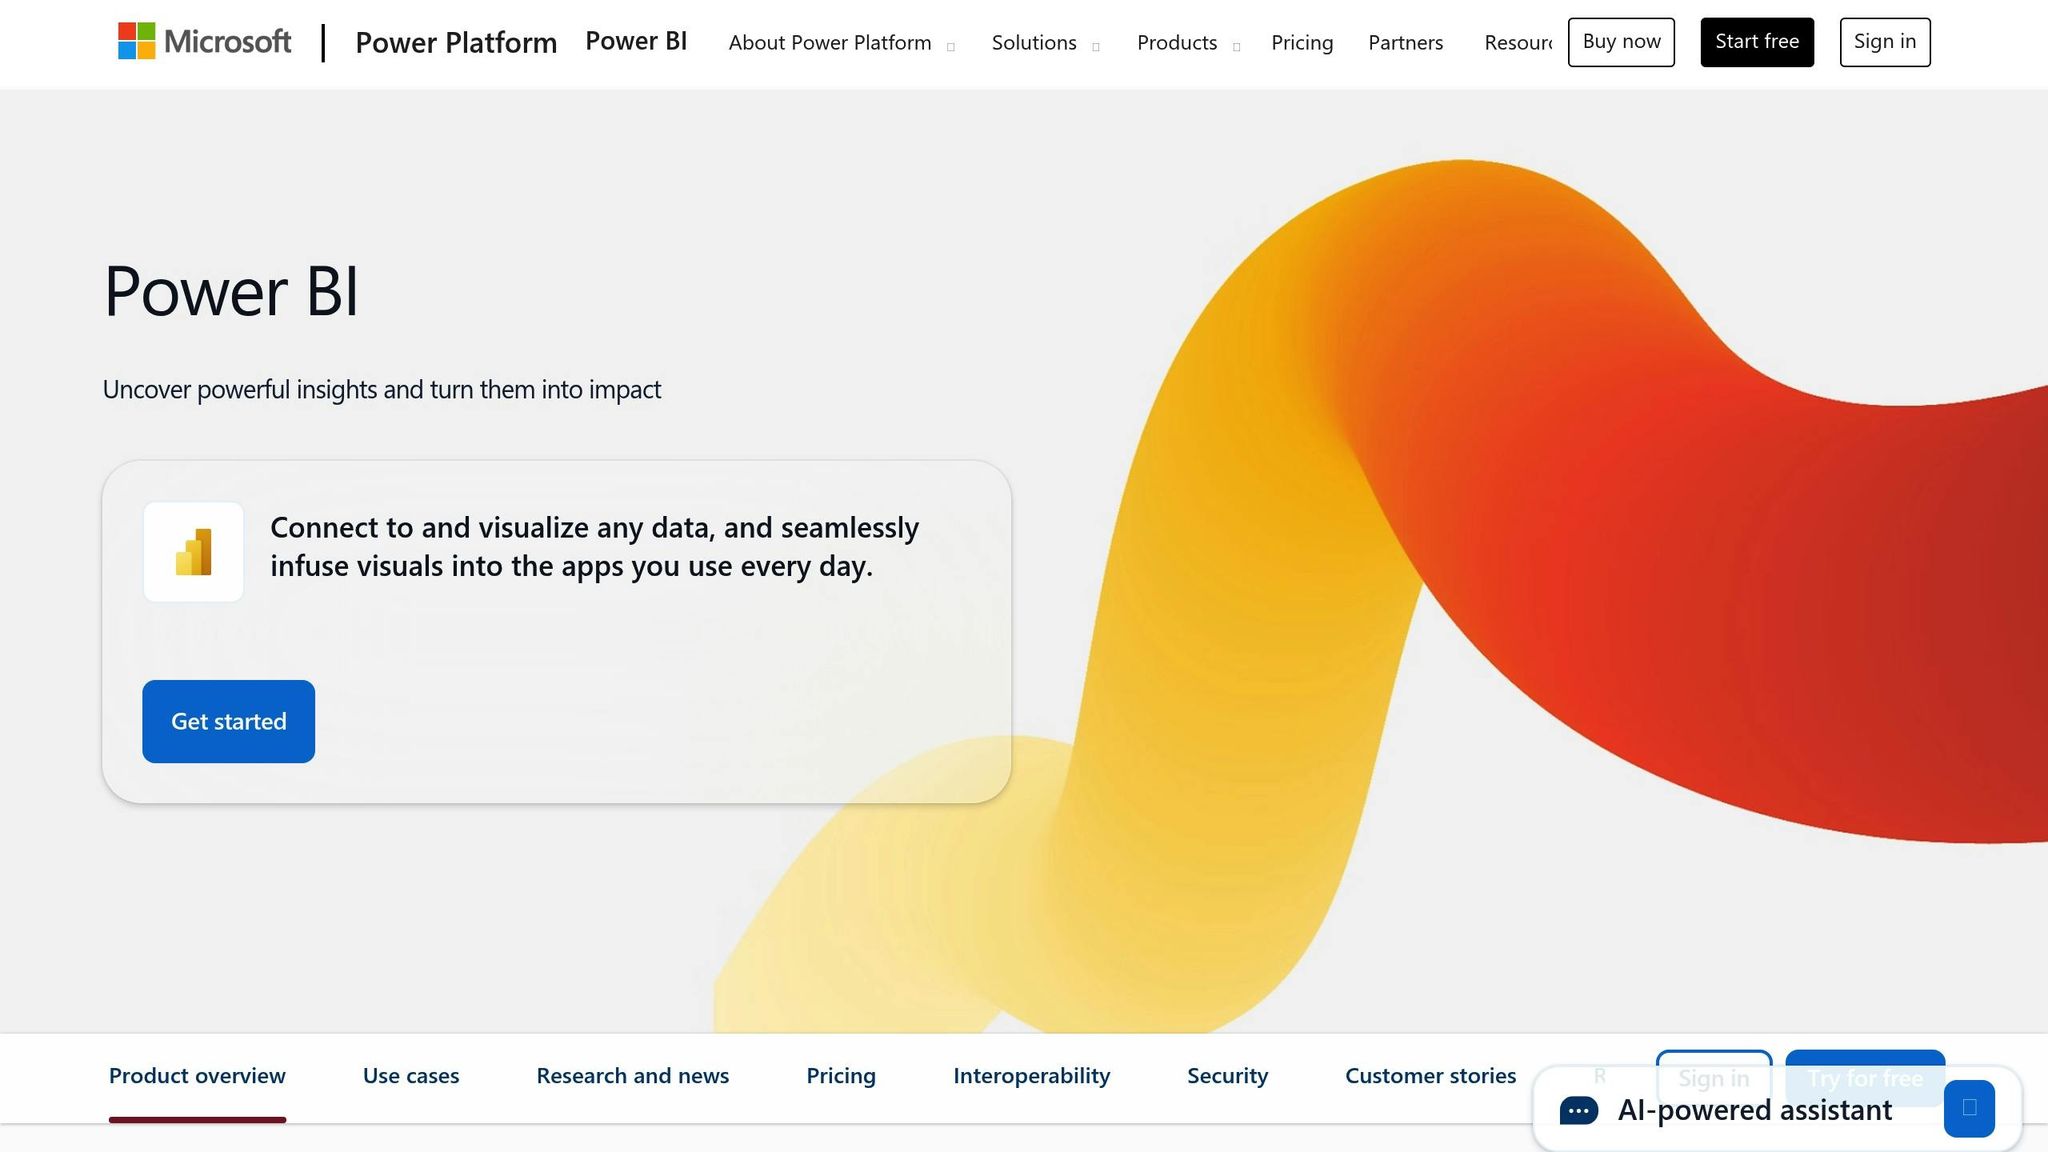
Microsoft Power BI Copilot brings conversational AI into the mix, making it easier for business users to uncover insights without needing technical know-how. This AI assistant changes the way teams work with data by allowing natural language interactions and simplifying complex analytical tasks. One standout feature is its ability to handle natural language queries, which we'll dive into below.
AI-driven Natural Language Querying
With Power BI Copilot, you can interact with your data in plain English. For example, you could type, "Which products had the highest profit margins last quarter?" and instantly get a visualization. But it doesn’t stop there - Copilot also suggests follow-up questions to help you dig deeper into patterns and trends you might not have noticed.
Integration with U.S.-centric Data Sources
Power BI Copilot connects seamlessly to the tools and data sources that are essential for U.S. businesses. It works effortlessly with Microsoft's ecosystem, including Excel, SharePoint, SQL Server, and Azure, and supports formats commonly used in the U.S., such as currency symbols, MM/DD/YYYY date formats, and comma-separated numbers. Plus, it offers real-time data connections to critical business applications, ensuring your insights are always current.
Visualization and Reporting Capabilities
Copilot doesn’t just crunch numbers; it helps you present them effectively. It automatically generates dashboards tailored to your business goals, recommends the best chart types for your data, and even creates narrative summaries to highlight key insights. With built-in formatting that aligns with your organization’s branding, your reports will not only be clear and informative but also polished and professional.
Pricing and Compliance for U.S. Businesses
On top of its analytical features, Copilot is designed with U.S. businesses in mind when it comes to pricing and compliance. Available as part of Power BI Premium, it integrates smoothly with Microsoft 365. It’s also built to adhere to key U.S. compliance standards, ensuring sensitive data is handled responsibly and in line with regulatory requirements.
4. ThoughtSpot
ThoughtSpot transforms how organizations explore data with its AI-powered, search-driven analytics. By simplifying complex data analysis, it ensures everyone in a company - not just data experts - can access and understand insights effortlessly. Its search-first approach breaks down barriers, delivering instant answers without requiring specialized skills.
AI-driven Natural Language Querying
At the heart of ThoughtSpot lies its advanced natural language processing. This feature allows users to ask questions like, "What were our top-selling products in California during Q3?" and receive immediate, easy-to-understand visual answers. But it doesn’t stop there. The platform's SpotIQ feature actively works in the background, analyzing data to uncover hidden patterns, anomalies, and trends. These insights are presented in plain English, ensuring you not only get answers to your direct questions but also discover opportunities and issues you might not have even thought to investigate.
Seamless Integration with U.S.-based Systems
ThoughtSpot seamlessly connects with leading cloud data warehouses and traditional databases, making it adaptable to a variety of business environments. It’s tailored for U.S.-specific needs - displaying currency in dollars ($), dates in MM/DD/YYYY format, and numbers with proper comma separators.
For businesses requiring real-time insights, ThoughtSpot supports live connections to operational systems, ensuring your data is always up to date. Additionally, it offers hybrid deployment options, enabling organizations to keep sensitive information on-premises while leveraging the power of cloud analytics. This flexibility is especially important for U.S. companies navigating regulatory requirements.
Intuitive Visualization and Reporting
When it comes to presenting data, ThoughtSpot takes the guesswork out of choosing the right format. It automatically selects visualizations - such as bar charts, heat maps, or geographic graphs - based on the type of query. Users can compile these visuals into pinboards, which act as dynamic dashboards that update automatically as new data flows in.
Designed with mobility in mind, ThoughtSpot ensures dashboards look and perform just as well on smartphones and tablets. This makes it ideal for executives and field teams who need insights on the go. For formal reporting, the platform offers customizable templates that align with your organization’s branding, making it easy to prepare polished presentations or meet regulatory requirements.
Tailored Pricing and Compliance for U.S. Businesses
ThoughtSpot’s pricing is designed to accommodate various organizational needs, from small teams to enterprise-wide usage. It also includes robust governance features to help U.S. businesses stay compliant with regulations like SOX, HIPAA, and state-level data privacy laws.
Security is a top priority, with features like row-level security, column-specific permissions, and detailed audit trails to track user activity. The platform meets high security standards, holding SOC 2 Type II certification. It also offers deployment options that cater to the stringent requirements of industries such as healthcare, finance, and government agencies.
5. Qlik
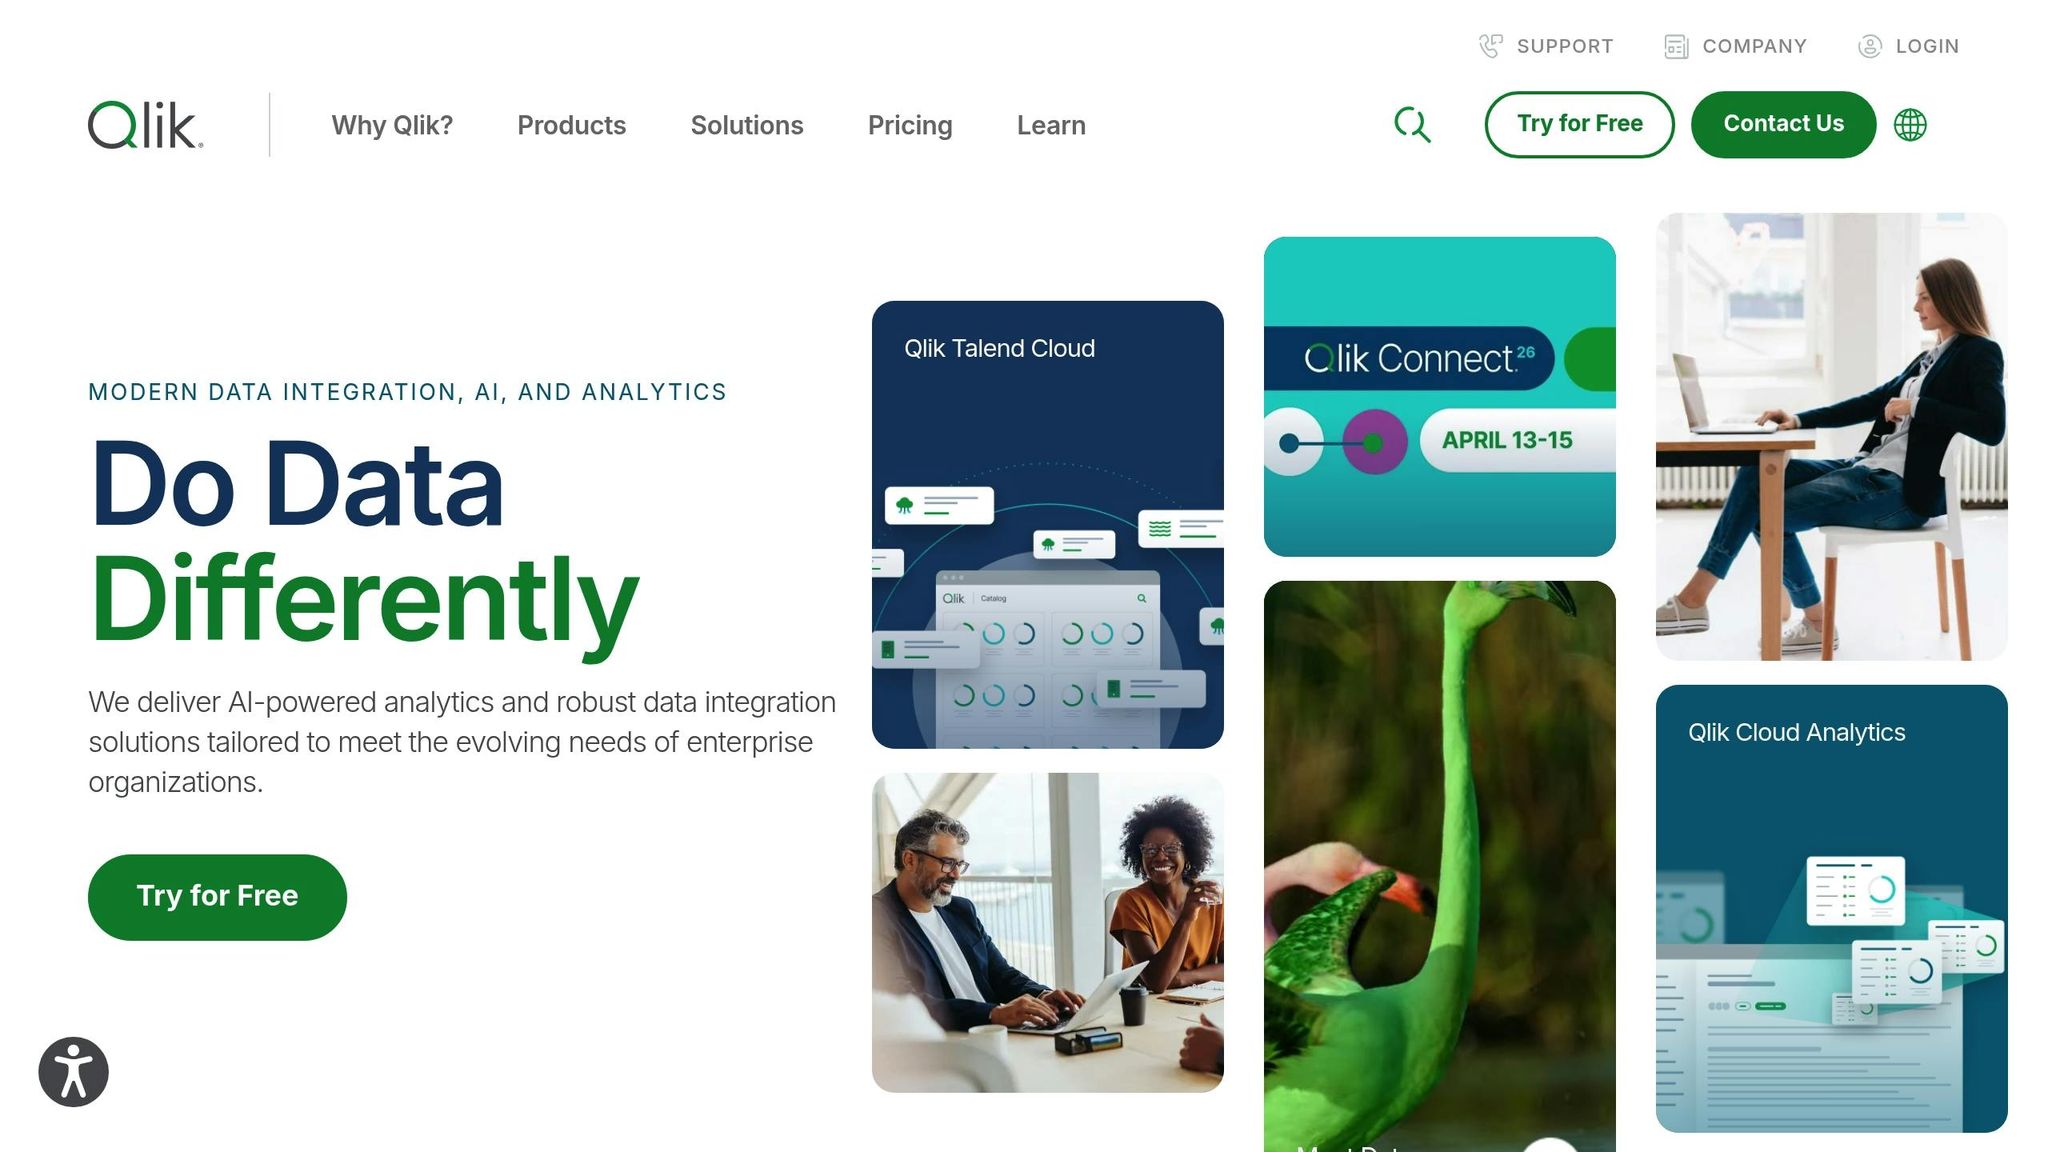
Qlik's associative analytics engine connects data points dynamically, allowing users to explore complex, multi-dimensional data quickly and efficiently. Its standout feature is the ability to maintain high performance while managing intricate datasets.
AI-driven Natural Language Querying
Qlik's Insight Advisor makes data interaction effortless by enabling users to ask plain-English questions and receive instant visual answers. For example, typing "show me sales trends by region" will not only generate a relevant chart but also suggest follow-up queries based on the data's context. This intuitive approach simplifies data exploration and helps users uncover deeper insights without needing advanced technical skills.
Integration with U.S.-centric Data Sources
Qlik is tailored to meet the diverse data needs of U.S. businesses. It offers native connectors for over 100 data sources, including widely-used platforms like Salesforce, ServiceNow, and Workday. The platform also supports real-time data streaming from IoT devices and operational systems, making it particularly valuable for industries like manufacturing and logistics.
For sectors such as financial services and healthcare, Qlik provides specialized connectors that comply with industry regulations. It even addresses challenges like time zone discrepancies, ensuring businesses with multiple locations can track operations accurately. With these integrations, Qlik turns raw data into actionable insights, helping organizations make informed decisions.
Visualization and Reporting Capabilities
Qlik's visualization engine is designed to adapt to user behavior and the nature of the data, automatically suggesting the most effective chart types for different scenarios. Dashboards are responsive, working seamlessly across devices, and users can create interactive stories that combine visuals with explanatory text and multimedia elements to present data-driven narratives.
Collaboration is a key feature, allowing teams to annotate charts, share insights, and develop a unified understanding of critical data points. For users with specific needs, Qlik's extensions marketplace offers additional customization options, including industry-specific visualizations. When it comes to executive reporting, the platform provides pixel-perfect formatting, meeting the high standards required for boardroom presentations and regulatory submissions.
Pricing and Compliance for U.S. Businesses
Qlik offers flexible pricing models based on user roles and deployment preferences, supporting both cloud-based and on-premises solutions to meet varying security needs. Built-in audit trails and governance features help organizations comply with regulations like SOX, GDPR, and HIPAA.
Security is a priority, with features like dynamic section access controls and SOC 2 Type II certification ensuring users only see data relevant to them. These capabilities make Qlik a reliable choice for government agencies and other highly regulated industries. For businesses adopting hybrid cloud strategies, Qlik's scalable licensing options provide cost predictability and adaptability as needs evolve.
6. IBM Watsonx
IBM Watsonx brings powerful AI-driven tools for data exploration, using advanced natural language processing and analytics to uncover insights from even the most complex datasets - all while maintaining strong security and compliance standards.
Tailored for U.S. Business Needs
Watsonx is built to integrate seamlessly with key enterprise systems like SAP, Oracle, and Microsoft SQL Server. This connectivity helps unify existing data infrastructures, making it easier for businesses to explore their data and make informed decisions.
Flexible Pricing and Regulatory Support
IBM Watsonx uses a consumption-based pricing model, letting businesses pay based on actual usage. It also adheres to industry-standard compliance requirements and offers flexible deployment options. These features make it a versatile choice for organizations aiming to align operational needs with regulatory demands, setting it apart for a detailed comparison with other leading platforms.
Feature and Price Comparison
When selecting AI-powered data tools, it's essential to evaluate features, pricing, and compliance to ensure they align with your business needs and how you use AI in data analytics. Each platform offers a unique set of capabilities, ranging from natural language querying tools to advanced visualization features.
Tool Name | Core AI Features | Data Source Support | Visualization Options | Pricing (USD) | Security/Compliance | Best For |
|---|---|---|---|---|---|---|
Querio | Natural language querying, AI-driven SQL generation, context layer with business definitions | Snowflake, BigQuery, Postgres (live connections) | Drag-and-drop dashboards, instant chart generation | $14,000/year (4,000 prompts/month, unlimited viewers) | SOC 2 Type II, 99.9% uptime SLA | Teams needing quick insights without SQL knowledge |
Tableau with AI | Ask Data feature, Explain Data insights, automated pattern detection | 100+ connectors including cloud databases, files, web services | Interactive dashboards, advanced charts, storytelling features | $75/user/month (Creator license) | SOC 2, GDPR, HIPAA compliance options | Organizations requiring sophisticated visualizations |
Microsoft Power BI Copilot | Natural language Q&A, automated insights, AI-powered data preparation | Azure services, Office 365, SQL Server, cloud platforms | Pre-built templates, custom visuals, mobile dashboards | $10/user/month (Pro), $20/user/month (Premium) | Microsoft security framework, ISO 27001 | Microsoft ecosystem users |
ThoughtSpot | Search-driven analytics, SpotIQ automated insights, natural language interface | Cloud data warehouses, traditional databases, files | Pinboards, liveboard sharing, embedded analytics | Custom pricing (typically $95-$125/user/month) | SOC 2, GDPR, industry-specific compliance | Self-service analytics teams |
Qlik | Associative AI engine, cognitive insights, AutoML capabilities | Multi-cloud support, real-time streaming, APIs | Interactive apps, storytelling, alerting system | $30/user/month (Standard), $70/user/month (Premium) | SOC 2, ISO 27001, GDPR | Complex data relationship analysis |
IBM Watsonx | Natural language processing, AutoAI model building, explainable AI | Enterprise systems (SAP, Oracle), cloud platforms | Embedded dashboards, notebook integration | Consumption-based pricing (varies by usage) | Enterprise-grade security, industry compliance | Large enterprises with complex requirements |
This table offers a snapshot of how these tools cater to different business priorities. Here's a quick breakdown of the key distinctions:
Pricing Models: Querio's flat annual rate of $14,000 is ideal for teams needing broad access without per-user fees. On the other hand, tools like Tableau and ThoughtSpot follow a per-user pricing model, which can become more expensive as your team scales. Power BI offers one of the most affordable options, starting at $10 per user per month.
Security and Compliance: IBM Watsonx and Tableau stand out with their extensive certifications, including GDPR and HIPAA, making them suitable for industries with strict compliance needs. Querio also ensures strong security with SOC 2 Type II certification and a 99.9% uptime SLA.
Data Connectivity: Querio focuses on live connections to popular cloud warehouses like Snowflake and BigQuery, avoiding the need for data duplication. Meanwhile, Power BI integrates seamlessly with Microsoft's ecosystem, and ThoughtSpot and Qlik provide a wide range of connectors for diverse data sources.
AI Features: Querio excels at delivering instant, natural language-driven visualizations, making it user-friendly for teams without technical expertise. Conversely, IBM Watsonx offers advanced machine learning capabilities, catering to enterprises requiring deeper analytical insights.
Ultimately, the right choice depends on whether your team values simplicity and speed or advanced analytics and scalability. Each tool brings its own strengths to the table, so align your selection with your business goals and technical requirements.
Conclusion
AI-powered data exploration tools are reshaping how businesses in the U.S. handle analytics and make decisions. By breaking down barriers to insights, these tools make data accessible to everyone, whether you're a marketing manager or a C-suite executive. This shift reflects the rapidly evolving demands of American businesses.
These platforms also tackle critical issues like compliance and security - top priorities for organizations in the U.S. Take Querio, for example: with its SOC 2 Type II compliance and a straightforward flat rate of $14,000, it offers a secure and budget-friendly way to explore data.
Another game-changer is the speed at which insights are now generated. With natural language querying, users can produce instant visualizations on demand. This kind of immediacy allows professionals to act on real-time data, leaving outdated reports in the dust.
FAQs
How do AI tools improve data security and ensure compliance for businesses?
AI-powered tools are transforming how businesses handle data security and compliance management. By automating essential tasks, these tools ensure strict access controls, monitor data usage, and maintain data lineage. This not only minimizes the chances of unauthorized access or accidental errors but also simplifies compliance reporting, making it easier for companies to meet regulatory demands.
On top of that, AI significantly improves threat detection. By analyzing massive datasets, it can spot patterns, detect anomalies, and pinpoint potential risks. This proactive approach enables businesses to quickly address emerging cyber threats, safeguarding sensitive information while staying aligned with industry regulations.
What should businesses look for when selecting AI tools for data exploration?
When picking AI tools for data exploration, it's important to focus on a few critical aspects to ensure the tool aligns with your business needs:
Capabilities: Does the tool offer advanced features like predictive analytics, anomaly detection, or natural language processing? These can help make your data analysis faster and more effective.
User-Friendliness: A tool with an intuitive interface ensures that even team members without technical expertise can navigate it and extract valuable insights.
Compatibility: Check if the tool integrates smoothly with your current systems and data sources to keep your workflows running efficiently.
Pricing: Review the cost structure carefully, including any extra fees for advanced features, to confirm it fits your budget.
The right tool can simplify the process of identifying trends and patterns, making it easier to make informed, data-driven decisions while reducing manual work.
How does natural language querying in AI tools make data analysis easier for non-technical users?
Natural language querying in AI tools transforms the way we analyze data by letting users interact with it using simple, everyday language. This removes the need for technical skills or coding knowledge, making data exploration accessible to everyone, not just data experts.
For instance, users can ask questions like, "Which regions had the highest sales last quarter?" or "What’s the trend in customer growth over the past year?" and get precise, actionable answers. This easy-to-use feature not only speeds up the process but also enables more professionals to confidently base their decisions on data insights.
Related Blog Posts


