Business Intelligence
text to dashboard AI tool
Transform your data analysis with text-to-dashboard AI tools that simplify complex queries into real-time visual insights for businesses.
Text-to-dashboard AI tools let you turn plain English questions into interactive dashboards instantly. Instead of writing complex queries or waiting for reports, you can ask questions like, "What were our Q3 2025 sales?" and get real-time visual insights. These tools combine natural language processing (NLP) with data visualization, making data analysis faster and more accessible for businesses.
Key Highlights:
What It Does:Converts text-based queries into visual dashboards (e.g., charts, tables).
How It Works: Uses NLP to interpret your query, connects to live data sources, runs calculations, and creates visualizations.
Who Benefits: Teams in marketing, sales, finance, and operations who need quick insights without technical skills.
Why It Matters: Saves time, reduces reliance on IT, and helps businesses make faster decisions.
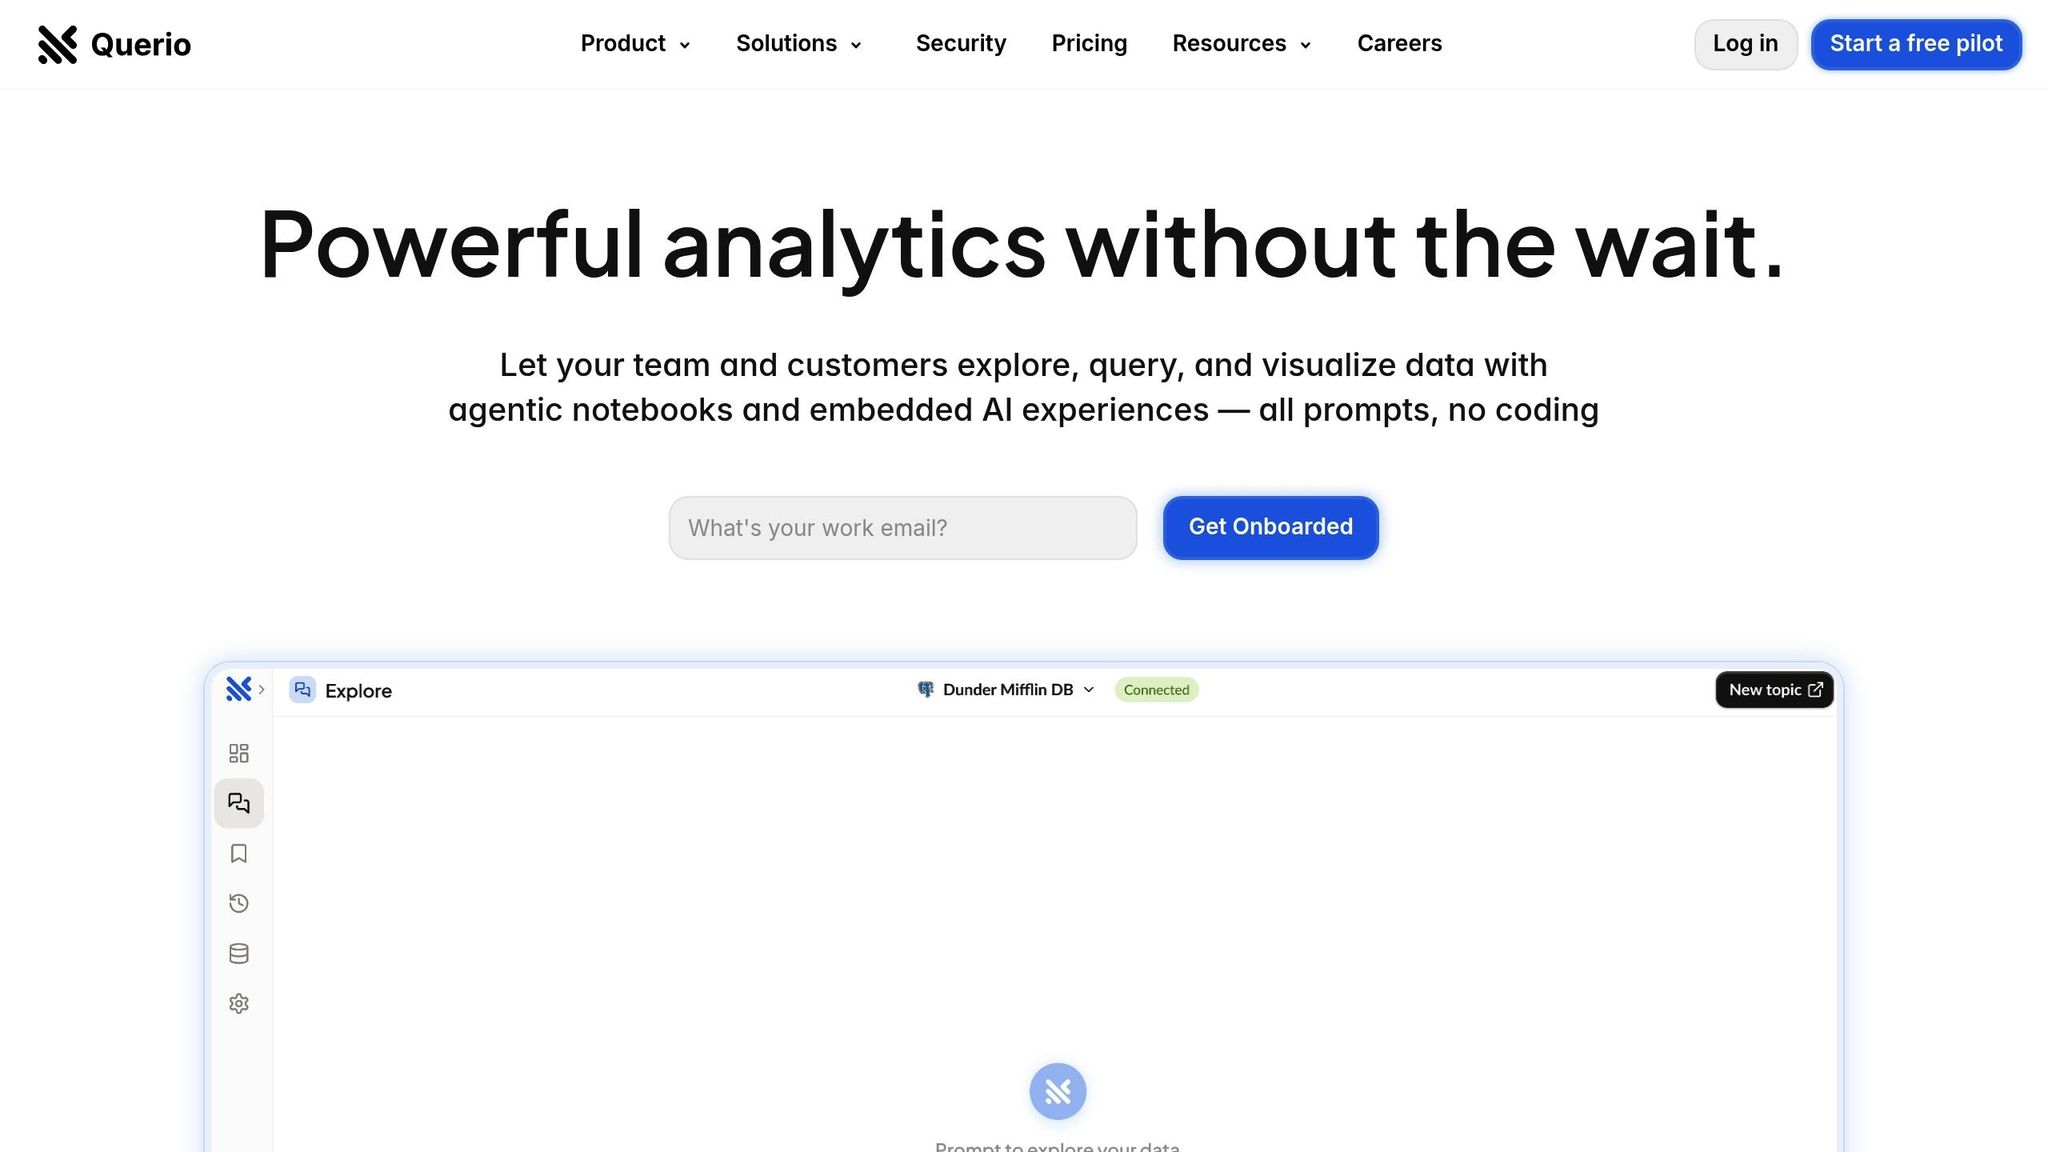
Example Tool: Querio
Pricing: Starts at $14,000/year for one database connection, unlimited viewers.
Features: Live data connections, SOC 2 compliance, drag-and-drop dashboards, and scalable pricing.
These tools are especially useful for U.S. businesses dealing with large datasets, compliance requirements, and a shortage of data professionals. However, success depends on clean data, clear governance, and user training.
Create Dashboards in Seconds With AI (It's Mind-Blowing 🤩)
How Text-to-Dashboard AI Tools Work
These tools transform plain text queries into interactive dashboards by combining advanced technology with the ability to interpret human language and translate it into data visualizations.
From Query to Dashboard: The Process
Turning your text into a fully functional dashboard involves a four-step process. For example, if you type, "Show me our customer retention rates by region for the last six months", the AI gets to work immediately.
Analyzing the query: The system breaks down your request, identifying key elements like metrics, dimensions, and filters. It understands business-specific terms and context without requiring manual mapping of fields.
Linking data: The AI identifies the relevant data sources for your query. For instance, it might pull customer data from Salesforce and transaction data from PostgreSQL, seamlessly connecting to the right databases.
Query generation and execution: The system writes SQL queries, merges data from multiple sources if needed, and calculates the requested metrics.
Creating visualizations: Once the data is processed, the AI designs visualizations tailored to the query. For example, retention rates might appear as a line chart showing trends, paired with bar charts or maps for regional breakdowns.
The Role of NLP and AI
Natural language processing (NLP) is the backbone of these tools, enabling them to grasp the context, intent, and relationships in your queries. Modern platforms use transformer-based language models trained specifically for business and data analysis.
These systems adapt to your organization's unique terminology. For instance, if your company uses "CAC" for customer acquisition cost or "MRR" for monthly recurring revenue, the AI learns these terms, making it easier for you to interact without needing to memorize database structures.
The AI's semantic understanding allows it to handle even complex requests. For example, a query like "Compare our top-performing products in the Northeast versus the Southwest, excluding returns" involves identifying products, defining performance metrics, applying geographic filters, and excluding specific transaction types - all from one sentence.
This combination of NLP and adaptive learning ensures the platform provides accurate, actionable insights while maintaining secure and compliant data practices.
Security and Compliance Features
Efficiency aside, these tools also prioritize security and compliance to protect sensitive data. All data connections use encrypted protocols, and role-based access controls ensure users only access information they're authorized to see.
For US-based organizations, compliance with standards like SOC 2 Type II demonstrates adherence to rigorous security practices. These include data encryption, access logging, and incident response measures.
The system doesn’t store copies of your data on external servers. Instead, it uses live data connections to directly query your databases, ensuring dashboards reflect up-to-date information while reducing compliance risks.
Audit trails track every query and dashboard, supporting regulatory requirements. Additionally, data governance tools let administrators set limits on queries, restrict access to sensitive information, and monitor usage across the organization, providing an extra layer of control and transparency.
Key Features and Benefits of Querio's Platform
Querio transforms how businesses interact with data by combining natural language processing (NLP), secure live data connections, and centralized governance.
Core Features of Querio
Querio eliminates the need for complex SQL queries by allowing users to ask questions in plain English, like, "What's our customer churn rate in California this quarter?" The platform instantly delivers visual insights, making data exploration more intuitive. With the core plan, teams can process over 4,000 prompts per month, ensuring they can dive into data without worrying about hitting usage limits.
The platform's live data connections are its backbone, securely linking to databases like Snowflake, BigQuery, and PostgreSQL using read-only, encrypted credentials. Querio’s context layer enables data teams to define business terms, table joins, and glossaries once, ensuring consistent governance across the organization. For example, if finance defines "monthly recurring revenue" to exclude one-time fees, this definition is applied universally across dashboards.
With data visualisation dashboards, users can create KPI trackers and data stories without needing technical expertise. These dashboards automatically update as the underlying data changes, giving stakeholders access to the latest information and enabling faster, more informed business decisions.
Benefits for US Businesses
Querio's features translate into clear advantages for businesses in the United States. The platform speeds up time-to-insights, allowing marketing managers to create campaign performance reports in just minutes - especially valuable for industries like e-commerce and SaaS, where agility is key.
By empowering business users to answer their own data questions, Querio reduces reliance on data teams. This frees up data professionals to focus on more strategic projects. With SOC 2 Type II certification and a 99.9% uptime SLA, businesses can count on Querio to deliver critical insights securely and reliably. The platform’s pricing, starting at $14,000 per year for one database connection, also provides predictable costs, making budget management easier.
Data Governance and Scalability
Querio’s design ensures scalability as your data needs evolve. The context layer keeps business definitions consistent, even as teams grow and new users join, maintaining clarity across departments.
Unlimited viewer access supports collaboration without additional per-user fees. Sales teams can share performance dashboards with regional managers, while finance teams can distribute budget reports to department heads, ensuring everyone has access to the insights they need.
Querio’s pricing structure grows with your business. Start with one data warehouse and add more connections for $4,000 each per year as your architecture expands. Additional features, like the $6,000 annual dashboards add-on or the $10,000 data pipelines subscription (covering up to three pipelines), allow companies to customize the platform to their needs without paying for unused functionality. This flexibility ensures businesses can scale their data operations efficiently and cost-effectively.
Practical Use Cases for US Organizations
Querio's text-to-dashboard capability is reshaping how US businesses handle sales, customer analysis, and financial tracking. By turning complex data questions into clear, visual insights within seconds, this tool empowers teams to make quicker decisions without relying on technical support.
Sales Performance Dashboards
Sales teams can quickly build performance dashboards by asking simple, natural language questions. For instance, a regional sales manager might type, "Show me Q4 revenue by territory compared to last year's performance," and instantly see an interactive chart that highlights current results alongside historical trends. Sales directors can track metrics like monthly recurring revenue, customer acquisition costs, and pipeline velocity - all through straightforward queries. Territory managers can go a step further, using drag-and-drop tools to create custom views that display individual rep performance, deal sizes, and conversion rates. This seamless process allows teams to make decisions faster, powered by real-time visualizations.
Customer Trend Analytics
Understanding customer behavior becomes effortless with text-to-dashboard tools. A question like, "What's our customer churn rate in California this quarter?" delivers immediate, actionable visuals. These tools use natural language processing (NLP) uses to transform raw data into insights [1]. They also enable real-time monitoring of customer metrics such as Net Promoter Scores (NPS), Customer Satisfaction Scores (CSAT), and Customer Effort Scores (CES), with dashboards that update dynamically as new survey data comes in [2]. By analyzing customer reviews, support tickets, and social media mentions, Querio creates dashboards that track retention, product adoption, and lifetime value. Marketing teams can quickly spot shifts in customer preferences and adjust campaigns, while product managers can identify and resolve pain points affecting user experience. This makes decision-making faster and more informed.
Financial and Operations Tracking
Finance teams can craft detailed dashboards with simple queries about cash flow, expenses, and profitability. For example, a CFO might ask, "Show me gross margin trends by product line over the past 18 months," and instantly identify which products are the most profitable. Operations managers can monitor metrics like inventory levels, supply chain performance, and production efficiency through dashboards that sync with ERP systems and warehouse platforms. Budget tracking becomes more collaborative when department heads can access spending dashboards, allowing for seamless sharing of monthly budget reports and expense analyses. Operations dashboards also provide real-time metrics, such as order fulfillment rates, shipping costs, and vendor performance, helping supply chain managers quickly address bottlenecks and adjust procurement strategies based on inventory levels and demand forecasts. All of this is achieved through natural language queries, eliminating the need for technical expertise.
Pros and Cons of Text-to-Dashboard AI Tools
Weighing the advantages and challenges of text-to-dashboard AI tools is essential for businesses considering their implementation. These tools bring significant perks but also require thoughtful preparation. Below, we explore both the benefits and challenges of self-service analytics for adopting these platforms.
Benefits
Text-to-dashboard AI tools offer several standout advantages:
Speed and Accessibility transform how teams interact with data. Instead of waiting days for IT support, employees can instantly create dashboards using natural language queries. This makes data insights more accessible, allowing, for example, marketing managers to monitor campaign performance or finance directors to pull quarterly reports - without needing technical expertise.
Cost Efficiency is another major draw. Traditional business intelligence setups often require expensive analysts or extensive training programs. In contrast, these tools enable existing staff to produce advanced visualizations. For instance, Querio’s pricing at $14,000 per year for unlimited viewers provides enterprise-level analytics to mid-sized companies that might not have had the budget for traditional BI solutions.
Real-Time Decision Making becomes a reality with live data connections to platforms like Snowflake, BigQuery, and Postgres. Sales teams can adjust strategies based on real-time pipeline data, while operations managers can address supply chain issues immediately by accessing up-to-date inventory and vendor metrics.
Reduced Technical Dependency frees up IT teams to focus on strategic initiatives rather than routine reporting tasks. This shift can lead to faster innovation and more agile responses to business challenges.
Things to Consider Before Implementation
Despite their benefits, these tools come with some challenges that businesses must address:
Data Governance Requirements are critical. While natural language queries make data access easier, organizations need clear rules about who can access specific datasets. Defining data ownership, setting approval workflows for sensitive information, and standardizing business definitions are all essential steps to ensure consistent and secure data use.
User Training and Adoption can be hurdles. Employees accustomed to traditional reporting methods may resist new workflows. Successful rollouts often require comprehensive training, internal champions to promote the platform, and transparent communication about the benefits of self-service analytics.
Data Quality Dependencies are another consideration. These tools rely on clean, structured data for accurate insights. If an organization struggles with inconsistent formats, duplicate records, or incomplete datasets, investing in data cleanup may be necessary before reaping the full benefits.
Security and Compliance Considerations become increasingly important as data access expands. Companies must maintain strict security protocols to ensure compliance with industry regulations and internal policies while enabling broader data accessibility.
Comparison Table: Pros and Cons
Advantages | Considerations |
|---|---|
Dashboards generated in seconds instead of days | Requires investment in data governance and user training |
Unlimited viewers at $14,000/year lowers per-user costs | Poor data quality can lead to inaccurate insights |
Natural language queries eliminate the need for SQL skills | Change management is essential to overcome resistance |
Real-time data connections enable faster decisions | Security protocols must adapt to broader data access |
Reduces IT bottlenecks, allowing focus on strategic projects | Initial setup involves defining business contexts and relationships |
99.9% uptime ensures reliable access to critical data | Complex data structures may require extra customization |
While the benefits of text-to-dashboard AI tools are clear, they come with challenges that require careful planning. Successful adoption depends on an organization’s ability to balance the convenience of self-service analytics with robust governance, security, and training measures.
Conclusion and Key Takeaways
Text-to-dashboard AI tools are reshaping how US businesses approach business intelligence. By breaking down traditional barriers, these platforms make complex data accessible to every team member, turning what was once a specialized skill into a practical tool for everyday decision-making.
Why Choose Querio for Your Business Intelligence Needs?
Querio stands out as a top choice among self-service analytics tools. Its AI-powered interface allows users to ask questions in plain English and instantly receive accurate visualizations - no SQL knowledge or technical expertise required.
With live connections to major data warehouses, Querio delivers real-time insights. Unlike older BI tools that rely on data copies, Querio provides read-only, encrypted connections, ensuring your data remains secure while staying instantly accessible.
For businesses with strict compliance requirements, Querio’s governance features are a game-changer. Data teams can define context layers, business rules, and access controls once and apply them consistently across the organization. This balance of security and accessibility ensures compliance while empowering employees to explore data confidently.
At just $14,000 per year for unlimited viewers, Querio eliminates per-user fees, making enterprise analytics scalable and cost-effective. This pricing model democratizes data access, enabling organizations to modernize their BI strategies without breaking the bank.
With industry-leading security standards and 99.9% uptime, Querio ensures your data is protected and always available. These features allow businesses to act quickly and decisively, leveraging insights to stay ahead in competitive markets.
Key Points to Remember
Querio’s features drive a significant shift from traditional reporting to natural language analytics, delivering clear advantages. Speed becomes a competitive edge when dashboards are created in seconds, enabling faster reactions to market trends and customer demands.
Self-service analytics eliminates IT bottlenecks, empowering teams across departments. Marketing managers can analyze campaign data, finance directors can monitor key metrics, and operations teams can optimize supply chain performance - all without waiting for technical assistance.
The importance of governance and live data access cannot be overstated. To fully leverage these tools, organizations must implement clear data policies, maintain high-quality standards, and provide user training. These steps ensure employees can confidently use the platform while meeting compliance requirements.
Text-to-dashboard AI tools are more than just a technological upgrade - they represent a shift toward empowering employees with the tools to make informed, data-driven decisions. Querio makes this transformation possible by delivering insights that are accessible to everyone, exactly when they’re needed.
For US businesses looking to modernize their business intelligence, Querio offers a clear path forward. Combining natural language processing, real-time data, and enterprise-grade governance, these tools enable faster, smarter, and more competitive decision-making across industries.
FAQs
How does Querio protect data and ensure compliance when connecting to live data sources?
Querio prioritizes the security and privacy of your data by employing strong protections to keep your information safe. All connections to live data sources use encryption protocols that meet recognized industry standards, ensuring your data is transmitted securely.
On top of that, Querio complies with key regulations like GDPR and CCPA, which means your data is managed with care and transparency. To keep security measures sharp, the company performs regular audits and continuous monitoring, maintaining rigorous standards across all its operations.
What should teams do to prepare for using text-to-dashboard AI tools like Querio?
To dive into text-to-dashboard AI tools like Querio, it’s useful for teams to grasp some basic concepts around AI-driven data visualization. Start by getting familiar with terms like Natural Language Querying (NLQ) and Natural Language Generation (NLG) - these are the engines that power how these tools interpret and present data.
Try creating simple dashboards to see how your queries transform into visual insights. Don’t worry if it feels tricky at first; crafting effective text prompts often involves some trial and error. Taking an iterative approach can help you fine-tune your results. The best part? These tools are built to be user-friendly, so you don’t need extensive training to make the most of them. They’re designed to streamline workflows and make data insights accessible to everyone.
Can Querio process complex queries involving multiple data sources and industry-specific terminology?
Querio is built to tackle intricate queries, seamlessly drawing data from various sources while understanding specialized business terminology. Its AI-driven technology can process plain text inputs, even when they involve complex data relationships or industry-specific language, and turn them into dynamic, interactive dashboards.
This means businesses can quickly uncover insights - whether it's tracking sales trends, studying customer behavior, or evaluating other key metrics - without needing advanced technical skills. Querio streamlines the process, making self-service analytics straightforward and effective for decision-makers.
Related Blog Posts


