Business Intelligence
7 Best AI-Powered Data Analysis Tools for Non-Technical Users in 2026
AI tools let non-technical teams query live warehouses in natural language with governed, transparent analytics—pick by stack and governance.
In 2026, AI-powered data analysis tools make it easier for non-technical users to extract insights directly from live data without needing SQL or coding skills. The best tools for this are Querio, ThoughtSpot, Microsoft Power BI with Copilot, Tableau with Tableau Pulse, Google Looker, Hex, and Tellius. These platforms focus on natural language querying, live data connections, and governance to ensure accurate and reliable insights. However, each tool has its strengths and limitations, depending on your team’s needs and technical expertise.
Quick Overview:
Querio: AI-driven analytics with inspectable SQL and Python, ideal for transparency and governance.
ThoughtSpot: Search-first interface for fast insights, works best with clean data models.
Microsoft Power BI with Copilot: Integrated with Microsoft 365, supports plain-English prompts for creating reports.
Tableau with Tableau Pulse: Automates KPI tracking and summaries, focused on executive dashboards.
Google Looker: Centralized LookML for consistent metrics, requires data engineering expertise.
Hex: Combines SQL, Python, and AI in notebooks; better for technical teams.
Tellius: Simple search bar for "why" analysis, uncovering root causes of data trends.
Quick Comparison
Tool | NLQ Style | Governance Features | Live Data Connection | Best For |
|---|---|---|---|---|
Querio | Conversational AI with SQL/Python transparency | Centralized context layer, RBAC | Teams needing governed self-serve analytics | |
ThoughtSpot | Google-like search bar | Row/object-level security | Snowflake, BigQuery, Redshift | Search-first data exploration |
Power BI with Copilot | Generative AI for DAX-based queries | RLS/OLS, Microsoft ecosystem | Azure Synapse, Snowflake | Microsoft 365 users |
Tableau Pulse | Automated KPI summaries | Role-based permissions, PII masking | Snowflake, BigQuery, Redshift | Executive dashboards |
Google Looker | LookML-powered conversational queries | Centralized LookML, row-level security | BigQuery, Snowflake, Redshift | Teams with dedicated data engineers |
Hex | AI-assisted SQL/Python in notebooks | Shared context layer | Snowflake, BigQuery, Redshift | Technical teams using notebooks |
Tellius | Search bar for "why" questions | Role-based access, audit logs | Snowflake, BigQuery, Redshift | Business teams analyzing trends |
Each tool offers unique benefits based on your goals. For transparency and governed analytics, Querio stands out. ThoughtSpot and Tellius are great for intuitive, question-based exploration. Power BI and Tableau integrate well with Microsoft and Salesforce ecosystems, respectively. Hex is suited for code-driven workflows, while Looker excels in centralized metric consistency. Choose based on your tech stack, governance needs, and user expertise.

7 Best AI Data Analysis Tools for Non-Technical Users (2026)
1. Querio

Querio is an analytics workspace built with AI at its core, designed for teams that need quick, precise answers from live warehouse data - without the hassle of writing SQL. It integrates directly with data warehouses like Snowflake, BigQuery, Amazon Redshift, and ClickHouse, ensuring that all insights are drawn from live data.
What sets Querio apart is its inspectable output. When a non-technical user asks a question in plain English, Querio generates actual SQL or Python code in the background - and shows it. This level of transparency allows data teams to review, tweak, and approve the generated logic before it’s shared across the organization. By doing so, Querio supports a collaborative and governed analytics environment.
"Finally an AI BI tool that doesn't feel like a black box. Being able to see and edit the SQL it generates is huge for building trust with our engineering team." - Neelam C., Product Hunt [1]
Querio also features a governed context layer, where key business definitions - like how ARR is calculated or what qualifies as an active user - are standardized. These definitions are applied consistently across all queries, ensuring that even non-technical users produce accurate and reliable analytics. This consistency is essential for maintaining trustworthy insights, particularly for B2B SaaS companies.
In addition to standardized metrics, Querio offers tools for dynamic collaboration. Its reactive notebooks automatically update SQL or Python cells as logic changes, and analysts can verify dashboards to indicate that the underlying logic has been reviewed and approved. Users report cutting ad-hoc reporting time by up to 80% [1], and the platform has earned an 8.88/10 rating on Tooliverse from 65 verified reviews [1].
Querio’s pricing starts at $680/month (billed annually) for the Startup plan, which includes 1 Postgres connection and 15 users. For larger teams, the Core plan costs $1,699/month and offers 3 data connections along with unlimited users [1]. These features make Querio a solid choice for teams looking for accessible and governed analytics solutions.
2. ThoughtSpot
ThoughtSpot takes a search-first approach to analytics, making data exploration feel as simple as typing into a Google search bar. Instead of building dashboards or writing complex queries, users can ask questions in plain English, and the platform instantly translates those into actionable data insights. Thanks to its Embrace feature, ThoughtSpot connects directly to live cloud warehouses like Snowflake, BigQuery, and Amazon Redshift, ensuring users work with up-to-date data. This live connectivity is further enhanced with AI-driven insights, making the platform both intuitive and powerful.
A key part of the experience is ThoughtSpot's AI assistant, Spotter. The latest version, Spotter 3, takes things up a notch by offering analyst-grade reasoning. It even provides a verifiable query plan, so users can trace exactly how the platform arrived at its answers. This level of transparency is critical for data teams, especially when non-technical users rely on these insights to make important decisions.
"The search works when your data model is clean... Without that foundation, users get frustrated by queries that return unexpected results." - Summer Lambert, Content Specialist, Zerve
This quote underscores a crucial point: ThoughtSpot's natural language query (NLQ) capabilities, which are rated 4.6/5, shine brightest when paired with a well-structured and consistently named data model. Without that foundation, users may encounter unexpected or inaccurate results, leading to frustration.
On the governance front, ThoughtSpot offers robust features like row-, column-, and object-level access controls. It inherits security settings directly from connected warehouses and ensures metadata stays private when passing queries to its language model. For organizations with strict compliance needs, ThoughtSpot provides flexibility with both cloud-hosted and self-managed deployment options.
However, pricing can be a sticking point. The platform uses a combination of user-based fees, consumption-based costs, and enterprise agreements. While this flexible model can suit various needs, users often highlight concerns about costs escalating as query volumes grow, particularly with live warehouse compute.
3. Microsoft Power BI with Copilot

Microsoft Power BI with Copilot takes user-friendly AI analytics to the next level, offering an intuitive experience for non-technical users. For organizations already using Microsoft 365, it integrates seamlessly, making it a top choice for Power BI embedding. With Copilot, users can turn plain English prompts into DAX formulas, allowing them to create reports and visualizations without needing advanced technical skills.
A standout feature is the "How Copilot arrived at this" diagnostic tool, which breaks down the steps behind each AI-generated output. This transparency is particularly important for financial audits and data reviews. While its natural language query (NLQ) accuracy is rated at 4.1/5, more complex queries may require precise semantic inputs to achieve optimal results.
Power BI with Copilot supports live connections to data warehouses such as Snowflake, BigQuery, and Azure Synapse, as well as in-memory imports. For security, it enforces Row-Level Security (RLS) and Object-Level Security (OLS). However, since Copilot might bypass RLS in certain scenarios, teams handling sensitive data should rely on OLS for stricter governance. The platform ensures that non-technical users can access consistent, reliable data insights directly from warehouse-native sources.
To ensure accuracy, a strong semantic model is essential. Each measure, table, and column should include a concise description (up to 200 characters). While this requires an initial setup effort, it significantly improves query precision in the long run.
Microsoft plans to retire its legacy rules-based Q&A engine by December 2026, making Copilot the sole natural language querying option in Power BI. Teams using Q&A visuals should plan their migration well before this deadline.
Here’s a quick overview of Power BI with Copilot’s key features:
Feature | Detail |
|---|---|
NLQ Approach | Generative Copilot (DAX-based) |
NLQ Accuracy | 4.1/5 |
Transparency | "How Copilot arrived at this" diagnostic tool |
Primary Integration | Microsoft 365 (Excel, Teams, Azure) |
Governance | RLS + OLS; sovereign cloud not supported |
Data Connection | Live warehouse or in-memory import |
4. Tableau with Tableau Pulse
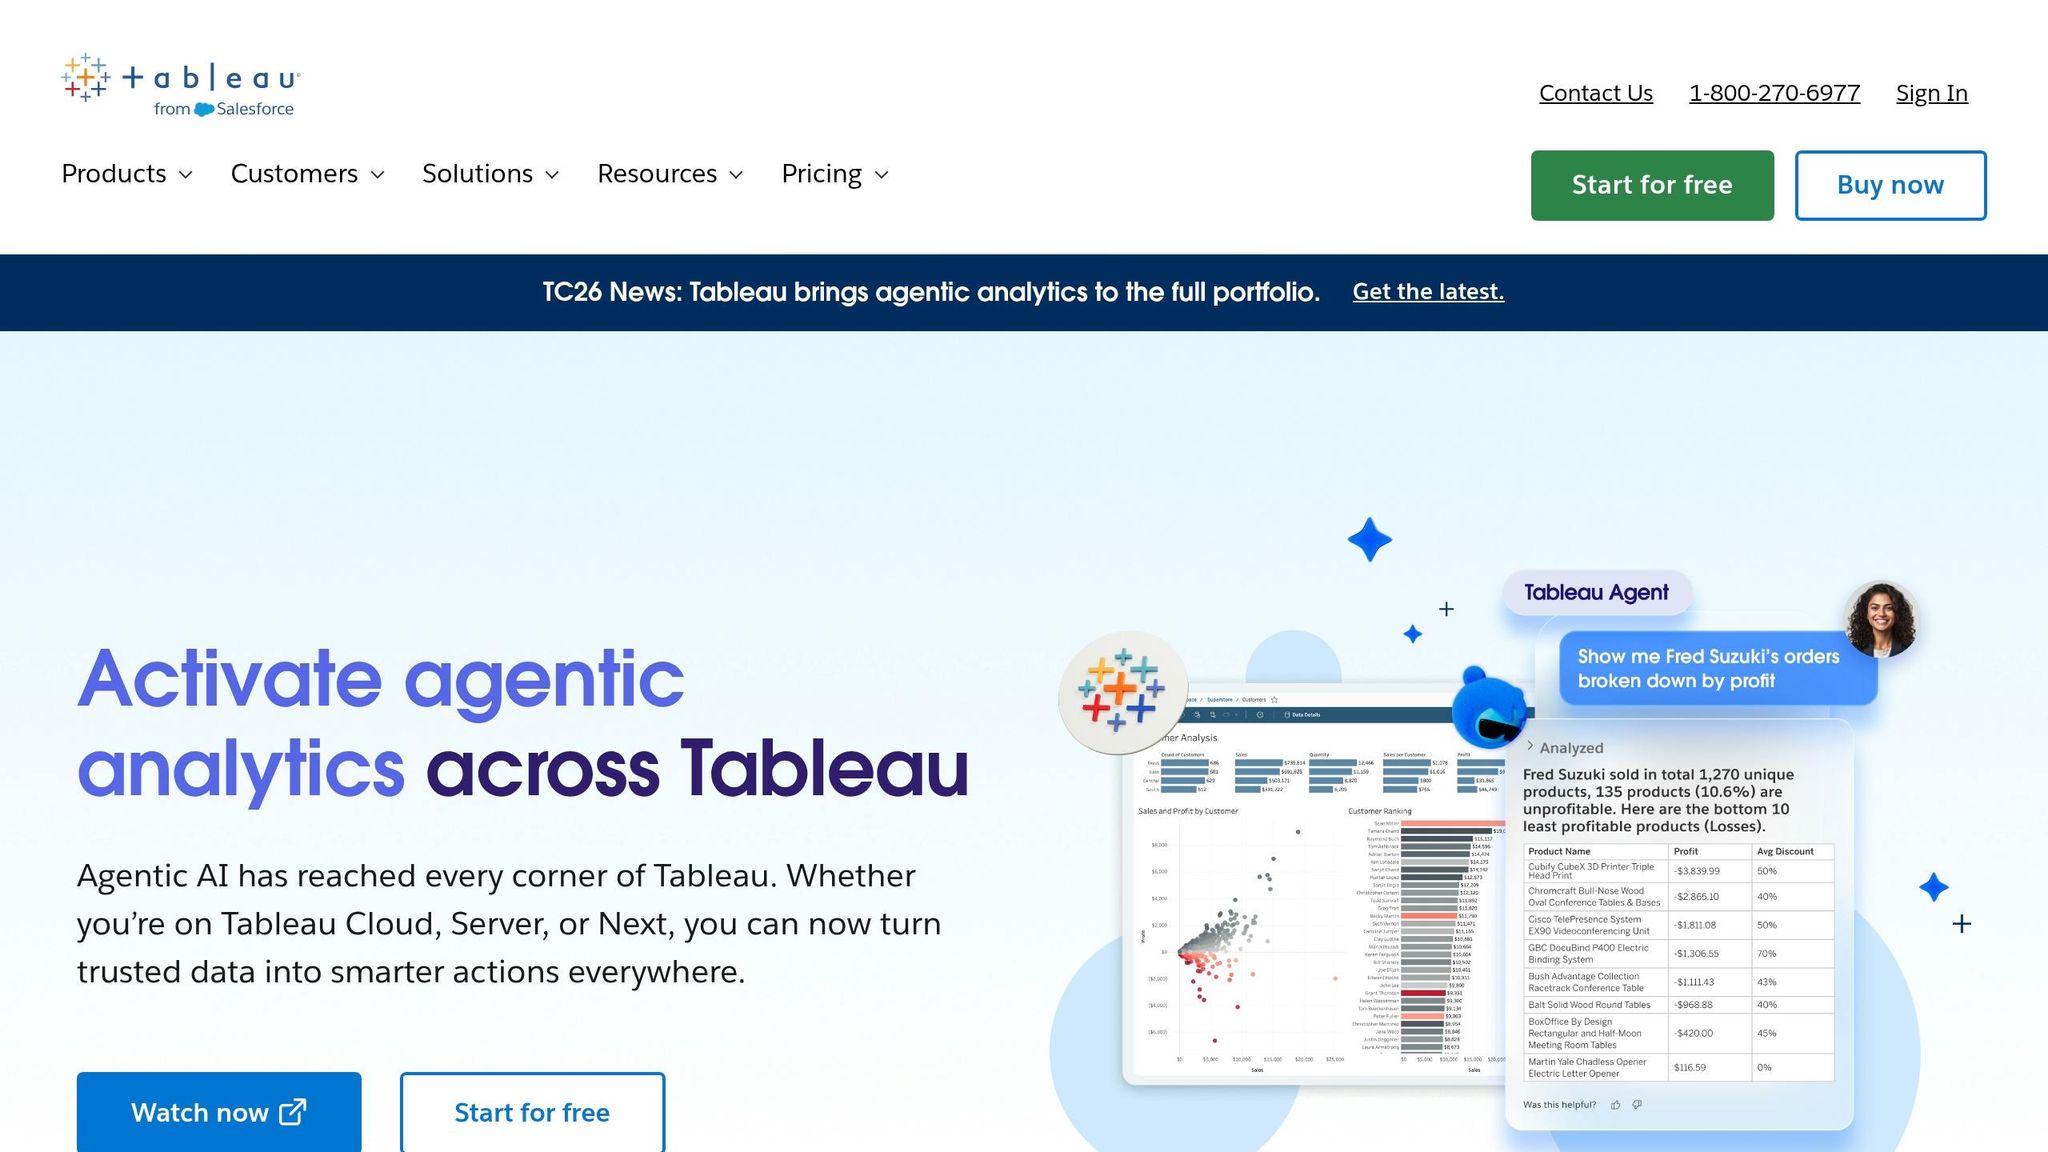
Tableau Pulse is designed to meet the growing need for AI-powered insights. Instead of requiring users to build dashboards manually, Pulse tracks key performance indicators (KPIs) automatically and delivers concise, automated summaries - eliminating the need for manual chart analysis. This approach aligns with the push to simplify complex data processes for B2B SaaS teams.
With the Tableau Agent, users can type plain-English queries like, "show me revenue by region for Q1 2026," and instantly generate visual charts. However, its reliance on proprietary visualization logic means users may encounter limited transparency when it comes to understanding the underlying queries.
From a governance perspective, Tableau strengthens its AI workflows by extending Row-Level Security (RLS) and role-based access controls. This is particularly beneficial for larger organizations, as it ensures consistent metric definitions - an essential feature for platforms with a governed semantic layer. Additionally, the Einstein Trust Layer provides extra safeguards for AI interactions, handling tasks like masking personally identifiable information (PII), scoring for toxicity, and enforcing a zero-data retention policy to ensure sensitive data isn’t exposed in AI prompts.
Tableau connects seamlessly to major data platforms like Snowflake, Google BigQuery, and Amazon Redshift, along with over 400 other connectors. For optimized AI performance, Tableau recommends using .hyper extracts. However, these extracts can lead to data duplication and require more maintenance compared to live connections.
Despite these features, Tableau has a steep learning curve, especially for new users. Pricing ranges from $75 to $115 per user per month, which can be a consideration for budget-conscious teams. That said, Pulse significantly streamlines the experience for business stakeholders focused on KPI monitoring. While it’s ideal for executive dashboards and KPI storytelling, teams that prioritize SQL transparency might lean toward alternatives like Querio, which offers governed analytics.
Feature | Detail |
|---|---|
NLQ Approach | Metrics-driven visual narrative (Tableau Agent) |
NLQ Accuracy | 4.0/5 |
SQL Transparency | Limited - uses proprietary visualization logic |
Governance | RLS, role-based access, Einstein Trust Layer |
Data Connection | Live connections + .hyper extracts; 400+ connectors |
Best For | Executive dashboards and KPI storytelling |
Pricing | $75–$115/user/month |
5. Google Looker
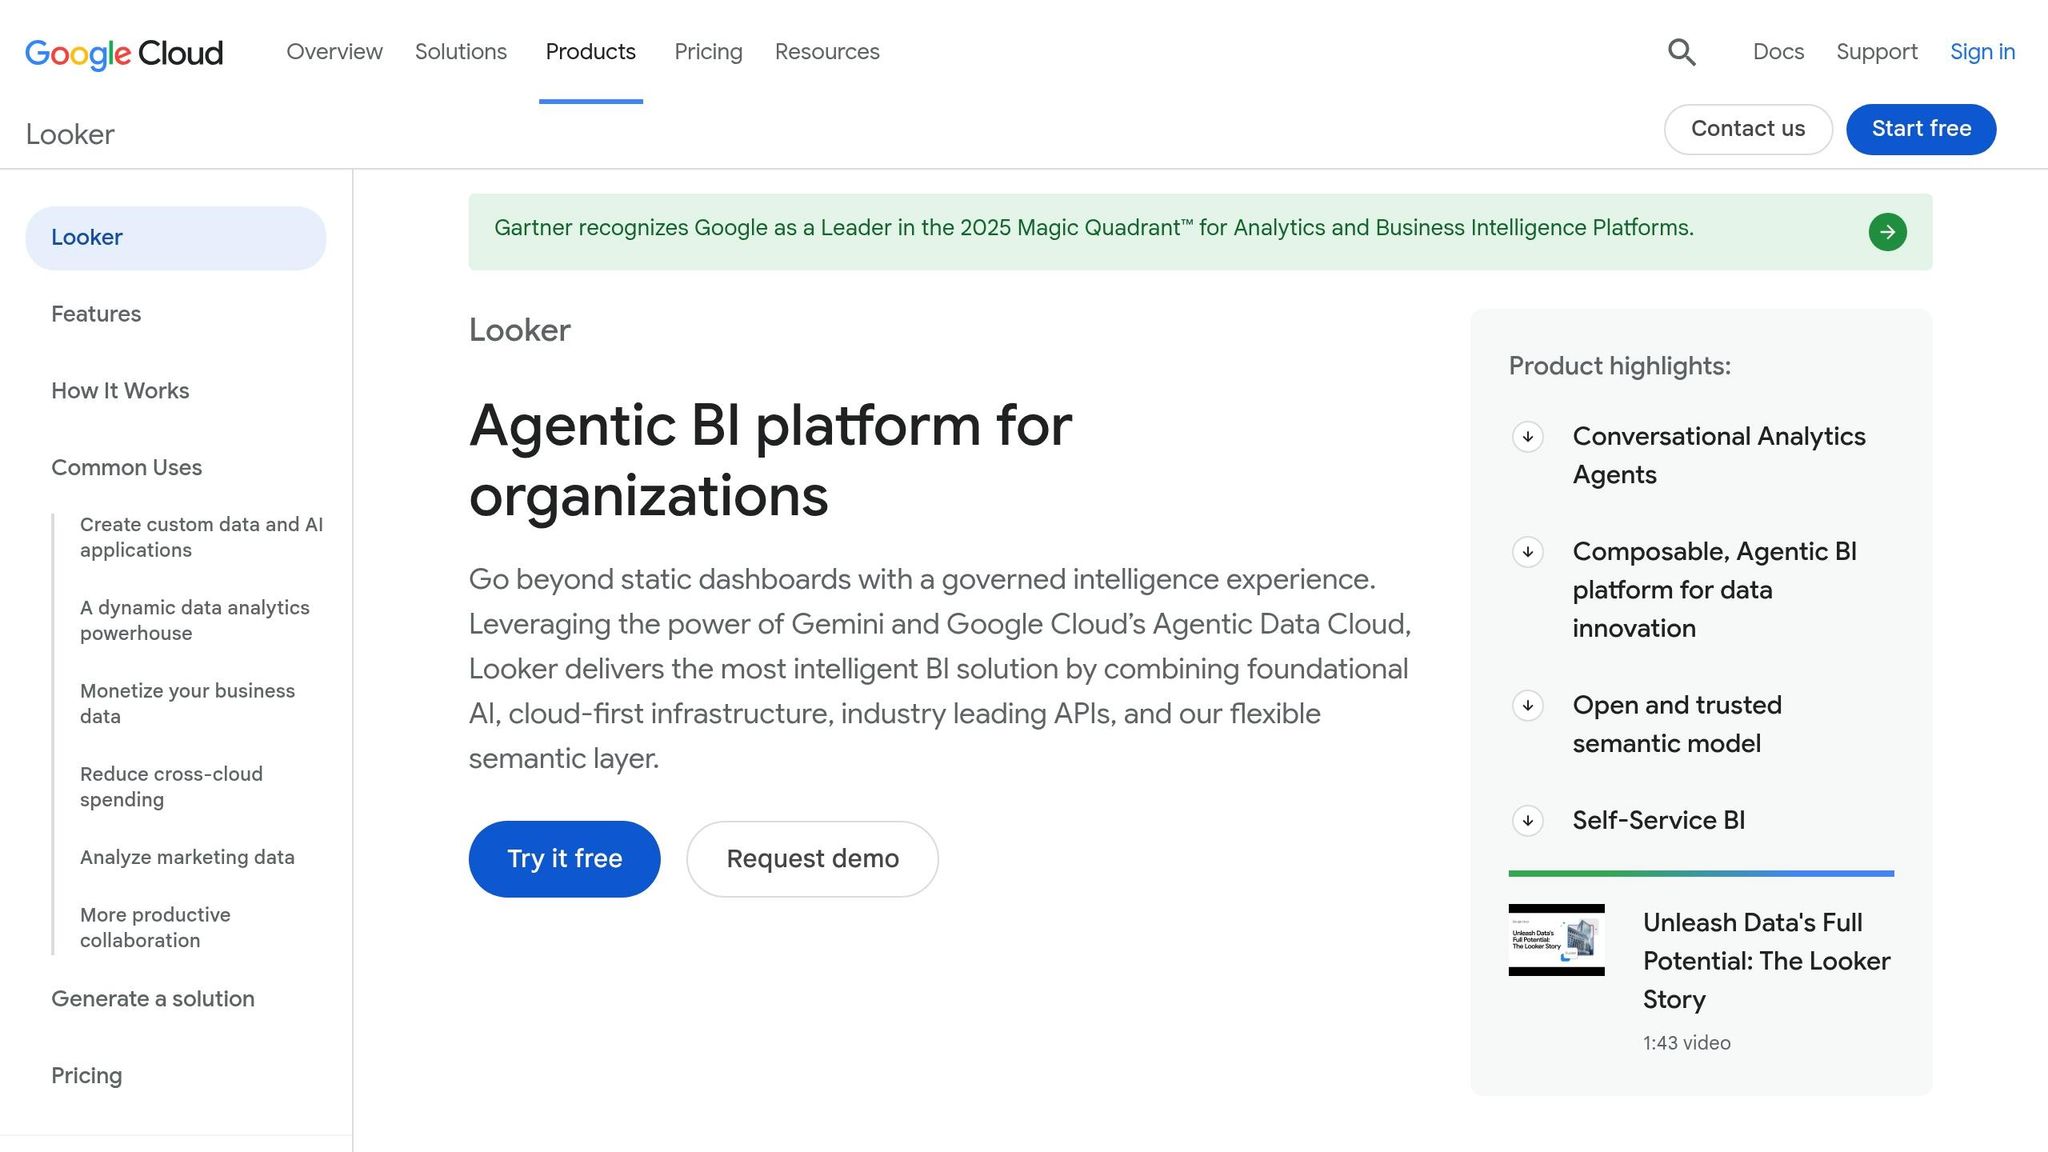
Google Looker is a governed BI platform designed for data teams, built around its proprietary LookML modeling layer. This layer centralizes metric definitions, relationships, and business logic, ensuring that all reports and dashboards pull from a unified source of truth. For companies already using Google Cloud and BigQuery, Looker integrates seamlessly into the ecosystem.
However, Looker's reliance on LookML means setting up and maintaining its data model requires technical expertise. This limits the platform's self-service capabilities for non-technical users. Without a well-maintained LookML project, the natural language querying (NLQ) experience can falter. While non-technical users can explore pre-built dashboards and use the conversational interface layered on top, they remain dependent on the data team to model and expose the necessary data.
When it comes to governance and data integrity, Looker excels. Its centralized semantic layer ensures consistent metric definitions across the organization - an essential feature for B2B SaaS companies where metrics like revenue, churn, and activation must remain consistent in every report. Looker also provides strong access controls, row-level security, and audit logging. Additionally, it connects directly to live data warehouses like BigQuery, Snowflake, Redshift, and Postgres, keeping data fresh and reducing duplication. While its governance features are robust, Looker's approach can feel less accessible in other areas.
One of the key limitations for non-technical users is the lack of SQL transparency. When a user queries data, the underlying query logic is hidden within LookML's proprietary abstraction, making it difficult to inspect or modify the generated SQL. For data teams that need full visibility into warehouse queries, this creates a "black box" challenge.
Feature | Detail |
|---|---|
NLQ Approach | Conversational interface over LookML-modeled data |
SQL Transparency | Limited - proprietary LookML abstraction |
Governance | Centralized LookML semantic layer, row-level security, audit logging |
Data Connection | Live warehouses (BigQuery, Snowflake, Redshift, Postgres) |
Technical Requirement | High - requires LookML expertise |
Best For | Google Cloud–native teams with dedicated data engineering resources |
6. Hex
Hex is a workspace designed for collaboration, seamlessly blending SQL, Python, and AI tools within a reactive notebook interface. Think of it like a spreadsheet: when you tweak one cell, everything downstream updates automatically. For example, if a stakeholder requests a new view of revenue data, an analyst can make a single adjustment, and the entire notebook recalibrates, keeping workflows consistent and centralized. Hex directly connects to data warehouses like Snowflake, BigQuery, Redshift, and Postgres using encrypted, read-only links. This setup ensures secure, real-time access to data without needing manual exports.
That said, Hex caters mainly to technical users. While business stakeholders or operations managers can interact with published Hex apps, building or modifying the logic behind them still requires skills in SQL or Python. The AI assistance speeds up query creation but doesn’t eliminate the need for coding expertise. As a result, non-technical users often rely on data teams to set up and maintain these workflows. For organizations prioritizing live connections to data warehouses and clear, transparent logic, this coding dependency could pose challenges in creating a fully self-serve analytics environment.
Feature | Detail |
|---|---|
AI Assistance | AI helps generate SQL/Python queries directly in notebooks |
Reactive Notebooks | Automatically updates cells, similar to spreadsheet formulas |
Governance | Shared context layer for team collaboration |
Data Connection | Live connections to Snowflake, BigQuery, Redshift, and Postgres |
Technical Requirement | Medium-High - non-technical users can view but not build apps |
Best For | Data teams needing collaborative, code-driven notebooks with AI help |
Hex stands out as a powerful tool for technical teams, offering a structured, code-first approach. However, it contrasts with platforms like Querio; for a deeper look at how they differ, see our comparison of Hex vs. Querio, which focuses on creating a more accessible, self-serve analytics experience.
7. Tellius

Tellius offers a user-friendly interface featuring a Google-like search bar where users can type straightforward, plain-English questions - like "Why did revenue drop last quarter?" - to get instant visual answers, ranked drivers, and narrative explanations. This design makes it accessible for non-technical users such as product managers, marketers, and operations leaders who need quick insights without a deep understanding of data analysis.
What sets Tellius apart is its ability to automatically uncover root causes, anomalies, and key segments that explain metric changes. Behind the scenes, it analyzes thousands of dimension and metric combinations to identify drivers - a task that would typically take a skilled analyst hours to complete. According to Tellius, this approach can reduce ad hoc reporting time by nearly 80% compared to traditional workflows.
From a governance perspective, Tellius includes features like role-based access control, row-level security, SSO/SAML, and audit logs. These ensure that business users can explore data freely while safeguarding sensitive information. It also connects directly to major cloud data warehouses - Snowflake, BigQuery, Redshift, Databricks, and Azure Synapse - eliminating the need for data extracts and outdated CSV files. This setup allows data teams to maintain control over metric definitions while enabling non-technical users to access crucial insights without delays caused by technical dependencies.
Feature | Detail |
|---|---|
Natural Language Querying | Simple search bar for plain-English questions, delivering visual answers |
"Why" Analysis | Automated root-cause and driver analysis across thousands of combinations |
Governance | Includes role-based access, row-level security, SSO/SAML, and audit logs |
Data Connections | Real-time connections to Snowflake, BigQuery, Redshift, Databricks, and Azure Synapse |
Technical Requirement | Minimal for end users; initial setup and semantic layer configuration require data team involvement |
Best For | Business teams seeking quick, self-serve analysis of "why" metrics change |
It’s worth noting that while Tellius is highly intuitive for business users, the initial setup does require data engineers to configure the semantic layer and data models. Once this groundwork is complete, business teams can explore data independently, ask follow-up questions, save insights as shareable "stories", and drill down into metrics - all without needing to submit requests to the data team. This combination of speed, ease of use, and strong governance makes Tellius a standout option among AI analytics tools.
Comparison Table
The table below breaks down the features of each tool, focusing on natural language querying, governance, live warehouse integration, and ideal use cases. This side-by-side format makes it easier for non-technical users to evaluate which tool aligns best with their needs.
Tool | Natural Language Querying | Governance | Warehouse Integration | Ideal Use Case |
|---|---|---|---|---|
Querio | Conversational AI generates inspectable SQL and Python, grounded in a shared semantic layer | Centralized semantic/context layer, RBAC, SOC 2 Type II, SSO | Snowflake, BigQuery, Redshift, ClickHouse, PostgreSQL, MySQL, and more – live, read-only connections | Data teams at B2B SaaS companies enabling governed self-serve analytics without black-box AI |
ThoughtSpot | Mature Google-like search bar (Spotter) that supports typed and conversational queries to instantly generate charts | Row-level security, object-level permissions, metadata privacy, verifiable query plans | Snowflake, BigQuery, Redshift, Databricks, Azure Synapse – live cloud connections | Business users needing search-first BI with enterprise-grade controls |
Microsoft Power BI with Copilot | Generative AI Copilot creates reports, DAX measures, and narrative summaries from natural language prompts | Sensitivity labels, data loss prevention, RLS/OLS, deployment pipelines, tenant admin settings | Microsoft Fabric, Azure Synapse, cloud warehouses, and on-prem databases | Organizations using Microsoft 365 or Azure that want embedded AI in familiar tools |
Tableau with Tableau Pulse | Tableau Pulse pushes personalized, plain-English metric summaries to Slack, email, and Salesforce | Role-based permissions, data source certification, PII masking, enterprise SSO | Snowflake, BigQuery, Redshift, Salesforce, and more | Executive teams and business stakeholders who want automated KPI alerts without opening a dashboard |
Google Looker | Natural language querying via Duet AI/Vertex AI integration, supported by a LookML semantic model | Centralized LookML model, row-level permissions, content access controls | BigQuery-native; also supports Snowflake, Redshift, and other cloud warehouses | Enterprise teams needing consistent, centrally governed metrics across all reports and users |
Hex | Magic AI and Hex AI translate natural language to SQL and auto-generate analyses for analysts and stakeholders | Role-based access, workspace-level controls, read-only app sharing for non-technical viewers | Snowflake, BigQuery, Redshift, Databricks – direct warehouse connections | Analyst-led teams wanting notebook-style workflows with shareable, no-code apps for business users |
Tellius | Google-like search bar for plain-English "why" questions with automated root-cause and driver analysis | RBAC, row-level security, SSO/SAML, audit logs | Snowflake, BigQuery, Redshift, Databricks, Azure Synapse – real-time connections | Business teams that need fast, self-serve answers to why a metric changed, not just what it is |
This comparison makes it clear how each tool caters to different business intelligence needs. Querio stands out for its governed semantic layer and inspectable SQL, making it ideal for teams seeking reliable insights from live warehouse data. Looker's LookML model also shines for centralized governance, ensuring consistent metrics across reports. ThoughtSpot and Tellius are perfect for users who prefer intuitive, question-based interfaces that deliver immediate results, while Power BI and Tableau integrate seamlessly into Microsoft and Salesforce ecosystems, respectively. Lastly, Hex offers a notebook-style environment that analysts will appreciate, along with no-code apps for sharing insights.
Choosing the right tool depends on your tech stack, your team’s technical expertise, and the governance requirements of your organization. This breakdown helps identify the best fit for achieving warehouse-native analytics with the right balance of accessibility and control.
Conclusion
Selecting the right AI data analysis tool requires careful consideration of your data's location, the governance level needed, and the daily users interacting with it. For B2B SaaS teams, this means finding a solution that offers governed, warehouse-native, self-service analytics platforms with minimal technical hurdles.
If your data stack lives in platforms like Snowflake, BigQuery, or Redshift, a natural-language tool such as Querio can speed up insights and reduce reliance on data teams. For organizations entrenched in the Microsoft ecosystem, Power BI with Copilot provides a seamless fit. Looker works well for Google Cloud teams needing consistent metrics across all reports, while Tableau with Tableau Pulse is ideal for teams focused on creating polished, interactive dashboards. Hex caters to analytics engineers who prefer notebook-style workflows while offering no-code views for business users. When teams need to dig deeper into the why behind data trends, Tellius stands out. Governance is also a key factor - teams requiring governed self-service without a lengthy IT setup will appreciate Querio's centralized semantic layer and transparent SQL, ensuring consistent and reliable data definitions.
To make an informed choice, consider running a 60–90 day pilot in a critical business area. Track how frequently users can independently resolve queries and how accurately AI-generated insights align with data-team results. These practical indicators often provide more clarity than a feature checklist. For teams prioritizing governed, transparent, and live data insights, Querio offers a strong example of what to look for.
Ultimately, the best tool is the one your team will both use and trust.
FAQs
How do I choose the right AI analytics tool for my data stack?
To choose the best AI analytics tool, focus on platforms that offer direct, live connections to your data warehouse - such as Snowflake, BigQuery, or Redshift. This setup ensures you get real-time insights without the hassle of duplicating data. Additionally, prioritize tools with a centralized semantic layer to maintain consistent metrics across your organization. It's also important that the tool generates transparent, inspectable SQL or Python code, giving your team full control and making it easier to validate analytics logic with confidence.
Do these tools work on live Snowflake or BigQuery data?
Yes, these AI-driven tools integrate seamlessly with live data warehouses like Snowflake and BigQuery. By leveraging encrypted, read-only connections, platforms like Querio execute real-time queries directly on production data. This eliminates the hassle of duplicating data, setting up ETL pipelines, or relying on outdated CSV exports. As a result, users gain access to precise, up-to-the-minute insights, while analysts have the ability to review the SQL or Python code generated for each query.
What setup is needed to ensure natural-language queries are accurate?
To make natural-language queries more accurate, you should create a governed semantic layer. This layer centralizes critical elements like metric definitions, table relationships, and business logic. For example, defining key terms such as "revenue" or "churn rate" in a glossary ensures consistency in calculations. Adding metadata and synonyms further tailors the system to align with your business requirements. This setup allows the AI to better understand user intent, connect terms to the right data, and produce reliable SQL or Python code that’s easy to trace and understand.
Related Blog Posts


