Business Intelligence
How to Manage Metrics and Dimensions in a SaaS App
Guide to defining, organizing, and governing SaaS metrics and dimensions with a semantic layer, AI-driven updates, and validation for consistent analytics.
Metrics and dimensions are the backbone of SaaS analytics. Metrics measure performance (e.g., revenue, churn, MRR), while dimensions add context (e.g., customer segments, regions). Misaligned definitions across teams can lead to confusion and slower decisions. Tools like Querio centralize these definitions, ensuring everyone works with consistent, accurate data.
Key takeaways:
Focus on meaningful metrics like MRR, churn, and LTV/CAC ratio.
Avoid vanity metrics that don't drive action.
Assign clear ownership for each metric to prevent accountability gaps.
Use dimensions (e.g., customer segment, geography, subscription plan) to analyze trends and uncover insights.
Querio's semantic layer for SaaS connects directly to your data warehouse, standardizing metric definitions and improving data accuracy. Regular metric governance, AI-driven updates, and validation rules ensure your analytics remain reliable as your business grows.
What Metrics and Dimensions Drive SaaS Dashboard Value?
How to Define Core Metrics and Dimensions for Your SaaS Business
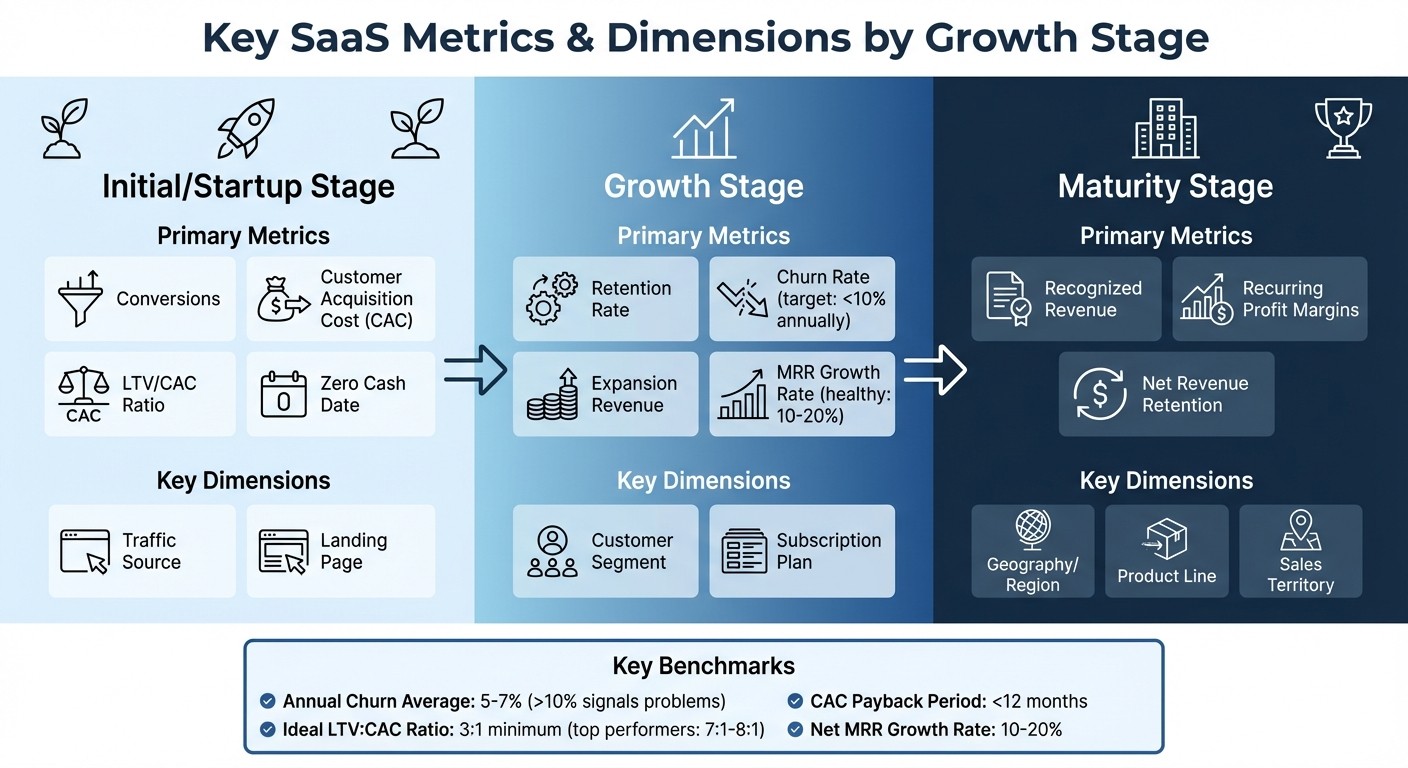
SaaS Metrics and Dimensions by Growth Stage: Startup to Maturity
Start by evaluating where your business currently stands. A startup working toward product-market fit will need to track very different numbers compared to a well-established company looking to fine-tune its operations. For early-stage businesses, focus on metrics like conversions, customer acquisition cost (CAC), and the Zero Cash Date - how long you can keep running before funds run out. As your business grows, shift attention to retention rates, churn, and expansion revenue. Once you reach maturity, your priorities should include recognized revenue and profit margins.
Steer clear of vanity metrics that may look impressive but don’t provide actionable insights. For example, while total registered users will always go up, it doesn’t necessarily reflect business health. Instead, focus on rates like weekly signups or activation rates. As Twilio Segment wisely points out:
"Your dashboard metrics should make it impossible to hide from failure."
If a metric doesn’t help you identify what’s working or what’s broken, it’s not worth your time.
Each metric you track needs a clear owner. When multiple teams share responsibility for something like monthly recurring revenue (MRR), accountability often falls through the cracks. Divide ownership instead: let Product manage self-service MRR while Sales oversees enterprise MRR. This approach eliminates confusion and ensures someone is always keeping an eye on the numbers that matter most to their role.
Key SaaS Metrics to Track
Monthly Recurring Revenue (MRR) and Annual Recurring Revenue (ARR) are the backbone of predictable income in subscription-based businesses. A healthy net MRR growth rate typically falls between 10% and 20%. Break MRR down into components like new MRR from acquisitions, expansion MRR from upsells, and lost MRR from churn to understand whether your growth is fueled by new customers or by expanding existing accounts.
Churn rate is your indicator of customer loss. For SaaS companies, the annual churn average hovers around 5% to 7%, but anything exceeding 10% signals deeper issues with your product or its perceived value. Reducing churn by just 5% can significantly improve profitability. Keep an eye on both customer churn (the number of accounts lost) and revenue churn (the financial impact), as losing a single enterprise client can hurt much more than losing several smaller ones.
Customer Lifetime Value (LTV) and Customer Acquisition Cost (CAC) are critical for assessing your business model's sustainability. A solid LTV-to-CAC ratio should be at least 3:1, with top-performing SaaS companies achieving ratios as high as 7:1 or 8:1. Venture capitalist David Skok emphasizes:
"The best SaaS businesses have an LTV to CAC ratio higher than 3, sometimes as high as 7 or 8."
Additionally, aim to recover your CAC within 12 months. To calculate your payback period, divide CAC by the monthly revenue generated from a new customer.
Net Promoter Score (NPS) gauges customer satisfaction by asking how likely users are to recommend your product. Scores between 0 and 6 highlight "detractors" - users at high risk of churning who need immediate attention. While NPS doesn’t directly predict revenue, it serves as an early warning system for retention issues before they show up in your churn metrics.
Once you’ve identified the metrics that matter, add context by analyzing key dimensions.
Important Dimensions for Data Analysis
Dimensions provide the context needed to interpret your metrics effectively. One of the most important is customer segment. Self-service users, mid-market clients, and enterprise customers all behave differently, with distinct needs, churn patterns, and lifetime values. By segmenting MRR, you can pinpoint growth drivers and areas of revenue loss.
Subscription plan analysis reveals where customers perceive value. Are more users upgrading from the basic tier, or are they downgrading from premium? Monitor upgrades, downgrades, and plan-specific churn to understand which features justify higher pricing. If your enterprise plan has high churn, it could signal misaligned pricing or unmet expectations.
Geographical location can also play a crucial role. Revenue performance often varies by region - what succeeds in one area might flop in another. Regional analysis helps you allocate resources wisely and tailor your marketing efforts. It can also uncover new opportunities in underserved markets.
Product usage dimensions, such as feature adoption and engagement levels (e.g., daily active users divided by monthly active users), reveal how customers interact with your product. High engagement often predicts retention better than demographic data. Use this information to identify which features keep users coming back and which ones aren’t pulling their weight.
Growth Stage | Primary Metric Focus | Key Dimensions for Analysis |
|---|---|---|
Initial/Startup | Conversions, LTV/CAC, Zero Cash Date | Traffic Source, Landing Page |
Growth | Retention, Churn, Expansion Revenue | Customer Segment, Subscription Plan |
Maturity | Recognized Revenue, Recurring Profit Margins | Geography, Product Line, Sales Territory |
For example, if enterprise customers in California have a churn rate of 3%, while those in Texas churn at 15%, you’ve identified a specific issue to address. This is the power of thorough dimensional analysis - it transforms vague concerns into actionable insights.
With your core metrics and dimensions in place, let’s explore how Querio organizes them to ensure consistency across teams.
How to Organize Metrics and Dimensions in Querio
Once you've laid the groundwork with your core definitions, the next step is organizing your metrics and dimensions in Querio. This helps ensure that teams across your organization are on the same page. Without consistency, you risk scenarios where Product defines MRR one way and Finance calculates it differently, leading to conflicting reports and wasted time. Querio solves this issue by centralizing metric definitions in a semantic layer that connects directly to your data warehouse - no data duplication required.
Using Querio's Semantic Layer for Consistent Definitions
Querio's semantic layer acts as a single source of truth for all your metric definitions and calculations. Define each metric - whether it’s SaaS metrics like MRR, churn, and LTV - just once, and everyone in your organization pulls from that same definition. This eliminates repetitive coding and ensures that when your VP of Sales checks MRR or your CFO reviews it, they’re looking at the exact same numbers.
The semantic layer also simplifies complex calculations. For example, if your LTV formula includes multiple components like average revenue per account, gross margin, and churn rate, you can set up the entire framework just once. From then on, anyone querying LTV gets consistent results without needing to dive into the underlying SQL. Data teams can also define table and column joins, create business glossaries, and set rules for how metrics behave across the platform. This frees up analysts to focus on generating insights rather than troubleshooting inconsistencies.
Next, let’s explore how Querio connects these standardized definitions to your live data warehouse.
Connecting to Your Data Warehouse with Querio
Querio links directly to live data warehouses like Snowflake, BigQuery, and Postgres, ensuring your data remains secure and up-to-date. With read-only, encrypted connections, Querio queries your warehouse in real time, so every chart, dashboard, and report reflects the latest data.
It also integrates data from tools like your CRM, billing system, and financial software, all in real time. By unifying these sources, Querio eliminates the need for manual reconciliation, giving your teams consistent metrics they can rely on.
How to Maintain and Govern Metrics and Dimensions
To keep your SaaS analytics dependable, you need to continuously update and manage your metrics as your data landscape evolves. Metrics and dimensions naturally shift as your business grows and new data sources come into play. Without proper governance, definitions can drift, leading to inconsistencies. And let's face it - poor data quality isn't just frustrating; it can cost organizations millions. That's why governance is critical to maintaining reliable analytics.
Using AI Workflows to Update Metrics and Dimensions
Querio's AI-driven tools make it easier to keep your metrics up-to-date. As dbt Labs puts it:
"If a metric definition changes in dbt, it's refreshed everywhere it's invoked and creates consistency across all applications."
This consistency eliminates the headache of teams working with mismatched calculations.
Querio's AI-powered Python notebooks take things a step further, allowing you to perform natural language data querying tools and complex analyses without needing to write manual SQL. Its semantic engine dynamically builds queries at runtime, automatically identifying the best paths between tables - even as the structure of your data warehouse changes. This means you can integrate new data sources or tweak existing ones without rewriting every downstream query. Plus, Querio supports both SQL and Python models, giving your team the flexibility to adapt as your data requirements evolve. These automated updates also help establish strong version control and governance practices.
How to Ensure Data Governance and Accuracy
Effective governance starts with version control. By versioning all metric definitions in Git, you create a clear history of changes, making it easy to track updates or roll back if something goes wrong. Querio integrates validation into Continuous Integration (CI) workflows, ensuring that updates to your data models don't break existing metrics. As the dbt Developer Hub explains:
"Validate semantic nodes in CI to ensure code changes made to dbt models don't break these metrics."
Assign ownership for each metric to a specific team member, such as a product manager for user engagement metrics or a finance analyst for revenue calculations. This ensures accountability for accuracy. Maintain a centralized data dictionary that includes all definitions, formulas, and workflows. For dimensions that evolve over time - like a customer's subscription tier or location - use Slowly Changing Dimensions (SCD Type II) to track historical changes accurately. Regularly review your taxonomy to ensure it aligns with your organization's shifting goals and priorities.
How to Fix Common SaaS Analytics Problems
Even with strong governance in place, SaaS teams often face recurring analytics challenges. Issues like inconsistent definitions, high-cardinality dimensions, and incomplete data can throw off your reporting and lead to poor decision-making. The good news? These problems can be addressed with targeted solutions.
Fixing Inconsistent Definitions
In platforms like Querio, fragmented data often leads to unreliable analytics. Different teams may calculate the same metric differently - marketing might define "Activated Accounts" one way, while the product team uses an entirely different filter. Even naming conventions can vary, with terms like "Order Completed" and "Completed Order" being used interchangeably. These inconsistencies create confusion and erode confidence in your analytics.
Querio’s semantic layer vs. traditional data models comparison highlights how building a semantic layer to standardize definitions helps teams. For example, once you define terms like "Active User" or "ARR", that definition applies universally across dashboards, reports, and queries. This eliminates the need for individual teams to rely on their own custom calculations, often found in rogue spreadsheets.
"Metrics create a common language across your teams, aligning company goals to department goals."
To further reduce confusion, standardize naming conventions (e.g., "Order Completed" instead of multiple variations) and audit property definitions to ensure consistency across all events. This clarity builds trust in your data and simplifies collaboration.
Once definitions are standardized, the next step is tackling high-cardinality dimensions that can bog down your system.
Managing High-Cardinality Dimensions
High-cardinality dimensions - fields with thousands or even millions of unique values, such as User IDs, transaction IDs, or IP addresses - can drag down query performance. When using Querio, these dimensions can cause queries to slow significantly as the system processes an overwhelming number of unique values.
To address this, start with dimension reduction. Filter out non-essential high-cardinality fields, applying these filters at the semantic layer level within Querio. This ensures only the most relevant dimensions are included in your queries.
For dimensions that must remain, partitioning and specialized indexing can make a big difference. Break large tables into smaller, more manageable pieces using strategies like range, list, or hash partitioning. This reduces the amount of data scanned during queries. For exploratory analysis where exact precision isn’t critical, you can use data sampling to work with smaller, random subsets of your data. Additionally, approximate aggregation algorithms like HyperLogLog can provide fast, resource-efficient counts of distinct values.
With dimensions optimized, the final step is ensuring your data is accurate and ready for analysis through proper validation and cleaning.
How to Validate and Clean Your Data
Inaccurate data can undermine even the most carefully designed analytics. On average, poor data quality costs organizations $15 million annually, yet only 3% of companies achieve a score of 97 or higher for error-free records out of 100.
Querio’s AI-driven workflows simplify data validation and cleaning. Using statistical calculations and machine learning, the system flags outliers and identifies errors. For missing data, AI-powered gap filling analyzes contextual and historical patterns to predict and insert the most likely values. Additionally, algorithms can flag contradictory statistics for review, preventing inaccuracies from spreading through your reports.
To maintain high-quality data, set up automated validation rules that check incoming data against specific criteria before processing. Create alerts to notify your team when data deviates from expected patterns - such as sudden spikes or drops in revenue figures. Focus on addressing the root causes of data issues, rather than just treating the symptoms.
"Reliable and relevant analytics are important from the get-go, and they are not achievable without some data governance."
Best Practices for Managing Metrics and Dimensions in SaaS
Managing metrics and dimensions effectively starts with keeping things well-organized. A good approach is to use hierarchical naming that moves from broad to specific, like analytics.jobs.total. Stick to a single delimiter and keep names short - ideally under 40 characters - for consistency. This structure makes it easier to separate measurements from metadata clearly.
Measurements - like revenue or other numeric, time-varying data - should always be distinct from metadata, which includes descriptive attributes like region or subscription tier. This separation improves efficiency by keeping low-cardinality data (metrics) separate from high-cardinality data (dimensions). Clearly defining and centralizing these distinctions ensures everyone is working with the same definitions and avoids potential discrepancies.
To create a unified analytics framework, built on semantic layer concepts, establish a single source of truth directly at the data source. Tools like Querio's semantic layer can help ensure that all dashboards pull from consistent definitions and default aggregations. This eliminates downstream errors and conflicting metrics, so your data stays reliable.
Accuracy is another key piece of the puzzle. Use automated validation rules and alerts to catch anomalies early. Querio's AI workflows can help detect outliers, fill gaps in historical data, and keep everything running smoothly. Regularly auditing metric definitions is also essential to prevent them from drifting over time. By weaving these governance practices into your routine, you can maintain reliable analytics as your business grows and changes.
When these practices are in place, your analytics become a powerful tool for decision-making. Teams can align faster, spot trends sooner, and stop wasting time reconciling conflicting reports. A shared "data language" makes everything run more smoothly and keeps everyone focused on what matters most.
FAQs
How does Querio ensure consistent data across teams using its semantic layer?
Querio's semantic layer acts as a centralized hub for data clarity, transforming raw data into standardized, business-friendly definitions that everyone in your organization can rely on. Whether it’s monthly recurring revenue (MRR), churn rate, or customer lifetime value (CLV), these key metrics are clearly defined and shared across all departments - marketing, sales, finance, and product - ensuring everyone operates with the same consistent logic.
By eliminating the need for manual calculations or custom formulas, Querio removes the risk of conflicting reports or discrepancies. No matter which tool or platform teams use, they’ll see the same accurate numbers. On top of that, the semantic layer supports natural-language queries, letting users request metrics in plain English while automatically applying these standardized definitions. This streamlines collaboration and builds trust in your data across the board.
What mistakes should I avoid when choosing metrics for my SaaS app?
When choosing metrics for your SaaS app, it’s crucial to avoid common mistakes that can lead to wasted energy or skewed insights.
First, stay away from vanity metrics - these are flashy numbers like total sign-ups or raw page views that might look good but don’t necessarily indicate growth or profitability. Instead, prioritize actionable metrics - the ones that directly connect to your business goals and help guide smart decisions.
Second, don’t waste time tracking metrics that don’t lead to actionable outcomes or fail to answer important questions. A good metric should add value by providing clarity and direction. If it doesn’t, it’s just noise cluttering your analysis.
Lastly, avoid overloading your dashboards with too many metrics or ones that lack clear definitions. A cluttered dashboard can obscure trends and make it harder to trust the data. Stick to a focused selection of well-defined metrics, and review them regularly to ensure they remain accurate and relevant.
By zeroing in on metrics that are actionable, outcome-focused, and clearly defined, you’ll equip your SaaS app with the insights needed for smarter, data-driven decisions.
How can AI tools enhance the management of metrics in a SaaS platform?
AI-powered tools, such as Querio, take the hassle out of managing metrics by automating tasks that are typically manual and error-prone. For instance, with natural-language querying, team members can simply ask questions like, “What was our churn rate last month?” to instantly access accurate, pre-defined metrics. This eliminates the guesswork and inconsistency of ad-hoc calculations, ensuring the data you rely on is precise. Plus, features like role-based access controls, encryption, and audit trails add an extra layer of security and accountability. These tools make it easy to track who updated metrics and when, aligning with compliance standards like SOC 2.
But AI doesn’t stop there. It actively monitors your data, using predictive models to flag unusual changes in metrics. Real-time dashboards and alerts keep executives informed with the latest insights, while integrations with platforms like Slack bring metrics straight into your team’s workflow - formatted for U.S. conventions. This seamless access to accurate, consistent, and actionable data empowers SaaS organizations to make smarter, quicker decisions without skipping a beat.
Related Blog Posts


