Business Intelligence
Trusted AI Analytics: How to Stop Your BI Tool from Making Up Numbers
Govern metrics once, run live warehouse queries with visible SQL/Python, and validate outputs to stop BI tools returning wrong KPIs.

If your AI BI tool can’t use approved metric rules and run live queries in your warehouse, it can give you polished answers with wrong numbers. That’s the core issue.
I’d boil the fix down to 3 controls:
- Define metrics once in a governed semantic layer
- Run every answer live in the warehouse with visible SQL or Python
- Validate outputs before they hit dashboards, reports, or exec updates
A wrong KPI is rarely random. It usually comes from one of these problems:
- the model picked the wrong join, filter, or date window
- different tools use different KPI definitions
- the answer came from cached data instead of a live query
- the write-up attached the wrong reason to the number
That matters because bad numbers spread fast. In the article, one data point stands out: 67% of organizations don’t fully trust the data they use for decisions. And one cited text-to-SQL finding says 81.2% of failures come from schema-level mistakes.
Here’s the simple version:
| Problem | What to do |
|---|---|
| AI guesses metric logic | Lock metrics in a semantic layer |
| AI answers from stale extracts | Query Snowflake, BigQuery, Redshift, or Postgres live |
| AI gives a number with no proof | Show the SQL or Python behind it |
| AI writes a slick but wrong summary | Add review, spot checks, and refusal rules |
I’d also keep rollout tight at first:
- start with 5–10 high-risk KPIs like ARR, NRR, churn, pipeline, and activation
- force clarification for vague terms like customers or conversion
- require explicit dates like August 6, 2026 or 2026-08-06
- gate executive dashboards with source checks, dbt test status, and owner sign-off
Bottom line: if you want AI analytics you can use, don’t spend your time trying to write better prompts. Fix the metric layer, make queries run live, and check the output before it spreads.
How Anthropic hit 95% accuracy on analytics queries (it wasn't a smarter model)

::: @iframe https://www.youtube.com/embed/KCuD8D1KaSM :::
sbb-itb-284a532
Where AI analytics breaks down in the stack
These problems show up before governance can step in and fix anything. From a user's question to a trustworthy answer, there are at least three spots where things can fall apart.
Schema ambiguity, SQL errors, and conflicting metric definitions
A table called opportunity may hold pipeline value. A table called subscription may hold contracted ARR. A column named amount may mean one thing in one table and something else in another. So when someone asks for ARR by segment for the last 12 months, the model has to guess the table, the field, and the filter logic.
That guess is where trouble starts.
The SQL may be syntactically valid and still semantically broken. In plain English, it can run without errors and still return the wrong answer. One analysis of text-to-sql failures found that schema-level errors account for 81.2% of failures, including wrong column selection and wrong metric logic. [1]
It gets messier when the same KPI has different definitions across tools. NRR may be calculated one way in a dbt model, another way in Looker, and a third way in a finance spreadsheet. If an AI BI tool indexes all three without one governed source of truth, it may mix those definitions together - or just grab the first one it finds.
That’s the heart of the problem: without a governed metric definition, AI keeps choosing among conflicting versions of the truth. And that’s why the same SaaS KPI can produce different answers in different tools.
High-risk SaaS metrics include ARR, NRR, logo churn, CAC, LTV, and payback period.
Answers that never run a real warehouse query
Some AI BI tools never touch your warehouse at all. Instead, they summarize cached visuals, pre-aggregated cubes, or CSV exports. If that happens, the output isn’t a live answer. It’s a cached guess.
If a tool is not compiling and executing SQL against live data in Snowflake, BigQuery, Redshift, or Postgres, then it is not answering from source data. That matters more than it might seem.
Say you ask what ARR was in July 2026. The tool may infer it from June’s figure or recycle a number from a dashboard someone viewed earlier, then return something like $21.3M with no actual calculation behind it. Meanwhile, stale extracts can miss late bookings, backdated cancellations, and FX adjustments.
Unchecked narratives that are not validated
Even when the metric itself is right, the explanation can still point people in the wrong direction. AI-written narratives often sound sharp and certain, even when no one has checked them.
A summary may claim that growth was mainly driven by new logo acquisition in the mid-market segment, when 80% of the ARR lift actually came from upsell to existing enterprise accounts. The number may be fine. The story around it may not.
Causation is where this gets especially risky. AI may decide that a price increase caused higher churn because both happened in the same quarter. But that skips over other factors like product issues, macro shifts, or segment mix. It also tends to leave out caveats, like one large renewal that skewed the quarter.
So yes, the number may be right; the explanation still may not be. A trustworthy BI system has to validate the story, not just the number. [2][3]
| Failure point | What goes wrong | Business impact |
|---|---|---|
| Schema ambiguity | The model picks the wrong table, join, or column | Valid-looking SQL returns the wrong metric |
| Conflicting metric definitions | dbt, Looker, Hex, ThoughtSpot, and spreadsheets define KPIs differently | Teams get different answers to the same question |
| No live warehouse execution | Answers come from cached data or CSV exports | Numbers lag reality; late-quarter changes are invisible |
| Unsupported narrative | The summary assigns the wrong driver or implies causation | Decision-makers act on the wrong driver |
Fix the foundation: governed metrics, semantic layers, and live warehouse execution
::: @figure 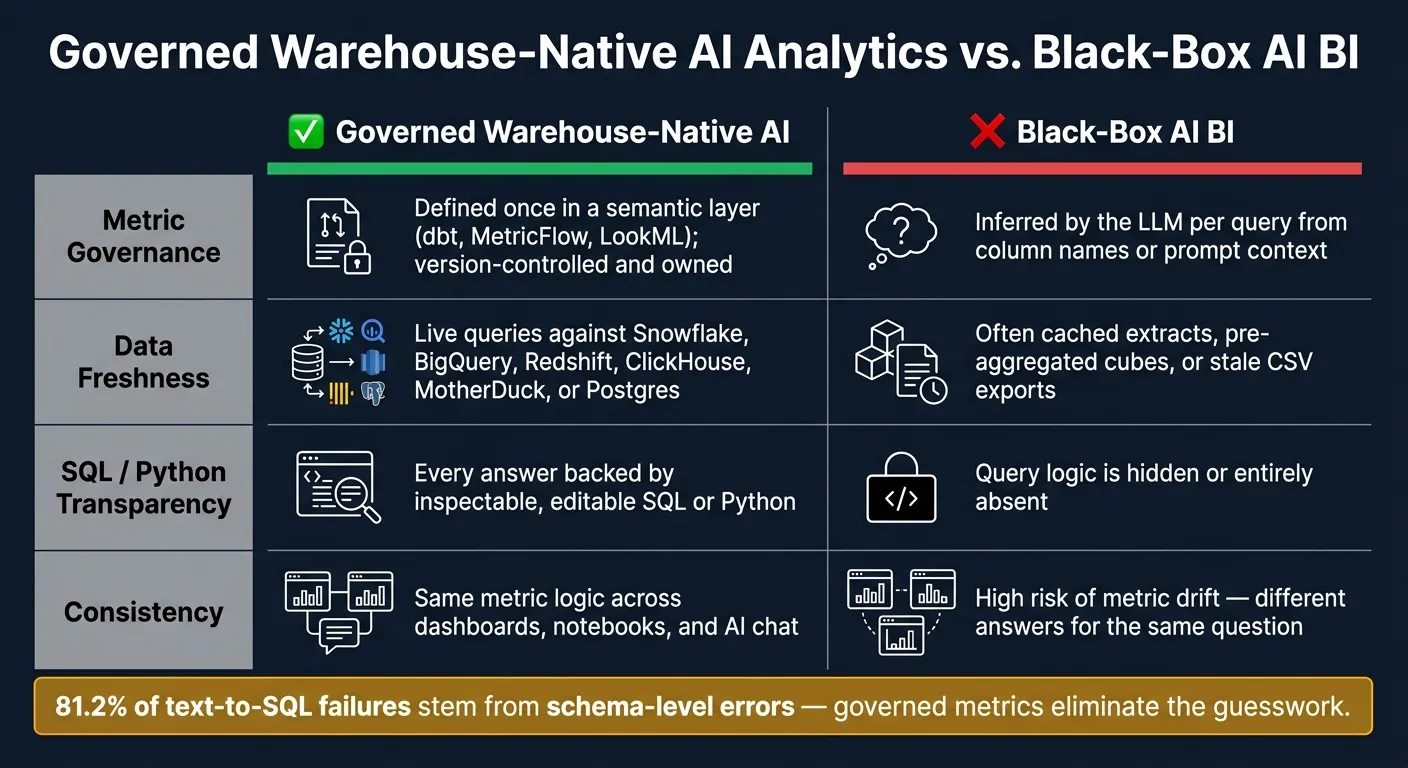 {Governed AI Analytics vs. Black-Box AI BI: Key Differences}
:::
{Governed AI Analytics vs. Black-Box AI BI: Key Differences}
:::
Once you know where AI fails, the fix is pretty direct: route every answer through governed logic and live execution. Fabricated numbers usually happen for one reason. AI doesn't have a trusted source of truth, so it starts guessing metric formulas, joins, and filters.
Define metrics once in a governed semantic layer
A governed semantic layer defines each metric once: formula, dimensions, and approved joins. Then it makes every BI tool and AI interface use that same logic.
Platforms like dbt Semantic Layer with MetricFlow let teams define metrics, entities, and dimensions in YAML, then generate consistent, grain-aware SQL at query time. LookML in Looker works in a similar way. Views, explores, and measures are declared in code, stored in Git, and reused across dashboards and AI queries. In both setups, the same logic applies whether the question comes from a dashboard, a notebook, or a natural language prompt.
Start with the metrics that matter most: ARR, NRR, logo churn, activation rate, and monthly active users. Each one should have a clear owner, usually someone in finance, revenue operations, or analytics, who controls the definition and approves changes through pull request. If a formula changes, that change should trigger a review, an impact check across dependent dashboards, and a deployment with release notes. That kind of control stops a quiet change to "active user" from showing up later in board reporting.
A field study on semantic layers reported a 71% reduction in cross-departmental data inconsistencies, 64% faster time-to-insight, and a 30–50% reduction in redundant modeling work after teams centralized definitions and access controls in a semantic layer. [4]
But definitions alone won't save you. The answer still needs to run against live warehouse data.
Require live warehouse queries and inspectable SQL or Python
If an AI-generated metric answer isn't backed by executed SQL or Python, don't trust it.
Every answer should come from a real query running against live data in Snowflake, BigQuery, Redshift, ClickHouse, MotherDuck, or Postgres. Live queries pick up late bookings, backdated cancellations, and mid-quarter adjustments. Cached extracts don't.
Inspectable SQL or Python is what makes the whole thing auditable. An analyst should be able to open the query, read the joins, check the filters, and reproduce the result in their own tool. At that point, the answer is no longer a black box.
Querio's governed context layer uses this approach directly. Metric definitions, approved join paths, and business terms are encoded in the context layer. So when a user asks, "What was NRR by segment last quarter?", the AI uses the right NRR formula, joins the correct dimension tables, and runs the query live against the warehouse. The SQL or Python is fully visible, so analysts can inspect it, edit it, and run it again. No CSV exports. No shadow datasets.
That shift in architecture is what separates grounded analytics from black-box BI.
Comparison table: governed warehouse-native AI analytics vs. black-box AI BI
| Dimension | Governed warehouse-native AI | Black-box AI BI |
|---|---|---|
| Metric governance | Defined once in a semantic layer (dbt, MetricFlow, LookML, or a governed context layer); version-controlled and owned | Inferred by the LLM per query from column names or prompt context |
| Data freshness | Live queries against Snowflake, BigQuery, Redshift, ClickHouse, MotherDuck, or Postgres | Often cached extracts, pre-aggregated cubes, or stale CSV exports |
| SQL or Python transparency | Every answer is backed by inspectable, editable SQL or Python | Query logic is hidden or entirely absent |
| Consistency | Same metric logic across dashboards, notebooks, and AI chat | High risk of metric drift - different answers for the same question depending on who asks |
Governed definitions and live queries are the base layer. Next comes prompt and dashboard guardrails.
Add guardrails for prompts, dashboards, and automated insights
Governed metrics and live warehouse queries fix the foundation. Guardrails deal with the last mile, where things often go wrong: vague prompts, unsupported claims, and outputs nobody reviewed. That’s the point where a correct dataset can still turn into a bad call.
Prompt rules that cut ambiguity and block unsupported claims
Most made-up numbers don’t start with broken models. They start with fuzzy prompts.
Say a sales leader asks What's our average revenue per customer last quarter? Without guardrails, the AI has to guess what customer means. It may mix billing accounts with free trial users, ignore the governed MRR formula, and return an inflated number that lands in a weekly executive email. [8]
Use three rules:
- Approved metric vocabulary with forced clarification: The AI should only resolve terms that exist in your governed catalog, like
MRR,Net Revenue Retention, andActive Users. If a term doesn’t map to an approved metric, or if a word likecustomers,users, orconversioncould point to more than one semantic entity, the AI should ask for clarification instead of guessing or quietly picking one. - Block unsupported forecasting prompts: Prompts like
What would happen if we doubled prices tomorrow?orPredict next quarter's churnshould be blocked unless there’s an explicit, governed forecasting model behind the answer. [8] - Require explicit date ranges and time zones: Use clear U.S. date formats in prompts and generated queries, such as
August 6, 2026or2026-08-06, instead of vague phrases likelast month. Define terms likelast quarterso the AI uses the same window every time. And require a named time zone, such asAmerica/New_York. [11]
In Querio's governed context layer, approved metric names, definitions, grain, dimensions, and constraints are encoded directly. So the AI either maps the request to governed metrics or asks for clarification instead of returning a close-enough answer.
Prompt controls stop bad questions at the source. Review steps catch bad outputs before they spread.
Review and validation steps for shared dashboards and reports
For high-impact dashboards tied to revenue, churn, or NRR, the fastest check is a source-table spot check. An analyst queries the underlying tables in Snowflake, BigQuery, Redshift, or Postgres and compares that result against the AI-generated metric for at least one representative time period. If the gap is more than 0.5–1%, that should trigger an investigation before the dashboard is shared. [6]
Pair that with dbt test status. If the datasets behind an AI-generated view have failing uniqueness, non-null, or referential integrity tests, the dashboard shouldn’t refresh for executive use. Showing a data quality status like All dbt tests passing as of August 6, 2026 gives reviewers a fast signal without sending them into the warehouse to check it themselves. [5][7]
For scheduled reports and executive dashboards, use a simple sign-off rule. A senior analytics owner reviews the logic, filters, and data sources, then marks the asset as approved before distribution. Also log every prompt, SQL query, dashboard change, and semantic or metrics layer version. If someone later challenges a number, you can trace exactly how it was produced. [9][10]
Lower-stakes reports can lean on automated regression checks against prior periods, while human review stays focused on the highest-impact executive assets.
Once these checks are in place for the highest-risk assets, the rollout can expand in phases across the rest of the BI stack.
Comparison table: unguarded AI BI vs. governed AI BI with validation
| Dimension | Unguarded AI BI | Governed AI BI with validation |
|---|---|---|
| Prompt control | Free-form prompts; AI fills in ambiguous terms | Approved vocabulary enforced; AI asks for clarification or refuses |
| Auditability | No log of prompts, queries, or metric versions | Full audit trail: prompts, generated SQL, semantic-layer version |
| Dashboard review | Numbers go directly to stakeholders | Sign-off required for executive assets; dbt test status displayed |
| Source validation | High risk of referencing wrong columns or stale data | Spot checks against source tables; tolerance bands enforced |
| Failure handling | Returns plausible numbers silently | Refuses unsupported claims; surfaces explicit errors |
| Decision risk | High - users act on misleading metrics | Low - results are inspectable and verifiable |
These controls are easiest to roll out in phases, starting with the highest-risk metrics, prompts, and executive dashboards.
A 90-day rollout plan for trustworthy AI analytics
Once governed metrics and prompt guardrails are in place, the rollout should start small. Focus first on the KPIs that carry the most risk. Over 90 days, the goal is simple: stabilize the metrics most likely to cause damage, connect AI to approved logic, and stop unvalidated answers from getting out.
Days 1–30: standardize metrics and find high-risk workflows
Start with 5–10 high-risk KPIs tied directly to revenue, churn, pipeline, and board reporting. For each one, write down the exact formula, grain, time logic, and source tables in Snowflake, BigQuery, Redshift, or Postgres.
Then look for places where that same metric is being calculated in different ways across dashboards, analyst workflows, or AI prompts. This is where things usually go sideways. Terms like "active account", "qualified lead", and "retained customer" often sound clear at first glance, but they can mean different things across product, finance, and customer success.
| Priority Metric | High-Risk Ambiguity to Resolve | Recommended Owner |
|---|---|---|
| MRR | Treatment of discounts, taxes, and cancellation timestamps | Head of Finance |
| Activation rate | Specific actions and time window, such as 7 days post-signup | Head of Product |
| Churn | Exact point of "loss" - end of period vs. cancellation date | Customer Success |
| LTV | Full formula, time horizon, and segment handling | Head of Marketing |
Before AI touches any of these tables, validate the inputs with primary-key, row-count, null-rate, and freshness checks.[13][12]
Days 31–90: connect AI to governed logic and add validation checks
After the metric definitions and source checks are stable, connect AI to the governed layer and add review gates.
Map each approved metric into a semantic layer for LLMs or context layer. In Querio, that means encoding metric names, formulas, grain, dimensions, and constraints directly in the governed context layer. So when someone asks a question, the AI either maps it to an approved metric or asks for clarification instead of guessing.
Also, require inspectable SQL or Python before any AI-generated answer is shared. That gives teams a way to check the work instead of taking the output at face value. Pair this with regression checks against prior periods and a final comparison against source tables or trusted dashboard totals for any dashboard tied to revenue, churn, or pipeline.
If a result shows an unexpected jump in pipeline, pause and verify the underlying record count in the warehouse before sending it out. It’s a simple step, but it can stop a bad number from spreading fast.
For executive dashboards and automated insight emails, validation should be mandatory before distribution. Duplicate detection needs extra attention here. Duplicates downstream can double-count totals and distort KPIs.[13] Automated dbt tests for uniqueness and referential integrity, gated on CI/CD promotion, help catch this before it compounds.[12]
FAQs
::: faq
How do I know if my AI BI tool is using live warehouse data?
Check whether it connects straight to your warehouse - like Snowflake, BigQuery, or Postgres - through read-only, encrypted credentials. You shouldn't need CSV exports, extracts, or copied datasets sitting somewhere else.
You can also confirm this by looking at the SQL or Python generated for each query. If you can inspect that code, you can see the tool is working against your live schemas instead of some disconnected black box. :::
::: faq
What should go into a governed semantic layer first?
Start with the business metrics that most directly shape day-to-day decisions, like revenue, pipeline, churn, and customer health.
First, take stock of the definitions you already have in dbt, LookML, or your data warehouse, and treat those as the source of truth. Then layer in the core pieces: business entities and join paths, metric definitions, a business glossary, metadata and lineage, and access rules. :::
::: faq
How much validation is enough before sharing AI-generated metrics?
Enough validation means your metrics live in a governed semantic layer with one shared definition, not a bunch of loose versions floating around. They should be checked automatically before anything runs, and every result should map back to SQL or Python your team can inspect.
That level of validation is enough when it happens all the time, not just during a one-off review. Your team should be able to spot anomalies, look into complex queries when needed, and trace every AI-generated number back to an approved formula in the warehouse. :::