Business Intelligence
Inspectable SQL vs Black-Box AI: Why It Matters for Business Intelligence
Use AI in BI only when it outputs editable SQL, runs on the live warehouse, and follows governed metric definitions.
The short answer
Use black-box AI for exploration and inspectable SQL for anything that becomes a shared metric. If ARR, NRR, churn or active users are defined inside a model's hidden reasoning, no one can verify or reproduce the number. Warehouse-native tools such as Querio, Looker and Omni keep the logic visible and versioned. The test is simple: can an analyst read the query, change one filter and re-run it?
What is black-box AI in business intelligence?
Black-box AI in BI describes an assistant that returns a number or chart without showing the query, joins or filters it used. The answer may be correct, but it cannot be reviewed, versioned or handed to a colleague to reproduce. Governance teams treat these outputs as unverified until the underlying logic is exposed.
If you can’t see the SQL, you can’t check the metric. That is the core issue for BI teams working with ARR, NRR, churn, active users, and other numbers that drive board reports, finance reviews, and day-to-day decisions.
Here’s the short version: I’d use AI in BI only when it shows editable SQL, runs on the live warehouse, and follows approved metric rules. If a tool gives me an answer without the query, source tables, or lineage, I can’t audit it, fix it, or explain it when numbers clash.
At a glance, this article comes down to four points:
Inspectable SQL shows every join, filter, and rule in plain view
Black-box AI gives answers without showing how it got them
This gap affects metric definitions, dashboard logic, anomaly checks, and ad hoc analysis
The safest setup is AI that uses governed metrics, warehouse permissions, and query logs
A small logic change can move a KPI by 5% to 15% or more, depending on the metric and time window. And when teams use more than one dashboard or notebook, mismatches often come from plain things like different date fields, stale models, or changed filters.
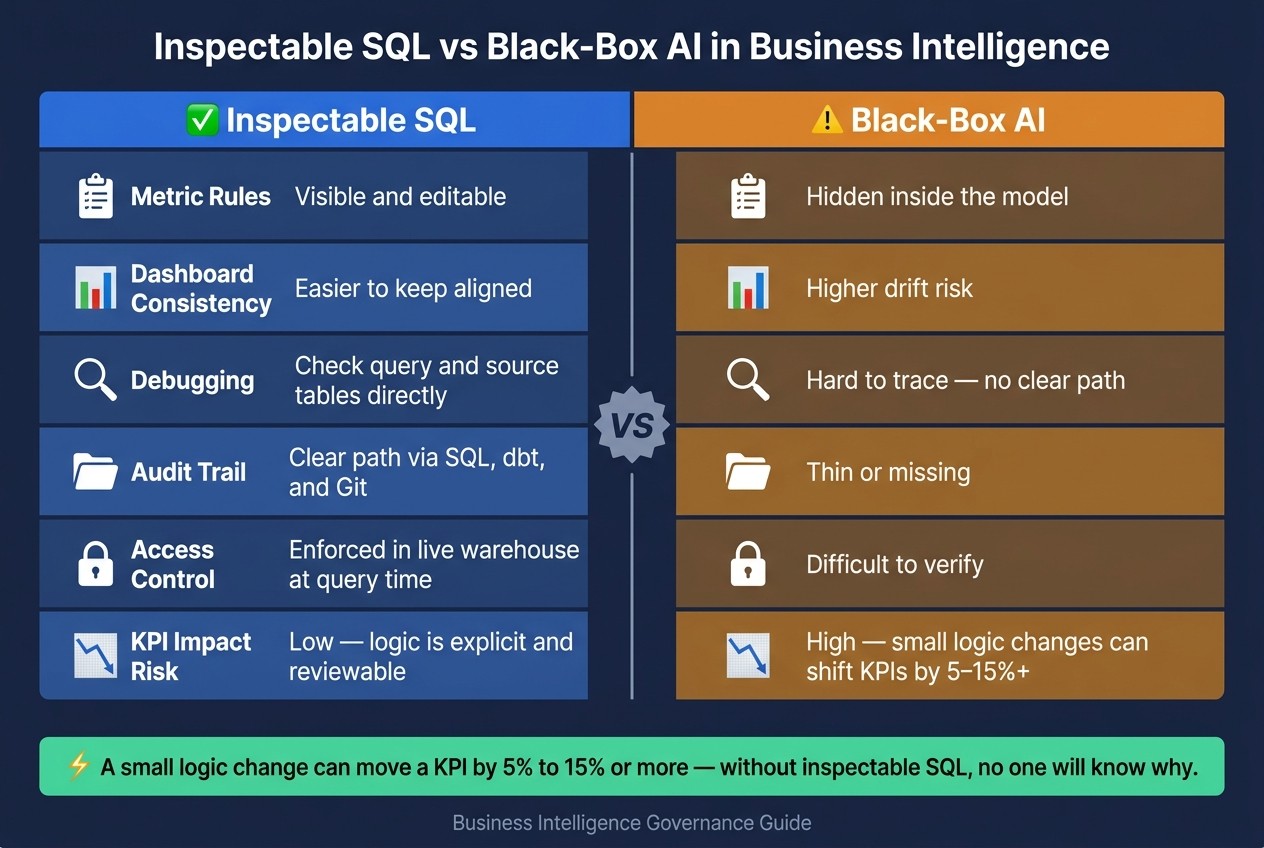
Inspectable SQL vs Black-Box AI in Business Intelligence
Quick comparison
Area | Inspectable SQL | Black-box AI |
|---|---|---|
Metric rules | Visible and editable | Hidden |
Dashboard consistency | Easier to keep aligned | More drift risk |
Debugging | Check query and source tables | Hard to trace |
Audit trail | Thin or missing | |
Access control | Applied in live warehouse | May be harder to verify |
Best AI use | SQL generation with visible code | Direct answers with no shown logic |
What I like about the article is that it does not frame AI as the problem by itself. The line is simpler than that: AI is fine when the logic stays visible. The risk starts when the output looks polished, but the team cannot see the joins, filters, metric definition, or tables behind it.
Inspectable SQL vs. black-box AI across core BI workflows
You see this gap in day-to-day BI work all the time: ARR reviews, sudden drops in active users, and those last-minute conversion questions from a revenue analyst right before Monday’s standup.
Metric definitions and dashboard logic: ARR, NRR, churn, and active users
The simplest test is this: does a metric mean the same thing in every dashboard?
When a BI team defines ARR in inspectable SQL, every choice is out in the open. You can see which contract table it uses, how it treats different contract terms, whether trial accounts are left out, and which date field drives the calculation. That SQL can live in dbt, go through pull request review, and feed Looker, Hex, or warehouse-backed dashboards with the same logic across the board.
A black-box AI tool might return an ARR number that looks right. But it won’t tell you if it used the approved model, an old table, or its own join logic. That gap matters when finance and revenue ops need to match numbers in a hurry.
The same issue applies to NRR, churn, and weekly active users. Each one depends on rules around inclusion, exclusion, and time windows. A black-box system can get those rules wrong without showing its work. With inspectable SQL, the rules are plain to see and easy to audit. With opaque AI, they stay buried inside the model.
Anomaly explanations and ad hoc analysis under deadline
That same visibility matters when something breaks and the team needs an answer NOW.
If CAC jumps or MRR drops out of nowhere, analysts have to dig in fast. With inspectable SQL, the path is direct: check the joins, verify the date range, and confirm whether a new customer segment got pulled in or left out.
Black-box AI can sound convincing when the clock is ticking. But if you can’t trace the answer back to a join or filter, it’s still a guess.
That’s where the gap shows up most clearly - in trust, speed, and governance.
Dimension | Inspectable SQL | Black-box AI |
|---|---|---|
Trust | Logic is explicit and can be checked against source tables | Answer may sound plausible, but its origin is opaque |
Speed to correct | Fast - edit the query, run it again, and confirm the fix | Slower - no clear way to see what changed |
Debuggability | Clear paths between metrics and warehouse tables | Relies on probabilistic inference; no clear path |
Governance fit | Audit trail exists; logic can be reviewed and approved | Hidden logic; hard to satisfy compliance or finance review |
Operational risk | Lower - changes move through version control in dbt and Git | Higher - outputs may vary across dashboards and notebooks |
How transparency improves trust, governance, and decision speed
Inspectable SQL matters because it lets a team trace a KPI from a dashboard back to the exact warehouse query and business rule. Instead of leaving metric logic buried inside an AI response, it puts that logic out in the open where people can review it. That matters most when a team needs to audit lineage or sort out a number mismatch.
Lineage, audit trails, and access control in Snowflake, BigQuery, and Redshift

In Snowflake, BigQuery, and Redshift, trust comes from being able to review the SQL, the dbt model, and the tables behind a KPI. That’s much easier in the warehouse, where access control only goes so far if the logic underneath stays hidden.
Snowflake, BigQuery, and Redshift all support role-based access control at the table and column level. But if an AI layer hides the SQL it used, it gets much harder to check which tables were queried or whether the calculation followed approved business rules. Hidden logic creates lineage gaps. And lineage gaps slow incident reviews and compliance checks.
When metric definitions are spelled out in SQL or dbt models, audit trails come from the work itself instead of being pieced together later. The test is pretty simple: can a reviewer see the SQL and lineage, or only the output?
Faster debugging when numbers disagree across dashboards and notebooks
That same transparency also cuts down debugging time. Dashboards and notebooks often disagree on the same metric. When the SQL is inspectable, analysts can compare queries, find the mismatch, and fix it fast. Maybe the date logic is different. Maybe one model changed while the other still hasn’t been refreshed.
With black-box AI, there’s no clear way to inspect the exact logic behind the answer. That makes root-cause analysis slower and less dependable. And when leadership is waiting on the number, even a short delay can hold up a decision.
Where AI helps safely in BI and where black-box risk starts
If inspectable SQL is the baseline, the next step is figuring out where AI helps without hiding the logic. In BI, AI is safe only when people can inspect how it got the answer. The moment it hides SQL, metric definitions, or source tables behind a polished response, risk starts to creep in.
Safe patterns: AI that generates visible SQL and uses governed metrics
The safest setup is simple: someone asks a question in plain English, and the tool generates editable SQL. The analyst can read the query, change it, and run it straight against Snowflake, BigQuery, Redshift, or Postgres. Nothing is sealed off. Nothing is magic. The logic stays out in the open before it ever reaches a dashboard.
That only works if the AI pulls from approved semantic definitions by default. Say your company defines an "active user" as a customer who triggered a qualifying event in the last 30 days. That rule should already live in the layer the AI uses. The SQL it generates should follow that rule automatically, not piece together a rough version from whichever tables seem close enough. Put plainly: the safest AI starts with approved definitions, not table-level guesswork.
That’s where a governed semantic or context layer earns its keep. It keeps the AI lined up with the metric definitions your team has already signed off on.
Another guardrail is live warehouse execution with no CSV exports. That means Snowflake, BigQuery, Redshift, and Postgres permissions stay in force at query time.
Unsafe patterns: hidden logic, inconsistent metrics, and automation bias
Trouble starts when AI gives you a number without showing the query or even the source tables. At that point, no one can check the join logic, date filter, or metric definition. A data leader has no way to know whether the AI used the approved churn definition or made up its own version on the fly.
There’s also the human side of this. Confident output can trigger automation bias, especially when a team is rushing to hit a deadline. If the number came from an AI that skipped the governed metric definition in your dbt model, then the business is now acting on logic nobody approved.
And when someone pushes back on that number? Things get messy fast. There’s no query to inspect, no lineage to trace, and no clear owner for the calculation.
That’s the key line here: derived results are not the same as AI inference. One can be checked. The other can slip in metric drift without anyone noticing at first. Once that happens, inconsistencies spread across dashboards, notebooks, and ad hoc reports.
These patterns separate AI that helps from BI workflows that still need to stay fully inspectable.
Pattern | What it looks like | Risk level |
|---|---|---|
AI generates editable SQL from governed metrics | Query is visible, runs on a live warehouse, and uses approved definitions | Low |
AI answers with visible code but no semantic layer | SQL is readable but may use inconsistent metric logic | Medium |
AI returns an answer with no visible query or source | No SQL, no lineage, and no way to confirm joins or definitions | High |
What to look for in BI tools that preserve control
Evaluation criteria for explainable, warehouse-native analytics
Once you know which AI patterns are safe, the next step is picking tools that apply those guardrails by default. That’s how you separate inspectable analytics from opaque AI.
The main test is simple: Can the tool show its work, run on live warehouse data, and stay aligned with governed metric definitions? If the answer changes based on how someone phrases a question, that’s a red flag.
One more must-have: query-level audit logs with the user, timestamp, and tables touched.
Criterion | What to require | Why it matters |
|---|---|---|
SQL/Python visibility | Every answer shows editable code | Analysts can verify and correct logic |
Live warehouse connection | Runs live against Snowflake, BigQuery, Redshift, or Postgres | Permissions stay enforced; data stays fresh |
Governed semantic/context layer | Uses approved metric definitions by default | Consistent numbers across dashboards and ad hoc analysis |
Audit logs | User, timestamp, and tables touched | Required for governance and debugging |
EXTRACTED/INFERRED tags | Answers tagged by logic origin | Teams know what to trust and what to verify |
Role-based access | Access controls enforced at query time | Sensitive data doesn't reach unauthorized users |
How Querio fits teams that need AI speed without losing governance
For teams standardizing metrics in dbt and the warehouse, these criteria are the line between useful automation and hidden logic.
Querio fits teams that want AI speed without giving up inspectable logic or warehouse control. When a business user asks a question, Querio generates inspectable, editable SQL and runs it directly against the live warehouse. Snowflake, BigQuery, Redshift, and Postgres permissions are applied at query time.
Metric consistency comes from a governed semantic and context layer, so AI-generated queries use approved definitions by default. That means non-technical users get answers faster, while data teams still keep control of the logic.
When to choose Querio — and when not to
Board and finance numbers must be reproducible: the generated SQL is visible, editable and saveable, so ARR or churn can be checked line by line.
You are consolidating conflicting metric versions and need one governed definition, imported from dbt or LookML, that applies to every generated query.
Review requires knowing which tables an answer touched: live read-only warehouse connections keep permissions and row-level security with the warehouse itself.
Numbers need to reach non-technical stakeholders with the logic attached, through Slack delivery or scheduled reports rather than a screenshot.
Where another tool is the better call:
Exploratory research where speed beats reproducibility: a general assistant on an extract is faster and nobody is going to audit it.
You already run Looker with disciplined LookML and dashboards nobody complains about: another layer buys you little.
Your bottleneck is data quality upstream, not query transparency: an observability tool or better pipeline testing addresses that instead.
How much does Querio cost?
Querio is $500/month on Starter for up to 10 users and $1,999/month on Core ($1,699/month billed annually), which includes unlimited users and three data connections. Enterprise — self-hosting or physical data separation — is quoted individually. AI usage is included with no per-question charges, there is a free trial, and the MCP/API tier is free for the first 100 questions a month. Competitor pricing models vary between per-seat, consumption and quote-only, so confirm current figures on each vendor's pricing page.
FAQs
How can you tell if a BI tool is truly inspectable?
A BI tool is only inspectable if it shows the exact SQL or Python behind its output. You should be able to review that code, edit it, and run it again before you finalize the analysis.
That matters for a simple reason: if you can't see the logic, you're being asked to trust a black box.
It should also rely on a governed semantic layer. That keeps metrics and business rules consistent across reports, and it gives teams a way to validate how numbers are defined instead of guessing what's happening behind the scenes.
When is AI safe to use in business intelligence?
AI is a safer fit for business intelligence when it outputs inspectable, editable SQL or Python that data teams can check line by line.
That matters because teams need to audit what the system did, fix it when needed, and trace results back to the source.
For reliability and governance, the system should also be tied to a shared semantic layer. That means the same business logic, the same metric definitions, and the same access controls are used across the board against live warehouses like Snowflake or BigQuery.
When those pieces are in place, results stay verifiable instead of turning into a black box.
What causes the same metric to differ across dashboards?
The same metric can show different numbers across dashboards for a simple reason: teams often use different logic.
For example, Marketing and Finance might each have their own definition of active users or revenue. That’s where things start to drift.
AI tools can add another layer of confusion. Without a central semantic layer, one tool might read date boundaries one way, while another handles them differently. The same goes for joins. One query may use a left join, another an inner join, and now the numbers don’t match.
A governed semantic layer fixes that by keeping metric definitions the same everywhere.
Related Blog Posts
Replace your analyst with AI: what actually breaks and what gets better
Business Intelligence in the AI Era: A Complete Guide (2026)
What Is AI/BI? How AI Is Reshaping Business Intelligence Dashboards
Related reading


