Business Intelligence
Enterprise Data Strategy: A Practical Guide for the AI Era
Fix trust gaps, standardize semantic metrics, and govern access so AI and BI share one reliable warehouse source.

If your team can’t agree on MRR, pipeline, or forecast, adding AI will spread the same bad answers faster.
I’d boil this guide down to one point: before I add AI assistants or expand self-serve BI, I need one trusted set of metrics, clear owners, clean access rules, and a shared meaning layer across my warehouse tools. For a 100–500-employee B2B SaaS company using Snowflake, BigQuery, Redshift, or Postgres, that usually means I should fix trust gaps first, then standardize metric definitions, then roll out governed access.
Here’s the short version:
- Audit the current stack first: warehouse, source systems, dbt models, BI tools, metadata, and permissions
- Find the biggest trust gaps: stale tables, missing data, KPI conflicts, weak lineage, and loose access
- Rank use cases by value and risk: board KPIs first, then common BI, then lower-risk analysis
- Set clear rules for data quality, ownership, access, and metric definitions
- Use one semantic layer so dashboards, SQL, notebooks, and AI all read the same business logic
- Add light review steps for schema and metric changes so drift doesn’t spread
- Track results with measures like time to answer, dispute rate, usage, and failed AI runs
A few facts stand out. The guide focuses on companies with 100–500 employees, names 4 main warehouse options (Snowflake, BigQuery, Redshift, and Postgres), and points to 5 success signals: fewer metric questions, faster ad hoc work, trusted board KPIs, governed live data access, and more reuse across tools.
What I like here is the order: trust first, semantics second, access third. That keeps AI tied to live warehouse data without creating a new layer of metric confusion.
::: @figure 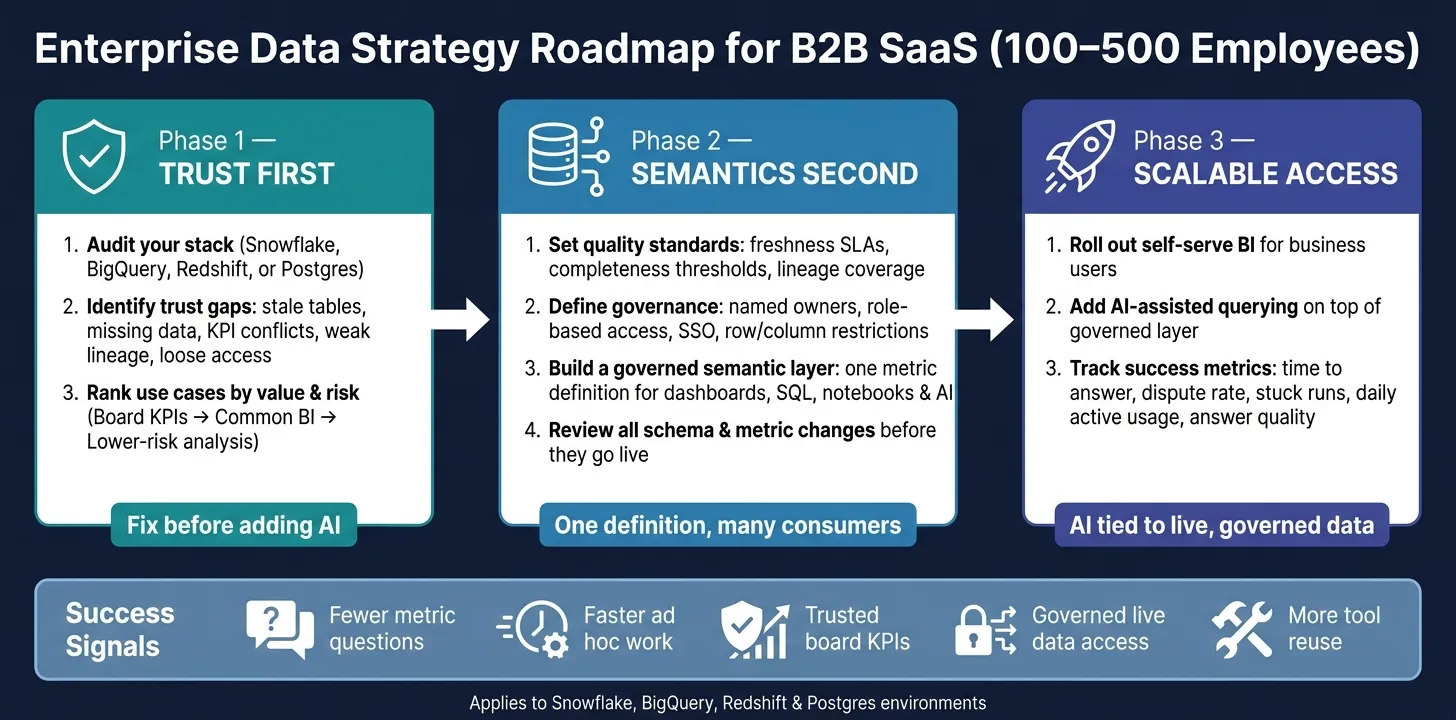 {Enterprise Data Strategy Roadmap: Trust, Semantics & Access for B2B SaaS}
:::
{Enterprise Data Strategy Roadmap: Trust, Semantics & Access for B2B SaaS}
:::
Keynote: What Makes Enterprise Data Ready for AI Agents?
::: @iframe https://www.youtube.com/embed/CYCCafo5vQ8 :::
Assess your current data environment before choosing tools
Before you look at tools, map the data setup you already have: your warehouse, source systems, transformation layer, BI layer, metadata, and access controls. That baseline shows where AI-ready analytics already works and where it falls apart. Start with the stack your team uses today, then trace which data sets and metrics drive business decisions.
Audit your core stack and system of record
Confirm which warehouse you run - Snowflake, BigQuery, Redshift, or Postgres - and which reporting and modeling tools sit on top, such as dbt, Looker, Hex, or ThoughtSpot. Then pin down which tables and metrics act as the system of record for your core KPIs. The goal is simple: an analyst and an AI assistant should land on the same answer.
Next, identify your most-connected tables and metrics. If those aren’t governed well, every downstream dashboard and AI query inherits the same confusion. Fix those first.
It also helps to separate documented lineage from inferred relationships during your metadata and lineage review. That makes metric meaning and ownership clear for both people and AI systems using a semantic layer. And if AI will touch sensitive data, make sure your permissions and retention policies actually support that use case [3].
Once the stack is mapped, the next step is figuring out where trust breaks most often.
Find the highest-impact trust gaps
The costliest trust gaps are the ones that slow decisions or make AI assistants unsafe to use. Look for:
- Inconsistent freshness
- Incomplete tables
- Conflicting KPI definitions
- Unclear lineage
- Weak permissions
These are the issues that get in the way of reliable analytics and AI.
A simple way to spot them is to ask a data analyst, a sales leader, and a finance manager to define your top five KPIs on their own. Where those answers split, that’s where your trust gaps are.
Then rank those gaps by the decisions they affect most.
Rank use cases by business value and risk
Once you know where trust breaks, don’t try to clean up everything at once. Rank use cases by two things: how often the metric gets used and how bad it would be if the answer were wrong.
Executive KPI reporting usually sits at the top of both lists: high frequency and high stakes. Self-serve BI and other common reporting workflows come next. Lower-risk internal analysis is often the best place to learn once core metrics are stable.
Start there before you expand self-serve BI or AI access. Those priorities shape the governance and semantic work that comes next.
Build the foundations: quality, governance, metadata, and semantics
Once you know which trust gaps do the most damage, you need a base that makes analytics and AI dependable: quality, governance, metadata, and a semantic layer. Miss even one, and the whole setup gets shaky.
Set quality standards for freshness, completeness, and lineage
Set freshness SLAs, completeness thresholds, and lineage coverage rules for the tables behind your KPIs. Separate source-derived values from AI-derived values, and add confidence tags so people and AI systems can judge how much weight to give a number right away [2].
When the data becomes measurable, the next move is simple: assign ownership and set access rules.
Define governance with ownership and access boundaries
Governance comes down to two things: who owns the data, and who gets access to it.
Every critical dataset and metric should have a named owner, whether that's a person or a team. That owner is on the hook for accuracy and for stepping in when something breaks. Access boundaries should use controls like SSO, role-based permissions, and row- or column-level restrictions where needed. For sensitive workflows, ZDR and SOC 2 Type II help set the trust baseline [1][3].
Standardize business meaning in a governed semantic layer
A lot of data plans stop at metadata and never get to business meaning. That's where problems start. Metadata and catalogs tell you how data is structured. A governed semantic layer defines business meaning once, then reuses it across dashboards, SQL, notebooks, and AI assistants.
Querio fits into this layer by keeping metric definitions consistent across SQL, notebooks, dashboards, and natural-language questions. At the same time, generated SQL and Python stay inspectable and editable. That's what makes self-serve BI and AI assistants safe to use at scale.
With those definitions in place, the next step is to expose them through self-serve BI and AI assistants without duplicating logic.
Put the strategy to work for self-serve BI and AI assistants
Once your definitions are in place, the work moves to change control, access, and measurement. And with AI assistants in the mix, small metric changes can spread fast. That’s why change control matters just as much as the definitions themselves.
Create review workflows for metric and schema changes
Metric drift gets expensive fast, and it’s often hard to catch. When KPI definitions, fields, or joins change, dashboards and AI-generated answers can drift away from what’s actually in the data without anyone noticing right away.
A semantic layer stays dependable only when schema and metric changes move through it. Treat every KPI, field, or join update as a versioned change. Before a new definition goes live, run a short review: does it conflict with an existing metric, who owns it, and is the underlying SQL inspectable and correct? Keep the loop light. In a 100–500-employee SaaS company, dbt pull requests plus semantic-layer review is usually enough.
For AI assistants, draw a firm line between explicit, governed relationships and relationships inferred on the fly. AI should use explicit, governed relationships first. If it has to infer a relationship, label the answer as lower confidence. That one step helps stop plausible-sounding but wrong answers from getting passed around.
That same review flow should feed every interface that reads the metric.
Support different user types without duplicating data
Don’t split metric logic by audience. Everyone should read from the same governed metrics. The moment you create separate definitions, you open the door to conflicting answers.
What should change is the experience, not the definition. Business users may ask questions using natural language querying or work from curated dashboards backed by approved metrics. Analysts may use notebooks with inspectable SQL and Python they can edit and reuse. Leadership may rely on scheduled reports built on that same live warehouse connection.
Querio supports this setup directly: the same context layer that governs joins and business definitions can power natural-language queries, notebooks, dashboards, and scheduled reporting. Because answers come from live warehouse data, teams can check the same metric in Snowflake, BigQuery, or Redshift without waiting for a stale export.
The next step is showing that these shared definitions are improving both speed and trust.
Measure success with clear metrics
If you don’t track the workflow, you can’t improve it. The most useful signals for self-serve BI and AI assistants are the ones tied to trust, speed, and reuse.
| Indicator | What it tells you |
|---|---|
| Time to answer | How quickly a user gets a reliable result |
| Stuck runs | Whether AI-assisted workflows are failing or getting off track |
| Metric and answer dispute rate | How often users need to correct or challenge a result |
| Rubric or answer quality | Whether the assistant is producing more trustworthy outputs |
| Daily active usage | Whether AI support is actually being adopted |
Start with a small set and track them the same way over time. If time to answer drops, stuck runs go down, and quality gets better, your governance and semantic workflows are working. Those signals also show where process gaps need tooling.
Choose the right tools and rollout plan
Pick tools after governance and semantics are set. The stack should back up those rules, not work against them.
How the main tool categories fit together
Here’s where each layer sits and the job it does.
| Category | Purpose | Strengths | Limitations | Best-Fit Use Case |
|---|---|---|---|---|
| Warehouse | Single source of truth for all analytics | Scalability, centralized compute | Cost scales with usage | System of record |
| Transformation (dbt) | Model and clean raw data | Version-controlled definitions | Requires SQL expertise | Core KPI modeling |
| Semantic layer | Metric consistency across tools | One definition, many consumers | Requires upfront modeling | Executive reporting, governed KPIs |
| Data catalog | Metadata and discoverability | Ownership, lineage, search | Becomes stale without curation | Onboarding, compliance |
| Data quality monitoring | Detect freshness and completeness issues | Catches problems before users do | Adds operational overhead | SLA tracking, pipeline reliability |
| BI layer | Governed self-serve for business users | Accessible to non-technical users | Can accumulate dashboard debt | Daily operational monitoring |
| Notebooks | Ad hoc analysis and exploration | Flexible, supports complex logic | Harder to govern at scale | Deep-dive analysis |
| AI assistant layer | Natural-language query layer | Speed and accessibility | Silent errors without governed context | SQL generation, quick lookups |
Where named tools typically sit in the stack
Once those categories are clear, you can map them to tools in a warehouse-native setup.
Snowflake, BigQuery, and Redshift are the usual warehouse picks for companies at this size. Postgres is the production database, which means it holds live application data before that data lands in the warehouse. dbt takes raw warehouse data and turns it into consistent, versioned models. Looker keeps metrics governed through LookML across many dashboards. ThoughtSpot gives business users search-based self-serve without SQL. Hex is built for notebook-based work when analysts need to dig into exploratory or more complex analysis.
Querio connects right to your live warehouse and adds a governed context layer on top. That helps keep metric definitions lined up across dashboards and natural-language queries, while the SQL and Python remain inspectable and editable.
A phased rollout plan for a 100–500-employee SaaS company
After the stack is mapped, timing matters more than vendor choice.
- Trust first: Connect the warehouse and production database, add data quality checks, and assign owners to critical KPIs. Put access controls in place before more people start querying data.
- Semantics second: Use dbt to model your core tables. Then add a governed semantic definition for key metrics, whether that’s LookML in Looker, a governed semantic layer, or Querio's context layer. Run metric and schema changes through a light review before they go live. That review gate should control every downstream BI and AI surface.
- Scalable access third: Roll out self-serve BI for business users, then add AI-assisted querying on top of the governed layer. By that point, the base is already dependable.
That order keeps AI pointed at governed data instead of giving users fast answers they can’t trust.
FAQs
::: faq
Where should we start if our KPI definitions conflict?
Start with a cross-department workshop that brings together Sales, Marketing, Finance, and Product. The goal is simple: agree on a shared business language for the 3 to 5 KPIs that shape executive decisions.
Then put those definitions into a semantic or context layer. That keeps the logic versioned, reusable, and consistent across dashboards, queries, and AI insights. :::
::: faq
How do we know when our data is ready for AI assistants?
Your data is ready for AI assistants when you have a centralized semantic layer, governed access controls, and reliable live connections to your data warehouse.
In plain English: AI works best when it pulls from the same shared metric definitions your team already uses in BI and financial reporting. Not raw tables. Not one-off queries. Not someone's spreadsheet sitting in a folder no one trusts.
That’s the shift. You’re moving from basic data access to shared, audited metrics built on one set of logic.
If your team still stitches data together by hand, argues over whether a dashboard is right, or leans on shadow spreadsheets for core numbers, the groundwork isn’t AI-ready yet. :::
::: faq
What should a semantic layer define?
A semantic layer is the governed bridge between raw warehouse data and business-ready insights. It gives teams one shared way to define metrics, calculations, and entity relationships, so reporting stays consistent, self-serve analytics are more reliable, and AI-driven queries return the right answers.
It should define:
- Core metrics and how they’re calculated
- Canonical models and shared dimensions
- Joins and table relationships
- Clear business labels and descriptions :::