How to Improve Data Quality Your Playbook for Reliable Insights
Learn how to improve data quality with our actionable playbook. Discover how to diagnose issues, implement fixes, and build a culture of data excellence.
https://www.youtube.com/watch?v=qxpKCBV60U4
published
Outrank AI
how to improve data quality, data quality, data governance, data cleansing, data quality metrics
0bf36dc0-f461-4860-a623-99ccc56cbfc5

Improving data quality is less about a one-time cleanup and more about a fundamental shift in how you operate. It’s a continuous cycle with three key phases: assessing the current state of your data, fixing the issues you find at their source, and monitoring everything to ensure problems don't creep back in.
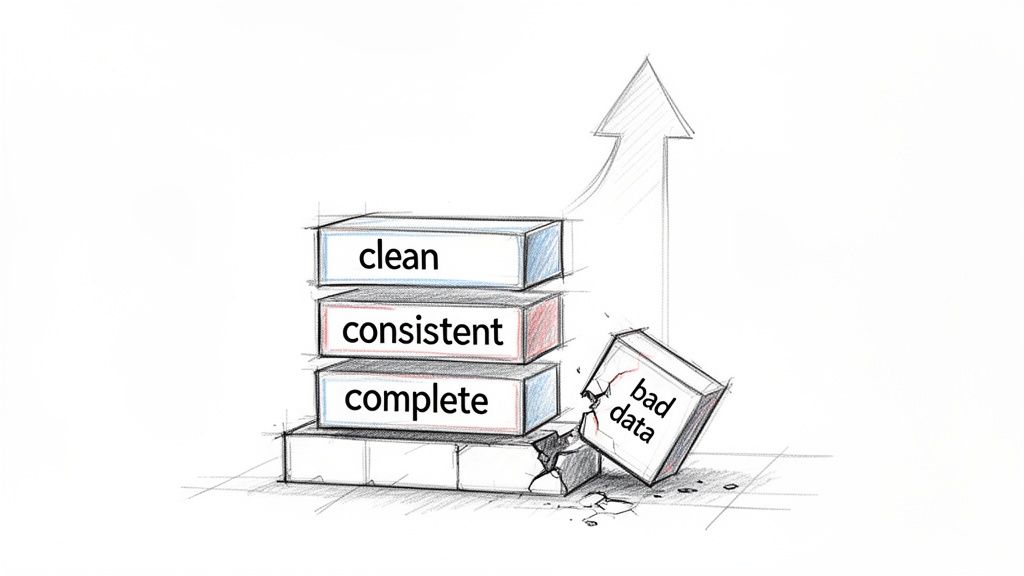
Why Data Quality Is the Bedrock of Growth
Bad data is a silent killer of growth. It chips away at everything you do, from financial forecasts and marketing campaigns to product roadmaps and customer support. When your data is inconsistent, incomplete, or just flat-out wrong, it creates a massive drag on the entire organization.
I've seen it time and again: highly skilled data teams get stuck in a reactive loop, spending their days manually cleaning up messes instead of driving strategy. They effectively become a "human API," endlessly verifying numbers and patching up reports. This isn't just inefficient; it's expensive and deeply demoralizing.
Worse, it completely erodes trust. When nobody trusts the data, decisions are made on gut feelings and intuition, not evidence. To break this cycle, you have to move from constantly fighting fires to building a proactive, automated system for data management.
The real problem is that most companies treat data quality as a chore, not a product. When you start treating it like a strategic asset, you build a reliable foundation that lets you scale and make decisions with real confidence.
The Six Core Dimensions of Data Quality
Before you can fix anything, you have to know what you're measuring. Data quality isn't just one thing; it's a collection of attributes. This quick reference guide covers the fundamental metrics everyone in your organization should understand.
Dimension | What It Measures | Example of a Problem |
|---|---|---|
Accuracy | Does the data reflect the real world? | A customer's shipping address is listed as their old, incorrect address. |
Completeness | Is all the necessary data present? | 25% of user profiles are missing a phone number. |
Consistency | Is the data uniform across different systems? | A customer is "Active" in the CRM but "Inactive" in the billing system. |
Timeliness | Is the data available when it's needed? | Sales data for Q2 is only available a month after the quarter ends. |
Uniqueness | Are there duplicate records? | The same customer appears three times in the database with slightly different names. |
Validity | Does the data conform to a defined format? | A "Date of Birth" field contains an email address. |
Think of these dimensions as your diagnostic toolkit. They give you a shared language for identifying, discussing, and ultimately resolving data issues.
A Modern Approach to Data Quality
The goal is to stop making ad-hoc fixes and build a reliable, automated system that builds trust and efficiency over the long term. This isn't just a backend technical concern; it's what enables advanced, high-stakes applications to succeed. For example, the reliability of modern AI health clinic solutions is completely dependent on the integrity of the underlying patient data.
This high-level workflow shows how the core pillars of a solid data quality strategy fit together.
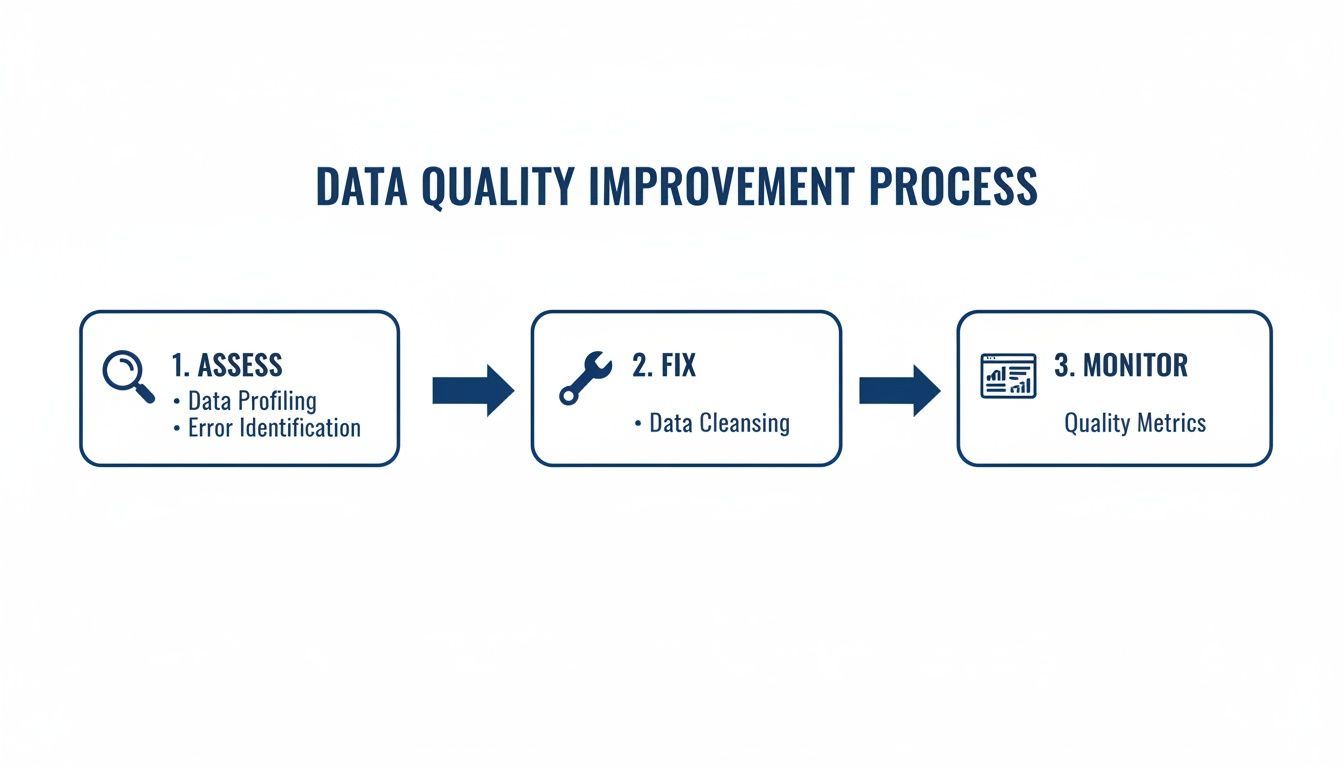
This isn't just theory; it's a continuous loop where you assess the health of your data, implement fixes, and establish monitoring to prevent future decay.
The data backs this up. A systematic review of healthcare studies found that targeted interventions improved data quality in 95% of cases. The most successful initiatives—a full 61%—were those that combined data quality reporting with personalized feedback, often supported by better IT tools and team training.
Ultimately, this playbook is about more than a technical checklist. It’s about building the strategic foundation you need to trust your own business decisions and empower your team to focus on what they do best: using data to drive real growth.
Conducting Your Data Quality Health Check
Before you can fix a data problem, you first have to understand its true size and shape. We’ve all heard the complaints—"the dashboard is wrong," "this customer list is useless"—but anecdotes don't drive action. To make real progress, you need to move from hearsay to a hard-and-fast baseline.
This is where a data quality health check comes in. Think of it as a diagnostic audit. The goal isn't just to find errors, but to quantify them in a way that shows their real-world impact. This gives you the evidence needed to prioritize what to fix first. Adopting proven 10 Quality Assurance Testing Methods I Wish I Knew Sooner is a great way to bring a systematic approach to this process and ensure you're not missing anything.
Profiling Your Key Datasets with SQL
The most practical place to start your audit is right in your data warehouse. Get your hands dirty with some simple, targeted SQL queries against your most critical tables. Focus on the datasets that matter most to the business—think user signups, customer orders, or financial reports. Don't boil the ocean; start small and build from there.
Here are a couple of real-world queries you can adapt to start digging for common quality issues.
Finding Null Values
Nulls are usually the easiest problem to spot, and they can be devastating. A high percentage of nulls in a critical field like an email address means you can't contact your customers, simple as that.
Let’s check the users table:
-- Calculate the percentage of null emails in the users table
SELECT
SUM(CASE WHEN email IS NULL THEN 1 ELSE 0 END) * 100.0 / COUNT(*) AS null_email_percentage
FROM
users;
A result of 15% tells a clear story: 15 out of every 100 users are ghosts in your system, at least as far as your marketing or support teams are concerned.
Identifying Duplicates
Duplicate records are notorious for wrecking analytics. They inflate user counts, mess up conversion rates, and can make your team look like they don't know what they're doing. This query will help you sniff them out.
-- Find email addresses that appear more than once
SELECT
email,
COUNT() AS occurrences
FROM
users
GROUP BY
HAVING
COUNT() > 1
ORDER BY
occurrences DESC;
Even finding a handful of duplicates is often a red flag, pointing to a deeper, systemic issue in how data is being captured or processed.
Uncovering Inconsistencies and Outliers
After you've dealt with the obvious nulls and duplicates, it's time to hunt for the trickier problems: data that looks valid on the surface but is contextually wrong. These are the silent killers that corrupt metrics without warning.
Format Inconsistency: Are your
countryfields a mix of "USA," "United States," and "US"? This kind of inconsistency makes accurate filtering and grouping nearly impossible.Logical Outliers: Do you have a
user_ageof 150? Or orders with a delivery date set for next year? These outliers can throw off your averages and financial forecasts completely.
A data quality health check is your reality check. It replaces assumptions with facts, providing the objective evidence needed to get buy-in from leadership and align your team on what needs to be fixed first.
Routine audits are a core practice in any serious data management strategy. Take The Global Fund's 2023 framework, developed with the WHO. They addressed huge data challenges by implementing routine audits and clear improvement plans. By baking real-time analytics into their systems, they drastically cut validation errors and improved how funds were allocated on the ground.
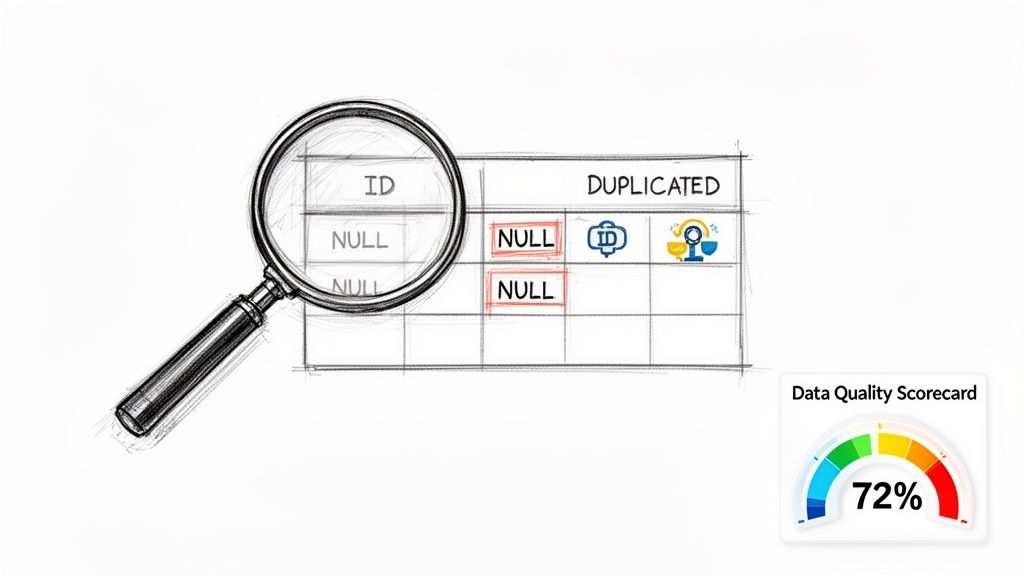
Creating a Data Quality Scorecard
Once your queries have surfaced the issues, you need to present them in a way that everyone can understand. A Data Quality Scorecard is the perfect tool for this. It’s a simple document or dashboard that translates technical findings into tangible business impact.
A good scorecard should clearly lay out:
The Dataset: The table you’re measuring (e.g.,
customers).The Quality Dimension: The specific attribute you tested (e.g., Completeness, Uniqueness).
The Metric: The exact measurement used (e.g., Percentage of null
phone_numbers). To learn more, check out our guide on essential data quality metrics and their examples.Current Score: The result from your query (e.g., 22% null).
Target Score: The goal you're aiming for (e.g., < 5% null).
Business Impact: A short, sharp explanation of why this matters (e.g., "Prevents sales outreach to a quarter of our leads.").
This scorecard elevates your audit from a dry list of technical problems to a compelling business case. It gives you that clear, data-driven picture of your current state, which is the non-negotiable first step in any real effort to improve data quality.
From Audit to Action: Fixing and Preventing Data Quality Issues
You've completed your audit and have a clear, evidence-based list of data quality problems. This is where the real work begins—and frankly, it's the most satisfying part. Now you get to roll up your sleeves and actually fix things.
Our approach isn't just about a one-time cleanup. That’s like mopping the floor while a pipe is still leaking. We need to do both: clean up the existing mess and, more importantly, fix the leak to stop bad data from getting in. This is how you escape the endless cycle of firefighting and build a truly reliable data platform.
Cleaning Up the Mess: Practical Fixes for Common Issues
Before you can focus on prevention, you have to deal with the damage that's already been done. But don't try to boil the ocean. Start with the high-impact, high-visibility issues you found in your data health check. Here are a few battle-tested recipes for the usual suspects.
Standardizing Inconsistent Categories
This one is a classic. You’ll find categorical fields like country or state with all sorts of variations: "USA," "U.S.A.," and "United States" all in the same column. Good luck trying to run an accurate geographic analysis with that.
The fix is surprisingly simple: create a mapping table. Think of it as a decoder ring for your data. This table has just two columns, like raw_value and standardized_value, and acts as the single source of truth.
Then, in your data transformation logic, you just join your messy table to this mapping table. It's a quick win that instantly cleans up your location data and makes it usable.
De-duplicating User Records
Duplicate records are a nightmare. They inflate user counts, skew engagement metrics, and create a ton of confusion. You might have one user registered as john.doe@email.com and another as johndoe+alias@email.com. To your system, that’s two people. In reality, it's one.
The first step is always to define what makes a user unique. Is it just the email? Or a combination of name and phone number? Once you have that rule, you can write a script to hunt down the duplicates.
A typical workflow is to group records by your unique identifier (like the email address, stripped of any aliases) and then merge them. You pick one record to be the "master" and combine all activity from the duplicates before archiving them. For a deeper dive, check out our guide on how to clean up data effectively.
Imputing Critical Missing Values
A null order_total can completely derail your financial reporting. While you can't invent data out of thin air, you can sometimes use statistical imputation as a stop-gap. For instance, you could fill a null order_total with the average order value for that specific customer segment.
A word of caution: Imputation is a powerful tool, but it needs to be handled with care. If you impute a value, always add a boolean flag like
is_imputedto that row. This ensures everyone knows which numbers are real and which are estimates, maintaining trust and transparency in your analysis.
Building Defenses to Stop Bad Data at the Source
Cleaning up historical data is necessary, but building a strong defense is what creates long-term value. The most effective way to improve data quality is to stop bad data before it ever makes it into your warehouse.
Enforcing Schema Constraints
Your first line of defense is right in your database schema. Use the built-in constraints to enforce the most basic rules of the road.
NOT NULL: The absolute bare minimum. If a
user_idis essential for joining tables, it should never, ever be null.UNIQUE: Perfect for business keys like
emailorusername, this ensures no duplicates can ever be inserted.CHECK: Lets you define custom rules. A simple
CHECK (order_value > 0)constraint can prevent nonsensical negative order totals from ever being recorded.
Think of these constraints as bouncers at the door of your database, turning away any data that doesn't meet the dress code.
Adding Data Tests to Your Pipelines
For more complex business rules, your ETL/ELT pipeline is the perfect place to build a wall of validation. This is where you can catch the trickier issues that schema constraints can’t handle.
Tools like dbt (Data Build Tool) make this incredibly easy. You can write simple data tests directly in YAML files that run automatically every time your data is transformed. For example, you can add a test to ensure every order_id in your payments table has a corresponding record in the orders table (this is called referential integrity).
If a test fails, the pipeline run can be configured to stop dead in its tracks, alerting your team to the problem immediately. This shifts your data quality efforts from a manual, after-the-fact chore to an automated, proactive system that catches issues upstream—long before they ever reach a dashboard and mislead a decision-maker. This is the cornerstone of any mature data quality program.
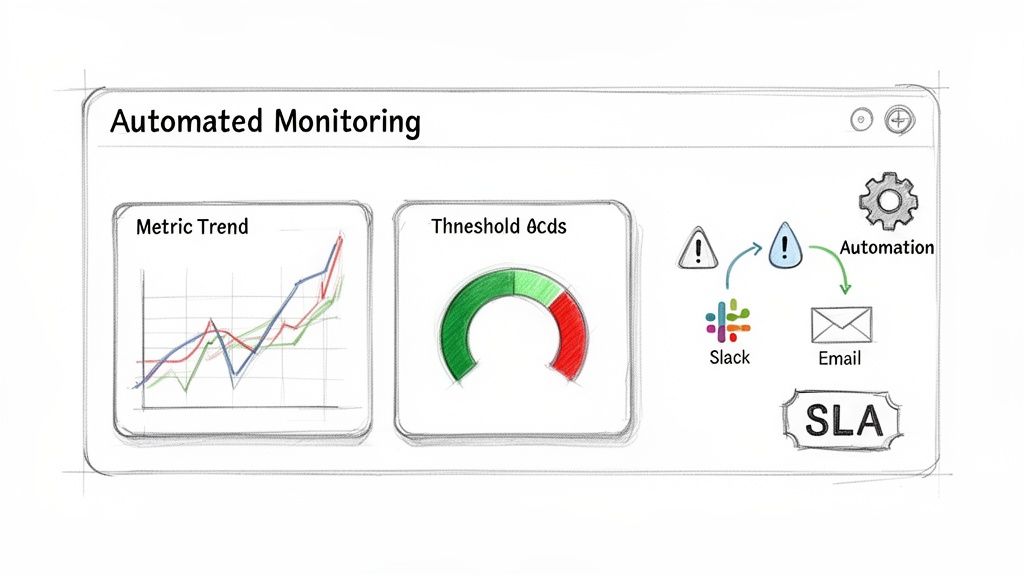
Establishing Automated Monitoring and Alerts
Fixing all those historical data issues feels good, but that’s really only half the job. The true win is building a system that keeps your data clean from this point forward. After all, data quality isn’t a one-and-done project; it’s an ongoing discipline. This is where you shift from being a reactive cleanup crew to a proactive guardian of your data assets.
By setting up automated monitoring, you’re essentially building an early-warning system. This system works around the clock, checking that the quality standards you've worked so hard to define are actually being met. It’s the difference between finding out about a critical data issue months after the fact and catching it within hours of it happening.
Turning Audits into Always-On Tests
Remember those SQL queries you wrote for your initial data health check? Don’t throw them away. They’re the perfect building blocks for your new monitoring system. Instead of running them manually once a quarter, you’ll set them up to run automatically—every day, or even every hour for your most business-critical datasets.
Most modern data platforms have built-in schedulers that let you run queries and trigger actions based on the results. This is how you turn those simple diagnostic scripts into a powerful suite of active data quality tests.
Here are a few examples of tests I've seen work well:
Freshness Checks: A simple test that verifies your
orderstable has actually received new data in the last 24 hours. If it hasn't, you know something upstream is broken.Volume Checks: A test that flags a sudden, drastic drop (say, >50%) in the number of daily user signups. This could point directly to a bug in your tracking code on the website.
Distribution Checks: A test to make sure a field like
payment_methodstill contains the expected values ("Credit Card," "PayPal") and hasn't been polluted with new, garbage entries like "creditcard" or "NULL".
Automating these checks creates a safety net that catches problems before they can poison your analytics, mislead stakeholders, and erode the trust you've built.
Setting Up Smart and Actionable Alerts
A failed test doesn't mean much if no one knows about it. The next crucial step is designing an intelligent alerting system that notifies the right people, on the platforms they actually use, the moment an issue is detected. Just dumping every alert into a massive, ignored email inbox is a recipe for disaster.
Instead, think about routing alerts based on who owns the data or system.
For example:
If the
user_signupvolume test fails, ping the Product Engineering team on their dedicated#web-analyticsSlack channel.If a
customer_addressfield fails a validity check, automatically create a ticket for the Data Team in their Jira or Asana project.
The key is to make alerts specific, contextual, and sent directly to the team that can fix the problem. A great alert tells you what broke, why it matters, and where to start looking. This simple change can slash your resolution time from days to minutes. For more advanced setups, you can even explore AI-powered data validation to not only detect issues but also suggest potential fixes.
Your goal is to move your data team from being firefighters to fire marshals. Instead of constantly putting out blazes, they’re installing smoke detectors and sprinklers, preventing fires from ever starting.
Defining Data Quality SLAs and Dashboards
To make all of this official, you need to establish Data Quality Service Level Agreements (SLAs) for your most important datasets. Think of an SLA as a clear, documented promise about the expected quality of a specific data source.
An SLA might state that the customers table will have less than 1% null email addresses and that the data will never be more than 3 hours out of date.
This isn't just a corporate exercise; it’s a practice proven in high-stakes environments. The WHO's Data Quality Assurance (DQA) toolkit, for instance, helps countries routinely check health data for completeness, enabling far more reliable trend monitoring. In a similar vein, many healthcare RWD initiatives demand that critical fields exceed a 99% fill rate to ensure their analysis is sound. You can see how the WHO empowers data quality assurance in countries with these methods.
To bring these SLAs to life, build a Data Quality Dashboard. This dashboard acts as a real-time health monitor for your key data assets. It shouldn't be overly technical; it should be a simple, at-a-glance view for stakeholders that tracks your key metrics against their SLA targets. When a metric dips into the red, everyone sees it. This transparency creates shared accountability and makes data quality a visible, organization-wide priority.
Building a Culture of Data Governance
Let's be honest: all the automated tests and sophisticated tools in the world won't save you if your company culture doesn't treat data as a first-class citizen. You can patch up technical issues all day, but if people don't feel a sense of ownership over the data they create and use, quality problems will just keep popping up like weeds.
The most lasting fix for poor data quality isn't technical; it's cultural. This final piece of the puzzle is about weaving data governance into the very fabric of your organization. It’s about shifting from a model where a few engineers are the data police to one where every single employee is a stakeholder in data quality.
Establish Clear Ownership and Stewardship
It all starts with answering a question that surprisingly stumps most organizations: "Who owns this data?" Without a clear answer, accountability is just a buzzword. This is where you need to define and assign roles for data ownership and stewardship.
And no, they aren't the same thing. The distinction is critical.
Data Owners: Think senior leaders or department heads. They are ultimately accountable for the data in their domain. For example, the VP of Marketing owns all marketing automation data. They set the strategy and are the final word on data access and use, but they don't manage it day-to-day.
Data Stewards: These are your on-the-ground subject matter experts. A marketing operations manager would be the steward for that marketing data. They're responsible for defining business rules, validating the data's integrity, and flagging issues for the technical teams to fix.
By assigning these roles, you put a name and face to each dataset. Data quality stops being a vague, company-wide problem and becomes a set of clear, distributed responsibilities.
Create a Central Data Dictionary
You simply can't govern what you can't define. One of the most common reasons I see for bad data is simple miscommunication—two teams using the term "Active User" to mean completely different things. The solution is a central data dictionary.
This becomes the single source of truth for all your company’s metrics and data points. For every critical field, it should spell out:
Business Definition: What does this actually mean, in plain English?
Calculation Logic: The exact formula or query used to produce it.
Data Steward: The go-to person for questions or issues.
Data Source: The specific table and column where the raw data lives.
A data dictionary isn't just a technical spec sheet. It's a communication tool that gets everyone, from the C-suite to a brand-new analyst, speaking the same data language. This alignment is the bedrock of building trust.
Creating a catalog like this drives transparency and makes it infinitely easier for everyone to find, understand, and correctly use data. It's a cornerstone of effective information management and a key theme in our guide to data governance best practices.
Train Your Team and Champion Best Practices
Finally, a healthy data culture needs constant nurturing through education. You have to give every employee the context and motivation to care about data quality. This isn't a one-size-fits-all training session.
Your sales reps don't need to learn Python, but they absolutely need to understand why typing "USA" in one record and "United States" in another throws off the entire sales dashboard. Show them the direct line between their daily habits and the company's ability to make smart decisions.
Likewise, product managers need to know how to specify tracking requirements for new features so that the data they generate is clean from the start. It's staggering that while 80-90% of business data is unstructured and often riddled with errors, very few companies invest in this kind of practical, role-based training.
When you invest in education, you're not just creating rules; you're creating a shared sense of purpose. Data quality transforms from "the data team's problem" into everyone's responsibility and, ultimately, a source of collective pride. This is how you make great data quality a sustainable advantage, not a constant firefight.
Frequently Asked Questions
Even the best playbook can't cover every specific challenge you'll face on the ground. Here are some of the most common questions that come up when teams get serious about fixing their data quality, along with some straight-to-the-point answers from our experience.
Where Should I Start If My Data Is a Complete Mess?
Let's be honest: when you first lift the hood on your data, it’s almost always a mess. That's okay. The biggest mistake you can make is trying to clean everything at once—a surefire way to burn out and lose momentum.
Instead, zero in on a single, high-stakes business process. Forget the giant mess for a moment and pick the one KPI your leadership obsesses over. Let's say it's Monthly Recurring Revenue (MRR). Your mission is to find and profile only the datasets that feed that specific number.
You'll quickly uncover a handful of critical issues directly warping that metric, like duplicate subscriptions or null customer start dates. Focus all your energy on fixing just those problems. This approach gets you a quick, tangible win that proves the value of this work to the higher-ups. That success is the political capital you need to fund a wider data quality program.
Who Is Ultimately Responsible for Data Quality?
This is the classic "who owns it?" debate. The real answer is that data quality is a team sport, but every player needs a clearly defined position. The most effective way to structure this is by separating "ownership" from "stewardship."
Data Owners are senior leaders accountable for the strategic value of a data domain. The Head of Sales, for instance, owns all CRM data. They don't get into the weeds, but the buck stops with them.
Data Stewards are the hands-on subject matter experts. Think of a Sales Operations Manager as the steward for that same CRM data. They're the ones defining the business rules, validating entries, and working with engineering to get fixes implemented.
The data team’s job is to build and maintain the playground—the technical framework, the tests, the tooling. The business stewards then use that framework to enforce the rules for their domain. This partnership is what makes data quality efforts stick.
A common mistake is to make the data team solely responsible for quality. This fails because they lack the business context to define what "good" data even means for sales, marketing, or product teams.
How Do I Justify the Cost of This Initiative?
Getting buy-in for data quality means speaking the language of the business: cost and opportunity. Don't just ask for a budget; build a business case that makes the investment feel like a no-brainer.
First, calculate the "cost of bad data." Start by tracking the hours your analytics or ops teams waste every single week manually cleaning reports. Better yet, find a recent, painful example of a bad business decision made on faulty data and attach a dollar amount to the fallout. A $50,000 marketing campaign targeted at the wrong audience because of bad customer data is a powerful number.
Then, flip the script and talk about opportunity. Explain how messy data is the bottleneck blocking major projects like self-service analytics, AI initiatives, or personalization. You're not just asking for money to clean things up; you're showing leadership how this investment unlocks a higher level of performance and turns the data team from a reactive cost center into a proactive growth engine.
Ready to stop being a "human API" and empower your entire team with self-service analytics? Querio deploys AI agents directly on your data warehouse, enabling everyone to get answers without waiting for an analyst. See how Querio can transform your data culture.

