Business Intelligence
Best Conversational Analytics Platforms (2026)
Compare top conversational analytics tools for mid-sized B2B SaaS: governance, live warehouse queries, AI features, and pricing.
Querio, ThoughtSpot, Looker (Google Cloud), and Microsoft Power BI are the top platforms in 2026. They let you query live data warehouses in plain English, delivering SQL-driven insights instantly. These tools are especially useful for B2B SaaS companies (100–500 employees) managing small data teams and demanding quick, accurate insights.
Key Takeaways:
Querio: Best for fast, transparent, and governed analytics with inspectable SQL/Python outputs. Pricing starts at $500/month ($5,000 billed annually) for up to 10 users.
ThoughtSpot: Great for search-driven insights but comes with high costs and setup times.
Looker: Strong governance with LookML but requires technical expertise for setup.
Power BI: Ideal for teams in the Microsoft ecosystem but has steep costs for AI features like Copilot.
Quick Comparison
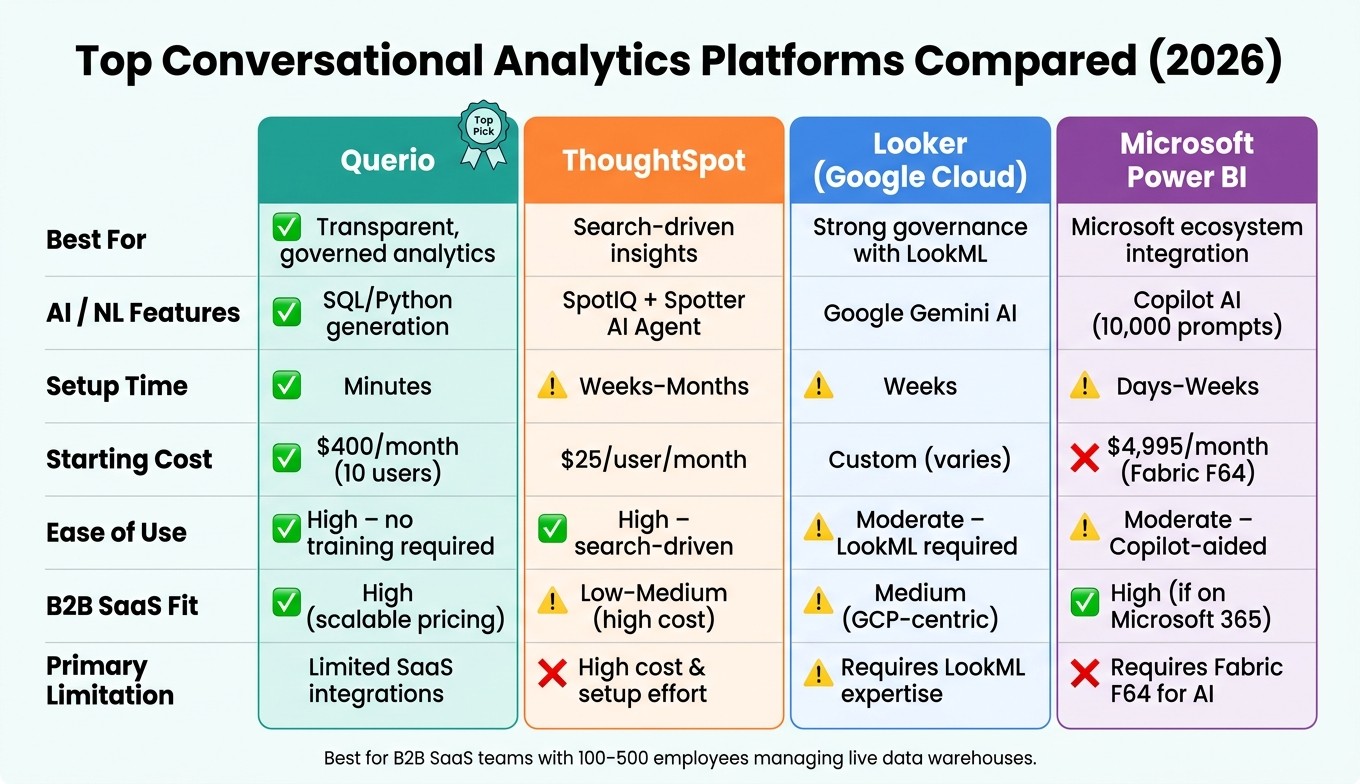
Platform | Best For | AI/Language Features | Setup Time | Cost (Starting) |
|---|---|---|---|---|
Querio | Transparent, governed analytics | SQL/Python generation | Minutes | $400/month (10 users) |
ThoughtSpot | Search-driven insights | SpotIQ, Spotter AI Agent | Weeks–Months | $25/user/month |
Looker | Strong governance with LookML | Google Gemini AI | Weeks | Custom (varies) |
Power BI | Microsoft ecosystem integration | Copilot AI (10k prompts) | Days–Weeks | $4,995/month (Fabric F64) |
Querio is the top pick for mid-sized B2B SaaS teams needing quick, transparent analytics without lengthy setups. If you're already using Microsoft or Google Cloud tools, Power BI or Looker might be more aligned with your stack. For search-first analytics, ThoughtSpot is a strong contender but comes with higher costs and longer implementation times.
Top Conversational Analytics Platforms Compared (2026)
1. Querio
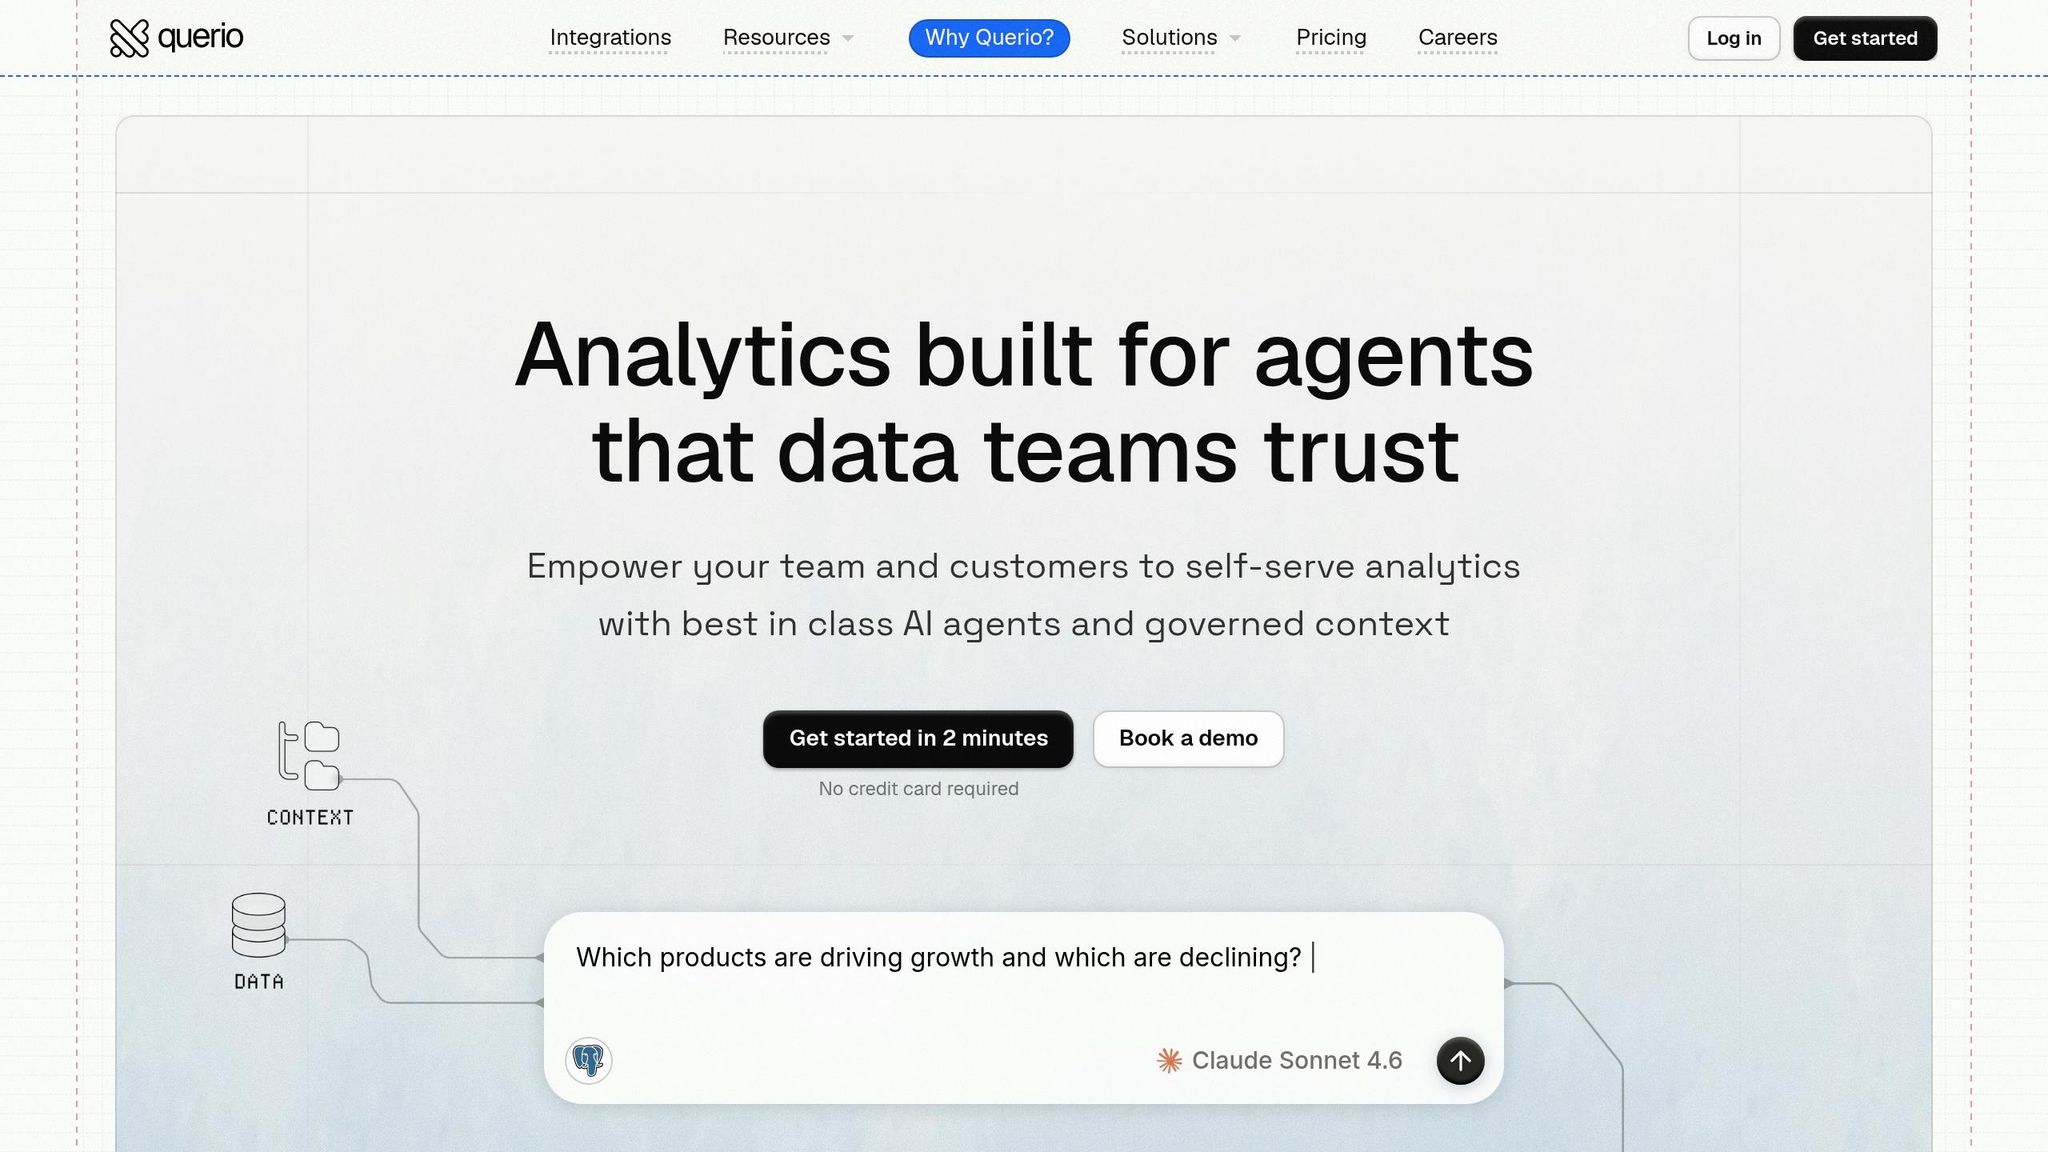
Querio is an analytics workspace designed for teams working with live data warehouses. It uses AI to let both analysts and non-technical users ask questions in plain English, generating answers through SQL or Python code. The best part? The process is fully transparent - no hidden black-box operations. Plus, setup takes just a few minutes. Here’s how Querio provides clear, governed, and live analytics for B2B SaaS data teams.
Natural Language Meets AI
Querio acts as a smart assistant for your database, converting plain-English questions into SQL or Python code that you can see and verify. Every answer comes with its query logic, making it reusable and easy to check. Beyond just descriptive and predictive analytics, Querio also supports trend forecasting, giving teams a way to look ahead with predictive insights [1].
Governance and Consistency
One of Querio’s strengths is its shared context layer, which ensures consistent definitions for metrics, joins, and business terms. This semantic modeling means you only need to define key metrics once, and they’ll stay consistent across all queries and dashboards. No more mismatched data or conflicting definitions.
Real-Time Warehouse Connectivity
Querio connects directly to your data warehouse using encrypted, read-only credentials, eliminating the need for manual exports or data duplication. Supported warehouses include Snowflake, BigQuery, Amazon Redshift, ClickHouse, PostgreSQL, MySQL, and SQL Server [1]. This live connection ensures decisions are based on the most current data. It also provides a governed audit trail, so every query is traceable. Additionally, Querio’s reactive notebook environment automatically updates downstream analyses whenever upstream logic changes, keeping everything aligned without extra effort.
Tailored for B2B SaaS Companies
Querio is built with 100–500-person SaaS companies in mind. Pricing starts at $500/month ($5,000 billed annually) for up to 10 users, with many plans offering unlimited users - helping teams avoid costly per-seat pricing as they grow. The platform also includes SOC 2 Type II compliance, role-based access controls, and SSO integrations for added security. For teams interested in embedding analytics into their products, Querio provides APIs and iframes, along with strong multi-tenancy features. Enterprise embedded pricing typically starts in the mid-five figures annually [7].
2. ThoughtSpot
ThoughtSpot stands out as a leader in search-driven analytics, offering users a simple, "Google-like" search interface. This design allows individuals to ask questions in plain English and instantly view visualizations - completely eliminating the need for SQL knowledge on the user’s end.
Natural Language and AI Capabilities
At the heart of ThoughtSpot’s search experience are two powerful AI-driven tools. The SpotIQ engine automatically scans datasets to uncover anomalies, trends, and patterns that might otherwise go unnoticed. As one user put it:
"SpotIQ is the standout feature for us. It automatically surfaces insights and anomalies that we would have missed manually. It's like having an extra analyst on the team." - InsightSeeker [5]
For those on Pro and Enterprise plans, the Spotter AI Agent takes analytics a step further by investigating metric changes and creating dashboards (called SpotterViz) from a single prompt.
Governance and Semantic Modeling
To ensure consistent metric definitions across an organization, ThoughtSpot uses a governed semantic layer. This layer is configured through the ThoughtSpot Modeling Language (TML), which some users find challenging to set up [5]. However, once in place, it ensures the delivery of accurate and reliable insights. Keep in mind, implementing this model typically takes 3 to 6 months [1].
Live Warehouse Connectivity
ThoughtSpot’s zero-copy architecture directly connects to cloud data warehouses like Snowflake, BigQuery, Redshift, and Databricks. This approach eliminates the need for data extracts. Its push-down query technology processes analytics directly within the warehouse, enabling lightning-fast response times - even with large datasets [5]. For example, WEX Field Service Management achieved a dramatic performance boost in early 2026, cutting report generation times from 5 minutes to under 3 seconds - a 30× improvement - while reaching a 65% AI adoption rate in just 90 days [7].
Tailored for B2B SaaS
ThoughtSpot’s pricing starts at $25/user/month (billed annually) for the Essentials plan (5–50 users) and $50/user/month for the Pro plan (up to 1,000 users). There’s also a usage-based option starting at $0.10 per query. For B2B SaaS teams looking to embed analytics into their products, the ThoughtSpot Everywhere product line is worth considering. It even includes a free Developer tier for up to 10 users for one year [5].
Next, we’ll dive into how Looker integrates with live warehouse environments and supports governed analytics.
3. Looker (Google Cloud Looker)
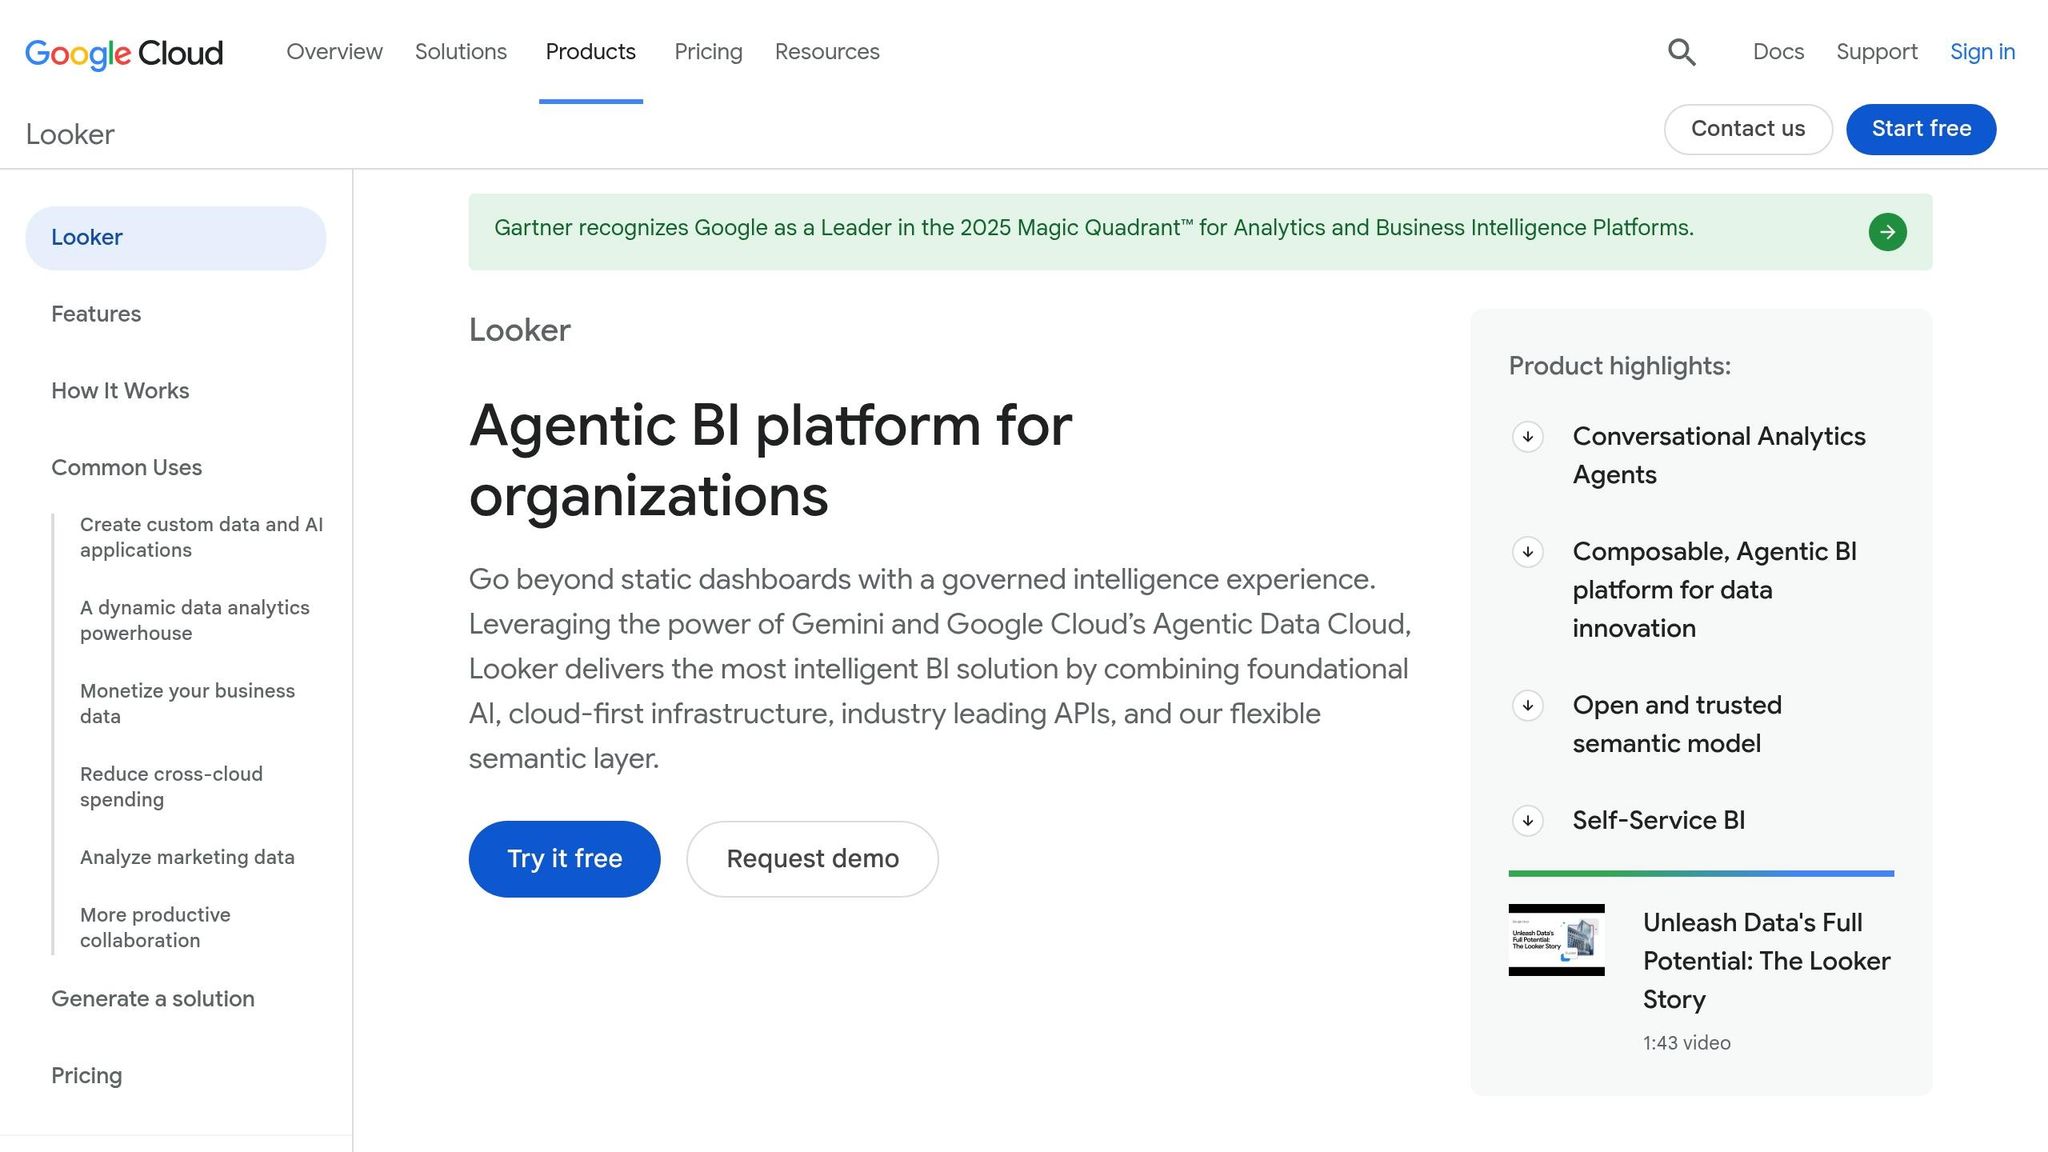
Looker, now part of Google Cloud, takes a different path compared to search-first platforms like ThoughtSpot. Its focus lies in strong data modeling, emphasizing governance and semantic structure as the backbone, with AI capabilities layered on top.
Natural Language and AI Capabilities
Looker integrates Google's Gemini, a large language model, to power its AI features. Gemini operates in two modes: Fast and Thinking, depending on the complexity of the query. Importantly, all queries are processed through LookML, Looker’s semantic layer, instead of accessing raw tables directly. This approach reduces errors by as much as 66%, whereas research from AtScale highlights that large language models can be over 80% error-prone when working directly with raw data models [2][3].
Governance and Semantic Modeling
LookML is often seen as the benchmark for governed metrics [5]. It provides a centralized, version-controlled system for analytics engineers to define and reuse metrics like MRR, churn rate, or activation rate. This ensures consistency and accuracy across all analyses. However, LookML does come with a steep learning curve, requiring dedicated analytics engineering expertise. For teams without technical resources, this can make the platform less accessible, and it may take time before non-technical users can fully leverage self-service capabilities [4].
Live Warehouse Connectivity
Looker connects directly to major data warehouses like BigQuery, Snowflake, and Redshift, ensuring all queries run on live data. Metrics such as revenue and churn are consistently defined at query time through LookML. This live connectivity is a key feature for teams that need real-time insights.
Fit for B2B SaaS
Looker offers three editions tailored to different needs: Standard (for smaller teams under 50 users), Enterprise (designed for larger internal BI deployments), and Embed (for SaaS products integrating analytics). However, its dependency on LookML can create operational challenges for smaller B2B SaaS teams, especially those without dedicated analytics engineers. While Looker excels in delivering governed, live analytics, teams just starting their data journey may find its self-service capabilities limited compared to platforms with simpler governance layers.
4. Microsoft Power BI
Microsoft Power BI has become a major player in enterprise BI, largely because it integrates seamlessly into the Microsoft ecosystem - a platform many businesses already subscribe to. As Summer Lambert from Zerve explains:
"Power BI dominates enterprise BI because the math works out... if you're already paying for Microsoft 365, the procurement conversation is trivial" [1].
This makes Power BI a natural choice for companies looking for a conversational analytics platform.
Natural Language and AI Capabilities
Power BI has upgraded its AI capabilities by replacing the older Q&A feature with Copilot, a more advanced AI interface. In February 2026, Microsoft significantly boosted Copilot’s prompt limit from 500 to 10,000 characters, allowing users to perform more intricate, multi-step queries. However, accessing Copilot requires a Microsoft Fabric F64 capacity, which starts at around $4,995 per month [1]. This pricing may pose a challenge for mid-sized B2B SaaS teams.
Governance and Semantic Modeling
Power BI’s governance features are powered by its DAX (Data Analysis Expressions) engine and its integration with Microsoft Purview, which provides tools for security labels, auditing, and sensitivity classifications. The reliability of Copilot’s responses heavily depends on the quality of the underlying semantic model. A well-designed model ensures accurate answers, while a poorly configured one can lead to inconsistent results [1]. While DAX is incredibly powerful for handling complex calculations, its steep learning curve is a common pain point for users [5][6].
Live Warehouse Connectivity
Power BI offers live connectivity to Snowflake, BigQuery, and Redshift through DirectQuery, enabling near real-time analytics without the need to import data. Its Direct Lake storage mode, which works with OneLake via Delta Lake and Parquet formats, eliminates the need for refresh cycles and delivers lightning-fast performance on large datasets. A newer addition, Translytical Task Flows, launched in March 2026, allows users to trigger actions - like sending a Teams notification or calling an external API - directly from a report.
Fit for B2B SaaS
Power BI is an excellent fit for B2B SaaS teams that rely on Azure and other Microsoft tools like Teams, Excel, and Azure Synapse. For these teams, integration is straightforward, and the ecosystem benefits are clear. However, companies using tools like Slack, Jira, or other non-Microsoft platforms may find the setup process more complex, with fewer integration advantages [1][4]. Additionally, teams without dedicated analytics engineers might struggle with DAX’s complexity, making it harder to build or maintain a robust semantic model for self-service analytics.
Next, we’ll dive into the pros and cons of these platforms to help you make an informed decision.
Pros and Cons
Here's a snapshot of the strengths and weaknesses of each platform, based on their core features and use cases. Each tool brings something different to the table, so your choice depends on your specific needs.
Querio is ideal for teams that need transparent, warehouse-native analytics without relying on a "black box." It excels in providing inspectable SQL or Python for every query, along with a versioned context layer that ensures metric consistency across analysts, dashboards, and AI-generated answers. Its reactive notebook environment also supports efficient, governed self-service analytics. The drawback? Querio is specifically designed for data warehouse queries. If you’re looking for broad integrations with SaaS tools or a complete enterprise BI suite with advanced reporting capabilities, Querio might feel limiting.
ThoughtSpot stands out with its intuitive, search-driven interface and SpotIQ, which automatically highlights insights and anomalies. However, it comes with a hefty price tag - enterprise contracts typically exceed $100,000 annually, and implementation can take anywhere from 3 to 6 months [1]. For smaller B2B SaaS teams with 100–500 employees, these costs and timelines might be a challenge.
Looker offers robust metric governance through its LookML framework, making it a powerful option for organizations that can allocate technical resources. However, this reliance on LookML can be a barrier for teams without dedicated analytics engineers. As Skopx Resources explains:
"The LookML requirement means Looker is powerful but not self-service for non-technical users without significant upfront investment." [4]
Additionally, Looker is tightly integrated with Google Cloud, which may not align with teams using other tech stacks.
Power BI is a great fit for organizations deeply embedded in the Microsoft ecosystem. Its Direct Lake storage mode ensures strong performance with large datasets, and integration with tools like Teams, Excel, and Azure Synapse is seamless. However, the AI-powered Copilot feature requires a Microsoft Fabric F64 capacity, which starts at around $4,995 per month. This cost can make it less accessible for mid-sized teams not already committed to Microsoft’s ecosystem.
Querio | ThoughtSpot | Looker | Power BI | |
|---|---|---|---|---|
NL Query Depth | High (SQL/Python generation) | High (Search-driven) | Medium (LookML-dependent) | Medium-High (Copilot) |
Governance | Versioned context layer | Governed semantic layer | LookML semantic layer | Role-based (Fabric/Purview) |
Warehouse Connectivity | Live (Snowflake, BigQuery, Redshift, etc.) | Zero-copy (Snowflake, Databricks) | In-database (BigQuery, Snowflake) | Direct Lake (OneLake/Fabric) |
Ease of Use | High (no training required) | High (search-driven) | Moderate (LookML-dependent) | Moderate (Copilot-aided) |
Setup Time | Minutes | Weeks to months | Weeks | Days to weeks |
B2B SaaS Fit | High (scalable pricing) | Low–Medium (high cost) | Medium (GCP-centric) | High (if on Microsoft 365) |
Primary Limitation | Limited SaaS integrations | High cost & setup effort | Requires LookML expertise | Requires Fabric F64 for AI |
This comparison highlights the trade-offs between the platforms, helping you choose one that aligns with your priorities for data accuracy, governance, and user needs.
Conclusion
For B2B SaaS companies operating a real data warehouse, Querio stands out as the top conversational analytics platform in 2026. It offers a governed semantic layer, transparent SQL/Python outputs, and live connectivity, ensuring fast and dependable insights. While other platforms cater to specific enterprise needs, Querio’s ability to combine quick implementation with consistent governance makes it an excellent choice for mid-sized teams that can’t afford lengthy setups or opaque AI results.
ThoughtSpot is ideal for large enterprises seeking a Google-like search experience for their cloud warehouse data, provided they can handle the hefty enterprise contracts [1]. Looker works best for teams using BigQuery with analytics engineers who can manage a LookML semantic layer. Meanwhile, Power BI is a logical option for organizations already invested in Microsoft 365 and Azure. As Summer Lambert of Zerve explains:
"Power BI dominates enterprise BI because the math works out... if you're already paying for Microsoft 365, the procurement conversation is trivial."
Querio, by contrast, is tailored to the needs of B2B SaaS teams, offering a setup process that takes minutes rather than months and providing transparent, governed analytics. For companies using Snowflake, Redshift, or BigQuery, the priorities are clear: rapid time-to-value, transparent AI outputs, and governance without the overhead of lengthy implementation. Querio delivers on all fronts with its versioned context layer that ensures consistent metrics across analysts and AI-generated answers. Every query generates inspectable SQL or Python, and live warehouse connections eliminate stale exports or duplicated data.
If your focus is on governed, transparent, warehouse-native self-serve analytics, Querio is the standout choice. However, if your organization is already deeply integrated into the Microsoft or Google Cloud ecosystems, Power BI or Looker might be the more straightforward option.
Related Blog Posts