Business Intelligence
What Is Conversational Analytics? Definition & Use Cases
How conversational analytics turns plain-English questions into governed, warehouse-executed SQL for fast KPI checks and investigations.
Conversational analytics lets you ask plain-English questions about business data and get answers from your warehouse without writing SQL. In most cases, it works best when the tool runs live queries, uses shared metric definitions, and shows the SQL behind each answer.
Here’s the short version:
I’d define conversational analytics as a self-serve BI layer between your team and the data warehouse
It turns questions like “What was MRR by region last quarter?” into SQL, charts, and follow-up answers
It is not the same as conversation analytics for call transcripts, sentiment, or compliance
It works best with a semantic layer, warehouse access controls, and inspectable query logic
Common use cases include KPI checks, exec Q&A, metric drop analysis, and live monitoring
Accuracy can reach 85%–95% for common lookups and aggregations, but can drop to 65%–75% on harder segmentation questions without strong context
Before adopting a tool, I’d check for warehouse-executed SQL, permission enforcement, and consistent metric mapping
If I had to sum it up in one line: conversational analytics helps business teams self-serve data, but only if the numbers still come from governed warehouse logic.
How Conversational Analytics Works
The Core Building Blocks Behind natural-language BI
A conversational analytics system is a governed workflow, not just a chatbot sitting on top of your data.
It runs through a clear pipeline: natural-language understanding, schema awareness, query generation, verification, and access control. At the center of that pipeline is the semantic layer. That’s what keeps answers steady from one person to the next.
When terms like MRR, ARR, churn, and activation are defined once in a governed context layer - instead of being guessed from raw column names - the system can answer the same way no matter who asks or which tool they use.
A semantic layer helps accuracy compared with raw schemas, and session memory keeps context across follow-up questions. So if someone asks, "Now break that down by region", they don’t need to repeat the full question [6][1]. That setup matters because it turns a loose business question into a query path people can check and trust.
From a Plain-English Question to SQL, Python, and a Chart
Take a question like "What was new MRR from SMB customers in Q1 2026?".
The system maps "new MRR" to a governed metric, "SMB" to a segment filter, and "Q1 2026" to a date range. Then it generates SQL against a modeled dbt table such as fct_mrr and returns the answer as both a number and a chart [6][4][1].
That inspectable SQL matters. Analysts can review the logic, check what the system did, and trust the result a lot more [2][4].
Modern systems hit 85–95% query interpretation accuracy on common question types like lookups and aggregations. That number drops to 65–75% for more complex segmentation questions when there isn’t a strong context layer in place [6]. In a modern stack, the same governed logic can support both ad hoc questions and repeatable analysis.
Where Querio Fits in a Modern Data Stack
Querio puts this workflow directly on top of your warehouse.
It connects read-only to Snowflake, BigQuery, Redshift, ClickHouse, MotherDuck, or PostgreSQL, so answers stay warehouse-native. A shared semantic/context layer defines joins, metrics, and business terms once, so every answer follows the same governed logic.
Analysts can open, edit, and rerun the generated SQL or Python in reactive notebooks. That changes the day-to-day flow in a pretty simple way: instead of answering every ad hoc request by hand, analysts define metrics once, and business users can self-serve with confidence that "MRR" means the same thing whether the question comes from finance or sales.
Conversational analytics: How to get insights from your data without an analyst
Conversational Analytics vs. Adjacent Categories
Conversational Analytics vs. Conversation Intelligence: Key Differences
Conversational Analytics for BI vs. Conversation Intelligence for Transcripts
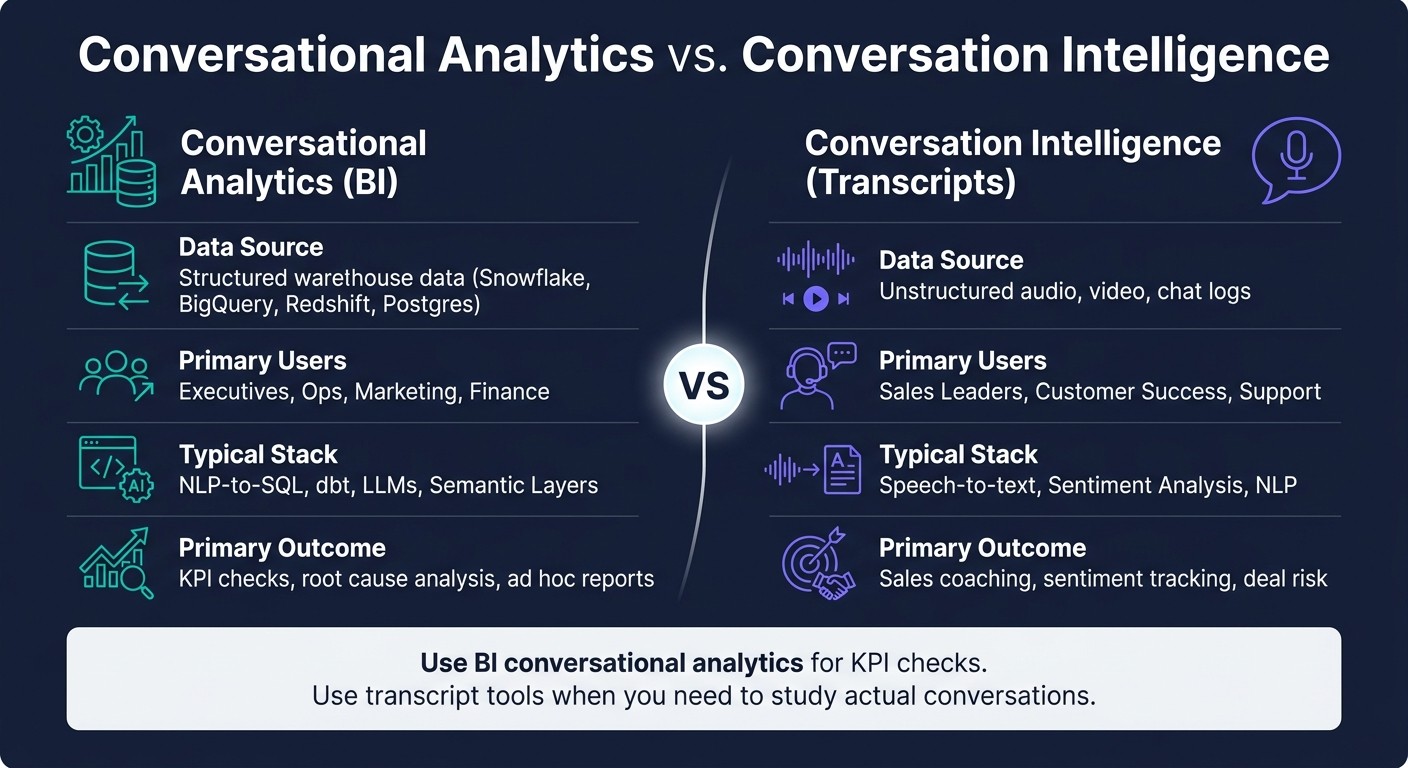
In BI, conversational analytics answers questions about your warehouse data. Conversation intelligence looks at transcripts.
Conversational analytics for BI works with structured data in Snowflake, BigQuery, Redshift, or Postgres. It returns outputs like numbers, charts, or tables. Conversation intelligence looks at calls, chats, and meetings through tools like Gong, Chorus (ZoomInfo), and Observe.AI. It returns things like coaching insight, deal risk, and objection trends.
Dimension | Conversational Analytics (BI) | Conversation Intelligence (Transcripts) |
|---|---|---|
Data source | Structured warehouse data (Snowflake, BigQuery, Redshift, Postgres) | Unstructured audio, video, chat logs |
Primary users | Executives, ops, marketing, finance | Sales leaders, customer success, support |
Typical stack | NLP-to-SQL, dbt, LLMs, semantic layers | Speech-to-text, sentiment analysis, NLP |
Primary outcome | KPI checks, root cause analysis, ad hoc reports | Sales coaching, sentiment tracking, deal risk |
Use BI conversational analytics for KPI checks and root-cause questions. Use transcript tools when you need to study actual conversations.
That line matters. If you blur the two, it gets easy to expect the wrong output from the wrong tool.
How It Fits Alongside Dashboards, Notebooks, and Semantic BI
Once the category is clear, the next step is practical: where does conversational analytics fit next to dashboards, notebooks, and the semantic layer?
The short version: it fills the ad hoc gap between dashboards and notebooks.
Dashboards answer the questions your team planned for when they built them. They’re great for repeat checks. But business teams rarely stick to the script. People ask follow-up questions, edge-case questions, and one-off questions all day long. That long tail of ad hoc requests would often need a new dashboard build otherwise, and some sources estimate it makes up about 80% of query volume [1][6]. For deep or custom work, notebooks still make more sense.
The semantic layer is what keeps this from turning into chaos. It holds the approved definitions for metrics, joins, and business terms. Tools like dbt MetricFlow and Looker's LookML set that base before any natural-language query runs. As Joe DosSantos, VP of Enterprise Data and Analytics at Workday, put it: "Definitions have to sit at the crossroads of all of this in the semantic layer so that contextual meaning can be understood by everyone who's calling it from different tools." [7]
Without that layer, answers start to drift. One person asks for “pipeline.” Another asks for “revenue.” The tool may return something each time, but not always the same meaning. And if definitions shift, even a strong LLM won’t save you.
For B2B SaaS data teams, this usually means a warehouse-native setup: business users ask questions in plain English, the system maps those questions to governed metrics, and teams get live answers from the same shared definitions. In practice, that shows up in self-serve KPI checks, faster investigations, and live monitoring.
Use Cases for 100–500 Employee B2B SaaS Teams
Once the workflow is clear, the next step is simple: where does conversational analytics help most in day-to-day work? For B2B SaaS teams with 100 to 500 employees, it usually shows up in the moments when people need answers fast and don’t want to wait in a reporting queue.
Self-Serve KPI Checks and Executive Q&A
Conversational analytics gives executives and managers a way to check KPIs and ask follow-up questions without relying on the data team for every request. Since governance is already set, a VP of Sales can ask, "What's our pipeline coverage?" and get an answer in seconds. A CFO can ask, "Which regions missed targets?" and then drill in with, "Break that down by pricing tier."
That matters because follow-up questions keep the context intact. You don’t have to start over each time. And when metric definitions are governed, everyone is working from the same number instead of arguing over whose dashboard is right.
This same self-serve pattern also helps analysts when a metric suddenly shifts and they need to move fast.
Faster Investigation When a Metric Drops
Conversational analytics can speed up investigations when a number moves the wrong way. If activation drops week over week, an analyst can ask, "Why did activation drop last week?" and then follow up with "Is this isolated to regions, channels, or cohorts?" [5][6]
Because the system queries live warehouse data, the review can start in seconds instead of waiting for someone to build a new dashboard. In Querio, analysts can inspect and edit the SQL, then keep going in a reactive notebook.
That kind of direct access is also handy for routine checks that don’t fit neatly into a fixed dashboard.
Ongoing Monitoring with Live Warehouse Data
Teams also lean on conversational analytics for recurring checks that are too ad hoc for dashboards. Finance might review pricing tier adoption each week. Customer success or operations teams might check daily shifts in usage or sign-up quality. Since queries run live against the warehouse, the answers reflect current data instead of a stale cache [7].
Use Case | Primary Users | Frequency | Business Benefit |
|---|---|---|---|
Executive health summary | CEO, CFO, Board | Weekly | Real-time visibility into burn rate, runway, and churn [1] |
Pipeline coverage check | Sales leaders | Ad hoc | Identifies deals stuck in negotiation >30 days [1] |
Pricing adoption monitoring | Product, Finance | Daily/Weekly | Tracks MRR trends across tiers to evaluate feature monetization [1] |
Metric drop investigation | Product, Marketing | On-demand | Segments activation or revenue drops by region, channel, or cohort [5][6] |
Customer health alerts | Customer Success | Daily | Flags accounts with >25% usage decline before renewal [1] |
What to Check Before Adopting Conversational Analytics
Once you know where conversational analytics fits, the next step is simple: check whether your data setup can actually support it.
The Data Foundations Needed for Accurate Answers
Conversational analytics only works when your warehouse, modeled entities, and metric definitions are already governed.
That matters because a governed semantic layer ties business terms like CAC and revenue to the right tables and metrics. So for data teams, the core issue isn't whether the interface uses natural language. It's whether the system still gives governed, warehouse-native answers.
LLMs that work straight from raw schemas are unreliable. Add table documentation, and retrieval accuracy can jump. Skip that step, and two people can ask the same thing and get different answers.
RBAC is not optional. The tool should inherit your warehouse RBAC and SSO so row-level and column-level security stay in place at query time.
If governance is shaky, conversational analytics exposes it fast.
Once that base is in place, the next thing to check is whether the tool runs governed queries or just guesses.
What to Compare When Evaluating Conversational Analytics Tools
Ask one question: does the tool generate warehouse-executed SQL, or does it invent the answer?
For high-stakes metrics, only warehouse-executed queries are acceptable.
Your review should focus on three things:
governance
query transparency
permission enforcement
Dimension | Black-box natural-language tools | Governed, Warehouse-Native Analytics |
|---|---|---|
Data connection | Static CSV uploads or extracts | Live warehouse connection (Snowflake, BigQuery, Redshift, Postgres) |
Logic layer | LLM guesses from raw schema names | Governed semantic layer with defined metrics |
Transparency | Final answer only | Inspectable SQL and Python for every result |
Security | No row-level security or audit trail | Inherits warehouse RBAC, SSO, and audit trail |
Metric consistency | Definitions vary by prompt | Single source of truth across all users |
These checks matter for a reason. Self-serve KPI checks and faster investigations only help if the underlying definitions stay the same.
During evaluation, run two practical tests. First, ask the same question with different wording, like "churned customers" vs. "canceled subscriptions", and see whether the system maps both to the same metric [3]. Second, have users with different permission levels ask the same question and confirm that results are filtered based on their access [3].
If it fails either test, it's not production-ready.
When Conversational Analytics Is Worth the Investment
The clearest sign that it's time to invest is this: analysts are spending 40–60% of their time answering routine stakeholder questions [1][6].
For 100–500 employee B2B SaaS teams, this tends to matter most when analysts are stuck handling the same KPI questions again and again.
Conversational analytics works best when the data base is already in good shape. For B2B SaaS teams with a mature warehouse and clean models, the upside can be high. Data access can expand from a small technical group to nearly the entire organization [1]. And if the tool shows the generated SQL, analysts still keep control over the logic behind the answers.
If a tool clears these checks, it can cut routine reporting work without weakening trust in the numbers.
FAQs
How is conversational analytics different from dashboards?
Conversational analytics lets people ask data questions in plain language and get answers on the fly. Dashboards, on the other hand, are pre-built views of metrics set up ahead of time.
Dashboards work best when you need to keep an eye on established KPIs. But they only answer the questions someone planned for in advance. Conversational analytics is a better fit for ad hoc exploration and follow-up questions. That means users can dig into changes as they happen instead of waiting for a new report.
Do I need a semantic layer for accurate answers?
Yes. A semantic layer matters if you want accurate, reliable answers from conversational analytics.
Without it, a natural language interface can end up guessing what your data means. And that’s where things go sideways. You get answers that look right at first glance but turn out to be inconsistent or misleading.
A semantic layer gives the system a shared understanding of your business logic. It connects everyday language to your data model, metrics, join paths, and business definitions. So when someone asks about revenue or active customers, those terms are calculated the same way every time.
What makes a conversational analytics tool trustworthy?
A conversational analytics tool earns trust when every answer comes from a governed, warehouse-native setup and runs queries straight against your live data warehouse, instead of asking an LLM to do the math itself.
A solid platform also gives you consistent metrics, SQL or Python you can inspect, inherited security controls and audit trails, and plain visibility into the source data, filters, and query results behind each answer.
Related Blog Posts


