Business Intelligence
The BI tool built for companies between their first data hire and a full analytics team
Bridging the gap between a lone data hire and a full analytics team with governed, AI-driven BI delivering live, auditable answers.
Growing businesses often hit a critical stage where spreadsheets no longer suffice, but a full analytics team isn’t in place yet. This "in-between" phase creates bottlenecks for data professionals, inconsistent metrics, and delays in decision-making. Querio addresses these challenges by providing:
Plain-English querying: Business users can ask questions directly, while the tool generates inspectable SQL for analysts.
Live data warehouse connectivity: Eliminates stale data and conflicting numbers by connecting directly to platforms like Snowflake or BigQuery.
Governed self-serve access: A shared context layer ensures consistent metric definitions across teams.
Querio simplifies workflows for small data teams, reduces manual tasks, and ensures reliable insights, helping businesses scale their analytics without adding complexity.
Agentic Business Intelligence done right
Core Challenges Between the First Data Hire and a Full Analytics Team
As companies grow, the challenges faced in early analytics efforts become more pressing. With limited resources and skyrocketing demand, these issues can quickly spiral out of control.
Bottlenecks and Growing Demand
When a company relies on just one or two data professionals, every department - whether it’s product, marketing, sales, or operations - funnels their requests through the same person. This creates a bottleneck, and soon, the demand far exceeds capacity.
The result? Manual data preparation eats up 30+ hours every week. Tasks like pulling data from APIs, fixing broken connectors, and cleaning pipelines take priority, leaving little time for strategic projects. Leadership often waits up to two weeks for a single report, delaying critical decisions[2].
Gaps in Self-Serve and Metric Consistency
Without direct access to data, teams resort to spreadsheets and one-off calculations. This leads to inconsistent metric definitions - what one team calls "active users" might not match another team’s definition. These discrepancies only come to light during high-stakes meetings, creating confusion and tension.
This phenomenon is sometimes called the "dashboard factory" trap. It happens when the rush to deliver reports leads to a proliferation of dashboards, each with slight variations of the same metrics. As Ben (SeattleDataGuy) explains:
"Multiple dashboards tracking the same metric with slight differences only create confusion... Every dashboard you build adds to your maintenance and overhead."[4]
Shockingly, 68% of business data remains unused, not because it doesn’t exist, but because it’s not easily accessible to the people who need it[3]. The problem isn’t a lack of data - it’s the inability to access and trust it consistently.
Governance and Trust Issues
When there’s no centralized system for naming, calculating, and documenting metrics using a metrics layer vs semantic layer, each team operates on its own assumptions. This leads to situations where, for example, the CFO’s revenue numbers don’t align with those of the VP of Sales. Such discrepancies erode trust in the data.
Once trust breaks down, stakeholders often fall back on gut instincts or create ad hoc spreadsheets, further muddying the waters. Meanwhile, the lone data professional spends their time reconciling conflicting numbers instead of building scalable solutions.
Bottleneck | Impact on Efficiency | Impact on Governance |
|---|---|---|
Manual Data Prep | 30+ hours/week lost to wrangling[2] | High risk of human error in calculations |
SQL/Technical Barriers | Non-technical users wait weeks for reports[2] | Users create "shadow" spreadsheets with unverified data |
At its core, the problem isn’t a lack of effort - it’s the absence of infrastructure tailored for this phase of growth. These structural challenges highlight the need for tools that can streamline analytics operations, which we’ll explore in the next section.
What a BI Tool for This Stage Must Offer
Standard BI tools often fall short when it comes to addressing bottlenecks, inconsistent metrics, and declining data trust. For this stage, the right tool needs to focus on three critical areas: where the data originates, how analysis is created, and who can access it. These components work together to tackle the challenges we discussed earlier.
Live Warehouse Connectivity
Forget about conflicting numbers - querying a single, live data warehouse eliminates that issue. Instead of relying on periodic data exports, tools should connect directly to live warehouses like Snowflake, BigQuery, or Redshift in real time.
Why does this matter? Each data extract adds maintenance work, which can quickly overwhelm a small team of one or two data professionals. Live connectivity not only reduces this burden but also uses your warehouse's existing security policies and processing power. This removes the need for extra data pipelines. Snowflake and similar platforms highlight benefits like "eliminating data copies" and maintaining "consistent security policies" as key advantages of this approach [5].
Querio, for example, connects using encrypted read-only credentials. This setup eliminates issues like data duplication, stale snapshots, and extra storage management. With real-time access, leadership sees the same numbers the data team does when they run SQL queries themselves. This approach helps companies scale their analytics capabilities without adding unnecessary complexity.
AI-Driven Analytics with Transparent Logic
AI can supercharge a small data team’s efforts - but only if it’s trustworthy. The problem with "black box" AI is that it’s impossible to verify its results when something seems off. And if trust is already an issue, opaque AI only makes things worse.
Transparency is key. AI should show its work. Every plain-English query should generate SQL or Python that can be inspected, adjusted, and reused. A 2023 McKinsey survey found that organizations using AI in analytics were 1.3x more likely to see revenue gains of 10% or more, but trust and explainability remain major hurdles [7].
Querio’s AI agents address this by translating natural language questions into fully visible SQL or Python. For instance, if the CEO wants to know net new ARR by region before a board meeting, the analyst can review the generated query, tweak the ARR logic or filters, and save it as a reusable notebook cell. This process takes minutes instead of days, giving the data team control while meeting growing demands for analytics.
Governed Self-Serve Analytics
Rebuilding trust and improving decision-making requires a balance: business users need access to data, but without proper guardrails, this can lead to inconsistent dashboards and confusion. The solution? A shared semantic layer. This central hub defines key metrics like MRR, churn, and active users once, ensuring they’re applied consistently across the board.
A 2024 dbt Labs survey revealed that 77% of data professionals consider defining and governing metrics a top challenge, with "multiple sources of truth" being the most common BI pain point [6]. A shared semantic layer eliminates this issue by ensuring all answers, dashboards, and analyses use the same definitions, reducing metric drift.
In Querio, the data team sets up joins, business terminology, and metric logic within a shared context layer. This allows business users to explore data and ask questions independently - within the defined guardrails - without accessing raw schemas or creating their own calculations. The data team retains control over the logic, while everyone else gets the insights they need.
How Querio Is Built for This Stage
Querio combines live connectivity, transparent AI, and governed self-serve access into a single workspace tailored for teams navigating transitional phases in their data workflows.
AI-Native Workspace with Shared Context
Querio is built entirely around AI, not as a feature tacked onto a traditional BI tool. When a business user poses a question in plain English, Querio generates real SQL or Python code. This code is fully visible and editable, ensuring the data team retains oversight and control.
The context layer is where all AI-generated outputs are organized. Data professionals define table joins, business terminology, and metric logic just once. From that point forward, every AI-generated answer - whether it's for a data analyst or a VP of Sales - relies on these consistent definitions. For example, "MRR" (Monthly Recurring Revenue) will mean the same thing across departments like Finance and Sales. Similarly, terms like "active users" won’t vary from one dashboard to another. The context layer also allows for custom Skills (like monitoring client retention) and Rules (guiding how the AI handles specific queries), giving data teams granular control over how business data is interpreted.
This unified context seamlessly integrates into a reactive notebook environment, simplifying both analysis and reporting.
Notebooks and Dashboards for Scalable Analysis
Querio’s notebook environment is reactive, meaning cells automatically update when upstream logic changes - just like how spreadsheets recalculate formulas. This eliminates the need for manual updates, which is especially helpful for small teams managing heavy workloads.
Within this setup, analysts can build logic in notebooks and then publish specific cells as Boards (Querio’s term for dashboards). This ensures stakeholders only see insights that are verified and approved by the data team. While stakeholders access the summarized Boards, the full analysis remains available for deeper dives when needed. Boards can be marked as Verified, signaling to the organization that the data reflects official, reviewed logic. They also refresh automatically on a set schedule, so leadership always sees the latest numbers without manual intervention. Based on implementation data, this streamlined workflow can save around 10 hours of analysis time per week per employee, and tasks that once took three weeks can now be completed in about 30 minutes [1].
With these scalable tools in place, Querio also ensures strong governance and security to protect data integrity.
Governance, Security, and Deployment Options
For companies scaling their analytics capabilities, Querio includes robust security and deployment options. It is SOC 2 Type II compliant and connects using encrypted, read-only credentials, ensuring raw data remains within your existing infrastructure without duplication. Features like Role-Based Access Control (RBAC), Row-Level Security (RLS), and automatic interaction logging (capturing user ID, timestamp, action, and result) keep access tightly controlled and compliance reviews simple.
For U.S.-based organizations with strict data residency needs, Querio offers flexible deployment options, including cloud-native (VPC) or self-hosted setups. SSO integrations come standard. Pricing starts at $14,000 per year, which includes one database connection, 4,000 monthly prompts, and unlimited viewer users - perfect for teams that need widespread access without paying per seat for every stakeholder checking a dashboard.
How to Adopt Querio at This Stage
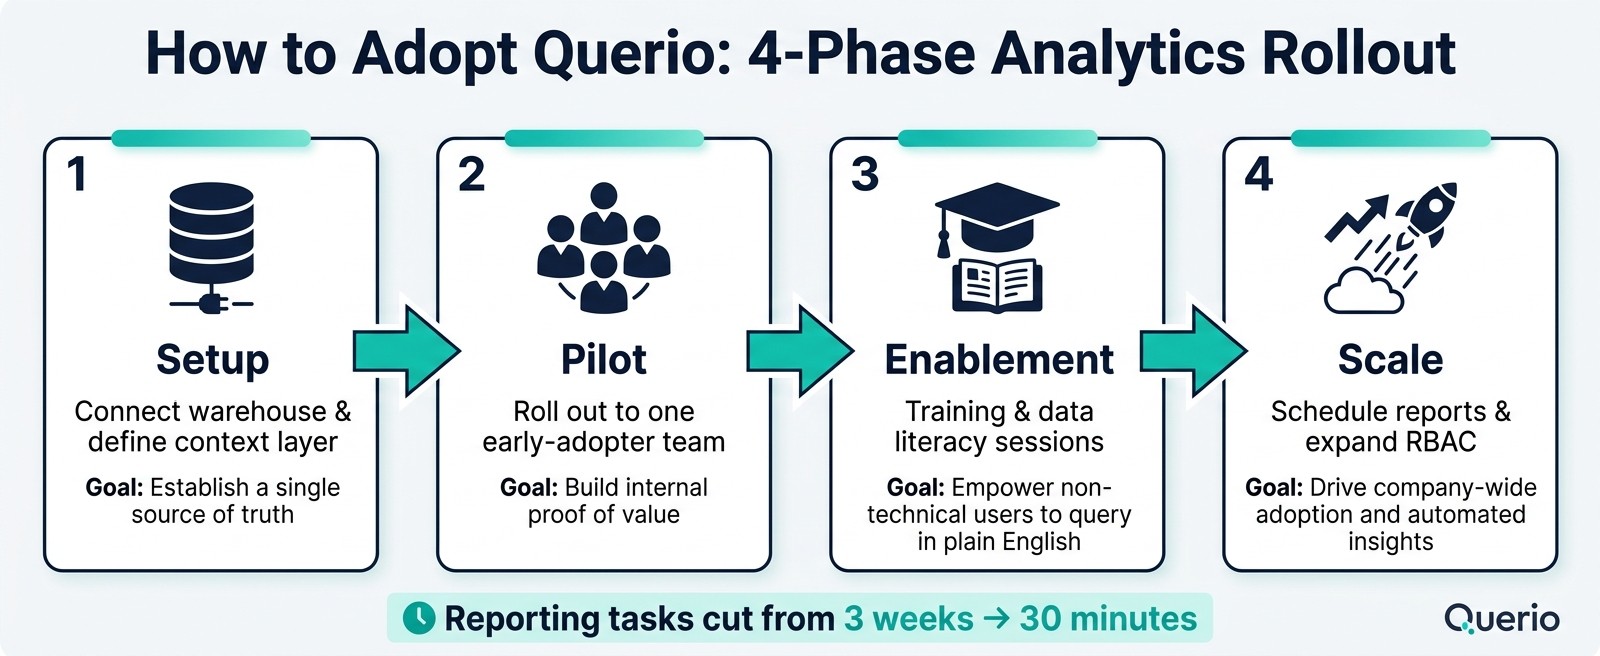
How to Adopt Querio: 4-Phase Analytics Rollout for Growing Teams
Building on the challenges already discussed, let’s explore how you can scale your analytics with Querio effectively. The good news? You don’t need to overhaul your existing systems. Querio integrates smoothly into your current setup. To make the transition successful, follow these steps: evaluate where you stand, determine what’s most important, and then expand access across your organization.
Assess Your Current Analytics Maturity
Before diving in, take a step back and evaluate your existing analytics landscape. Start by mapping out your data sources, understanding how reports are currently being generated, and identifying any bottlenecks. Look for areas where decisions are being made without reliable data or where your data team is overwhelmed.
The objective here is to pinpoint the most impactful use cases. Prioritize these based on their importance to your business. For instance, if your sales team struggles with accurate pipeline forecasting, that should take precedence over less critical needs. Document the decisions each team needs to make and align them with measurable KPIs. This groundwork will guide the rest of the implementation process [8].
Define Key Metrics and Connect to Your Warehouse
Once you’ve identified your priorities, the next step is to set up your context layer in Querio. This involves defining your metrics, terminology, and logic in one centralized place. Querio then connects securely to your data warehouse - whether it’s BigQuery, Snowflake, Redshift, ClickHouse, PostgreSQL, or another system - using encrypted, read-only credentials. There’s no need to duplicate data [1]. Every AI-generated answer across your organization will pull from these standardized definitions.
To avoid confusion, make sure you identify the authoritative source for each domain (e.g., CRM for sales, ERP for finance) [8]. Additionally, you can create Skills for complex recurring analyses, like churn prediction, and Rules to guide how the AI handles specific queries. These tools give your data team control without requiring constant manual input.
Once your context layer is in place, you’re ready to expand access thoughtfully.
Roll Out Self-Serve Querying and Reporting
Start small with a pilot program, selecting a team of early adopters. These users will not only validate your setup but also become advocates for Querio within the organization. Once they’re consistently getting accurate answers in plain English, you can begin rolling it out to other teams.
Use Role-Based Access Control (RBAC) to ensure each team sees only the data relevant to their work. For example, the marketing team doesn’t need access to payroll data, and finance doesn’t need a cluttered view of campaign-level details. You can also set up scheduled reports for routine updates - daily or weekly summaries sent directly to users - eliminating the need for manual logins. Querio’s pricing includes unlimited viewer seats, so scaling access won’t add extra costs [1]. The sooner everyone has access to verified Boards, the quicker data becomes an integral part of decision-making.
Rollout Phase | Key Action | Goal |
|---|---|---|
Phase 1: Setup | Connect warehouse & define context layer | Establish a single source of truth |
Phase 2: Pilot | Roll out to one early-adopter team | Build internal proof of value |
Phase 3: Enablement | Training & data literacy sessions | Empower non-technical users to query in plain English |
Phase 4: Scale | Schedule reports & expand RBAC | Drive company-wide adoption and automated insights |
Conclusion: Scaling Analytics with Confidence
For US companies, the "in-between" analytics stage is a natural part of growth - where the demand for data quickly outpaces the size of the team. The real challenge? Staying stuck in this phase for too long.
The bottlenecks often stem from outdated tools and inefficient processes, not a lack of talent. A skilled analyst overwhelmed by Slack requests and manual CSV exports isn’t failing - they’re just working with the wrong resources. When metric definitions are scattered across spreadsheets and leadership can’t agree on basic numbers, it’s not just frustrating - it’s a governance issue. These misalignments can ripple through an organization, delaying hiring decisions, complicating CAC targets, and stalling budget talks as teams operate with conflicting MRR figures.
The solution lies in tools that simplify workflows and ensure consistency. Querio addresses these pain points with a governed context layer that standardizes critical metrics like ARR, churn, and active accounts. This ensures every report pulls from a single, consistent source of truth. With transparent SQL logic and live warehouse connectivity - secured through read-only, encrypted credentials - your data team can audit outputs in real time and eliminate outdated exports. This level of reliability is essential, whether you’re preparing for a SOC 2 audit or earning the trust of a cautious CFO.
The impact? Massive time savings. Companies have reported cutting reporting tasks from 3 weeks to just 30 minutes [1]. This shift allows your data team to go beyond reactive tasks and focus on building strategic models and analyses. It’s a critical step toward achieving analytics maturity and preparing for a smoother transition to a fully scaled analytics team.
The groundwork you lay during this phase - standardized metrics, governed self-service access, and live warehouse connectivity - becomes the backbone for future growth. Choosing the right tool now means avoiding expensive re-platforming and dashboard chaos down the road.
FAQs
How long does it take to set up Querio?
Querio is designed for a quick setup, often taking just a few hours or, at most, a single day. The exact timeframe depends on how complex your data infrastructure is and the specific integration requirements. Its straightforward setup process means you can start analyzing and drawing insights without unnecessary delays.
How do we prevent teams from creating conflicting metrics in Querio?
Querio tackles the challenge of conflicting metrics by focusing on governance and standardization. Its semantic layer guarantees that metrics and definitions remain consistent across the entire organization. This means everyone is working from the same playbook, reducing discrepancies and misunderstandings.
On top of that, Querio’s collaborative tools make it easier for teams to share, review, and refine analyses. By working together, teams can align on calculations and ensure everyone is on the same page. This approach not only promotes accuracy but also helps teams self-serve analytics confidently while collaborating effectively on insights.
Can Querio answer plain-English questions without exposing raw data?
Querio leverages a natural language interface to transform plain-English questions into SQL queries behind the scenes. This means users can ask questions in everyday language, and Querio handles the technical work of converting those queries into SQL.
By doing this, Querio delivers answers directly without exposing raw data, ensuring both clarity for users and security for sensitive information.
Related Blog Posts