Business Intelligence
Best Looker Alternatives for Self-Serve Analytics (2026)
Compare seven Looker alternatives for 100–500 person B2B SaaS teams—tradeoffs in governance, AI, warehouse fit and cost.

If Looker feels slow for self-serve analytics, you have other options. In this guide, I compare Querio, Tableau, Power BI, Sigma, Metabase, ThoughtSpot, and Hex for 100–500-person B2B SaaS teams that want easier access to live warehouse data.
Here’s the short version:
- Looker often needs a 4–12 week setup before business users can work on their own.
- The main tradeoffs are self-serve use, governance, AI, warehouse setup, and cost.
- Querio fits teams that want governed self-serve on live warehouse data.
- Tableau fits teams that care most about visual analysis.
- Power BI fits Microsoft-first companies.
- Sigma fits spreadsheet-heavy teams on top of a clean warehouse.
- Metabase fits teams that want a low-cost start.
- ThoughtSpot fits search-led analytics at enterprise budget levels.
- Hex fits analyst-led notebook workflows.
If I had to simplify it even more: pick based on who needs answers, how much metric control you need, and whether you want live-query BI or imported data.
Quick Comparison
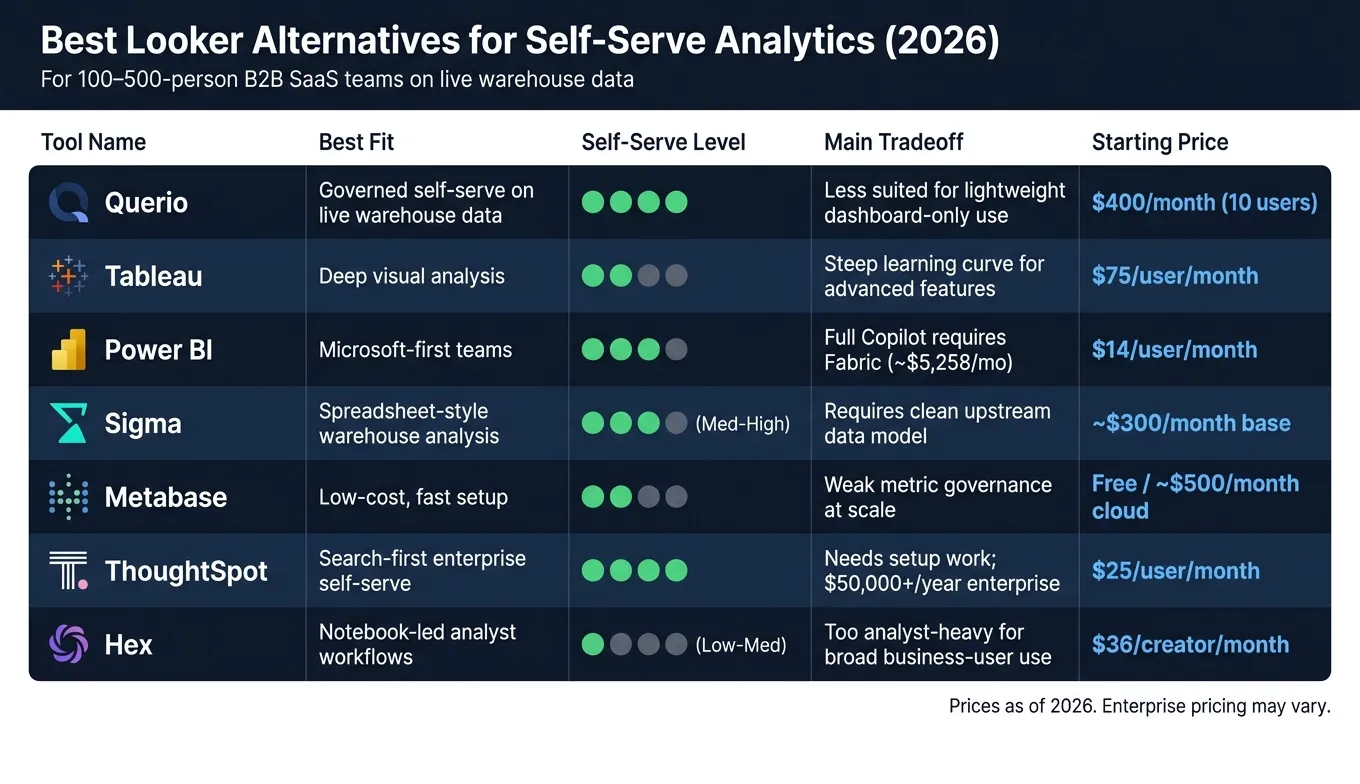
| Tool | Best fit | Main tradeoff | Starting price |
|---|---|---|---|
| Querio | Governed self-serve on live warehouse data | Less focused on lightweight dashboard-only use | Free plan; Core $2,499/mo |
| Tableau | Deep visual analysis | Harder for non-technical users as work gets more advanced | $75/user/month for Creator |
| Power BI | Microsoft-first teams | Full AI setup can get expensive | $14/user/month |
| Sigma | Spreadsheet-style warehouse analysis | Relies on a clean upstream data model | ~$300/month base |
| Metabase | Low-cost, fast setup | Weaker metric control at scale | Free self-hosted / ~$500/month cloud |
| ThoughtSpot | Search-first self-serve | Needs setup work and a higher budget | $25/user/month or $50,000+/year enterprise |
| Hex | Notebook-led analysis | Less suited for broad no-code use | $36/creator/month |
The core takeaway is simple: there isn’t one best Looker replacement for every team. Larger organizations often require self service analytics platforms for enterprise that prioritize governance and security. The right choice depends on whether you want more control, less admin work, or faster access for business users.
1. Querio
Querio is an AI-native analytics workspace built for governed self-serve on live warehouse data. In plain terms, it gives business users and analysts one place to work from the same governed warehouse data.
It connects straight to live data in Snowflake, BigQuery, Redshift, ClickHouse, and Postgres. So teams can skip CSV exports, avoid duplicate datasets, and work from the source.
Self-serve workflow
Querio supports two modes in one platform. Business users can ask questions in plain English and get answers tied to actual SQL. Analysts can dig deeper with reactive notebooks for SQL and Python, where results update as the code changes.
That matters because both groups still work from the same live warehouse connection. No side systems. No copied data sitting off to the side.
Semantic governance
Querio also keeps metric logic in one shared layer instead of scattering it across dashboards and one-off queries.
Querio's shared context layer centralizes joins, metrics, and business terms - defined once, then reused across dashboards, notebooks, ad hoc questions, and embedded analytics. Users can inspect and edit the underlying SQL or Python, so the logic stays transparent and auditable.
If you've ever seen two teams argue over why "revenue" shows up differently in two reports, this is the kind of problem that shared logic is meant to fix.
AI analysis
Querio's AI agents turn natural-language questions into SQL and Python using the context layer. That means answers follow your metric definitions instead of guessing from table and column names.
So the AI isn't just matching keywords. It's working from the business logic your team has already set.
Warehouse fit
Querio is a strong fit for teams already using Snowflake, BigQuery, Redshift, ClickHouse, or Postgres. There is a free plan, and Core is $2,499/month (or $25,000 a year billed annually), with unlimited users on every plan.
There’s also on-prem deployment as an Enterprise add-on, plus API and iframe embeds, which can help teams with stricter data residency needs or customer-facing analytics use cases.
2. Tableau
Tableau is one of the best-known visualization tools for analytics teams. It connects to Snowflake, BigQuery, Redshift, Databricks, and Postgres using live queries or Hyper extracts. That gives teams room to balance data freshness and speed. But there’s a catch: deep analysis in Tableau still takes practice.
Self-serve workflow
Building basic charts is pretty straightforward. Once users get into LOD expressions or more advanced calculated fields, though, things get harder fast.
That’s where self-serve can start to break down. If business users need answers on their own, without pulling in an analyst, the learning curve becomes a big deal. In some teams, that means licenses sit unused. And if you want analysts to level up through certification, that can add $3,000 to $5,000 per person [1][5].
Semantic governance
Tableau handles governance through Tableau Catalog, certified data sources, and permissions. In practice, that usually means a dedicated admin needs to stay on top of definitions to keep metrics aligned [5][6].
For self-serve teams, this setup has a clear tradeoff: consistency comes from admin work, not from enforced modeling. That’s why teams that want tighter metric control often pair Tableau with an external semantic layer like dbt or Cube [6][9]. And that part matters even more now, because Tableau’s AI features still rely on clean source definitions.
AI analysis
Tableau Pulse and Einstein Copilot are Tableau’s main AI-facing features. Pulse gives users contextual metric tracking and AI-generated insights on top of existing data. Einstein Copilot adds natural-language querying.
Put simply, Tableau is moving closer to a workflow where people can ask questions in plain English instead of clicking through every step by hand. That can be a strong fit for teams that already spend a lot of time in the Salesforce world [2][7].
Warehouse fit
Tableau uses a hybrid setup that blends Hyper extracts with live queries, so analysts can choose based on freshness and performance needs [5][7]. That flexibility is useful, especially when one dashboard needs fast response times and another needs the latest possible data.
Pricing is per user:
- Creator: $75 per user/month
- Explorer: $42 per user/month
- Viewer: $15 per user/month
- Enterprise Creator: up to $115 per user/month [3][7][9]
This pricing model can add up fast. Broad rollout isn’t just a product call; it’s a budget call too. Year-one total cost of ownership usually falls between $60,000 and $150,000 once infrastructure and admin time are part of the picture [5].
Tableau makes a lot of sense when deep visualization is the main goal. Teams that want easier self-serve and less admin work may lean toward a different setup in the next section.
3. Microsoft Power BI

Microsoft Power BI tends to work best for teams that already run on Microsoft 365, Azure, or Fabric and want self-serve analytics with governed metrics. It connects natively to Excel, Teams, and SharePoint. And with DirectQuery, it can run live queries against Snowflake, BigQuery, Redshift, Databricks, and Postgres.
That setup makes Power BI a strong pick for Microsoft-first teams that want governed self-serve without stepping outside the Microsoft stack.
Self-serve workflow
Power Query is good for basic data prep. But once workflows get more advanced, teams often end up in DAX and analyst-built models.
There’s also a practical catch: Power BI Desktop is Windows-only. So if your team is Mac-heavy, editing usually has to happen in Power BI Service instead.
Semantic governance
Power BI’s DAX semantic model gives teams one place to manage metrics, certified models, calculation groups, and row-level security. In practice, it plays a role similar to LookML for governed reporting.
dbt Semantic Layer can work with Power BI, but there’s a common wrinkle: metrics and row-level security can still get split across two systems [6][7][8].
AI analysis
Power BI Copilot adds natural-language querying. But the full setup requires Microsoft Fabric F64 or higher, which costs about $5,258/month [7].
Warehouse fit
Here’s the pricing at a glance:
| Tier | Price |
|---|---|
| Power BI Pro | $14/user/month [7] |
| Power BI Premium Per User (PPU) | $24/user/month [7] |
| Microsoft Fabric Capacity (F64, full Copilot) | ~$5,258/month [7] |
For some companies, Microsoft 365 E5 already includes Pro, which can make a broad rollout easier. The tradeoff shows up later: costs can climb once Fabric and Copilot enter the picture.
Teams that want warehouse-native data analysis tools for a self-serve model usually look at the next option.
4. Sigma Computing
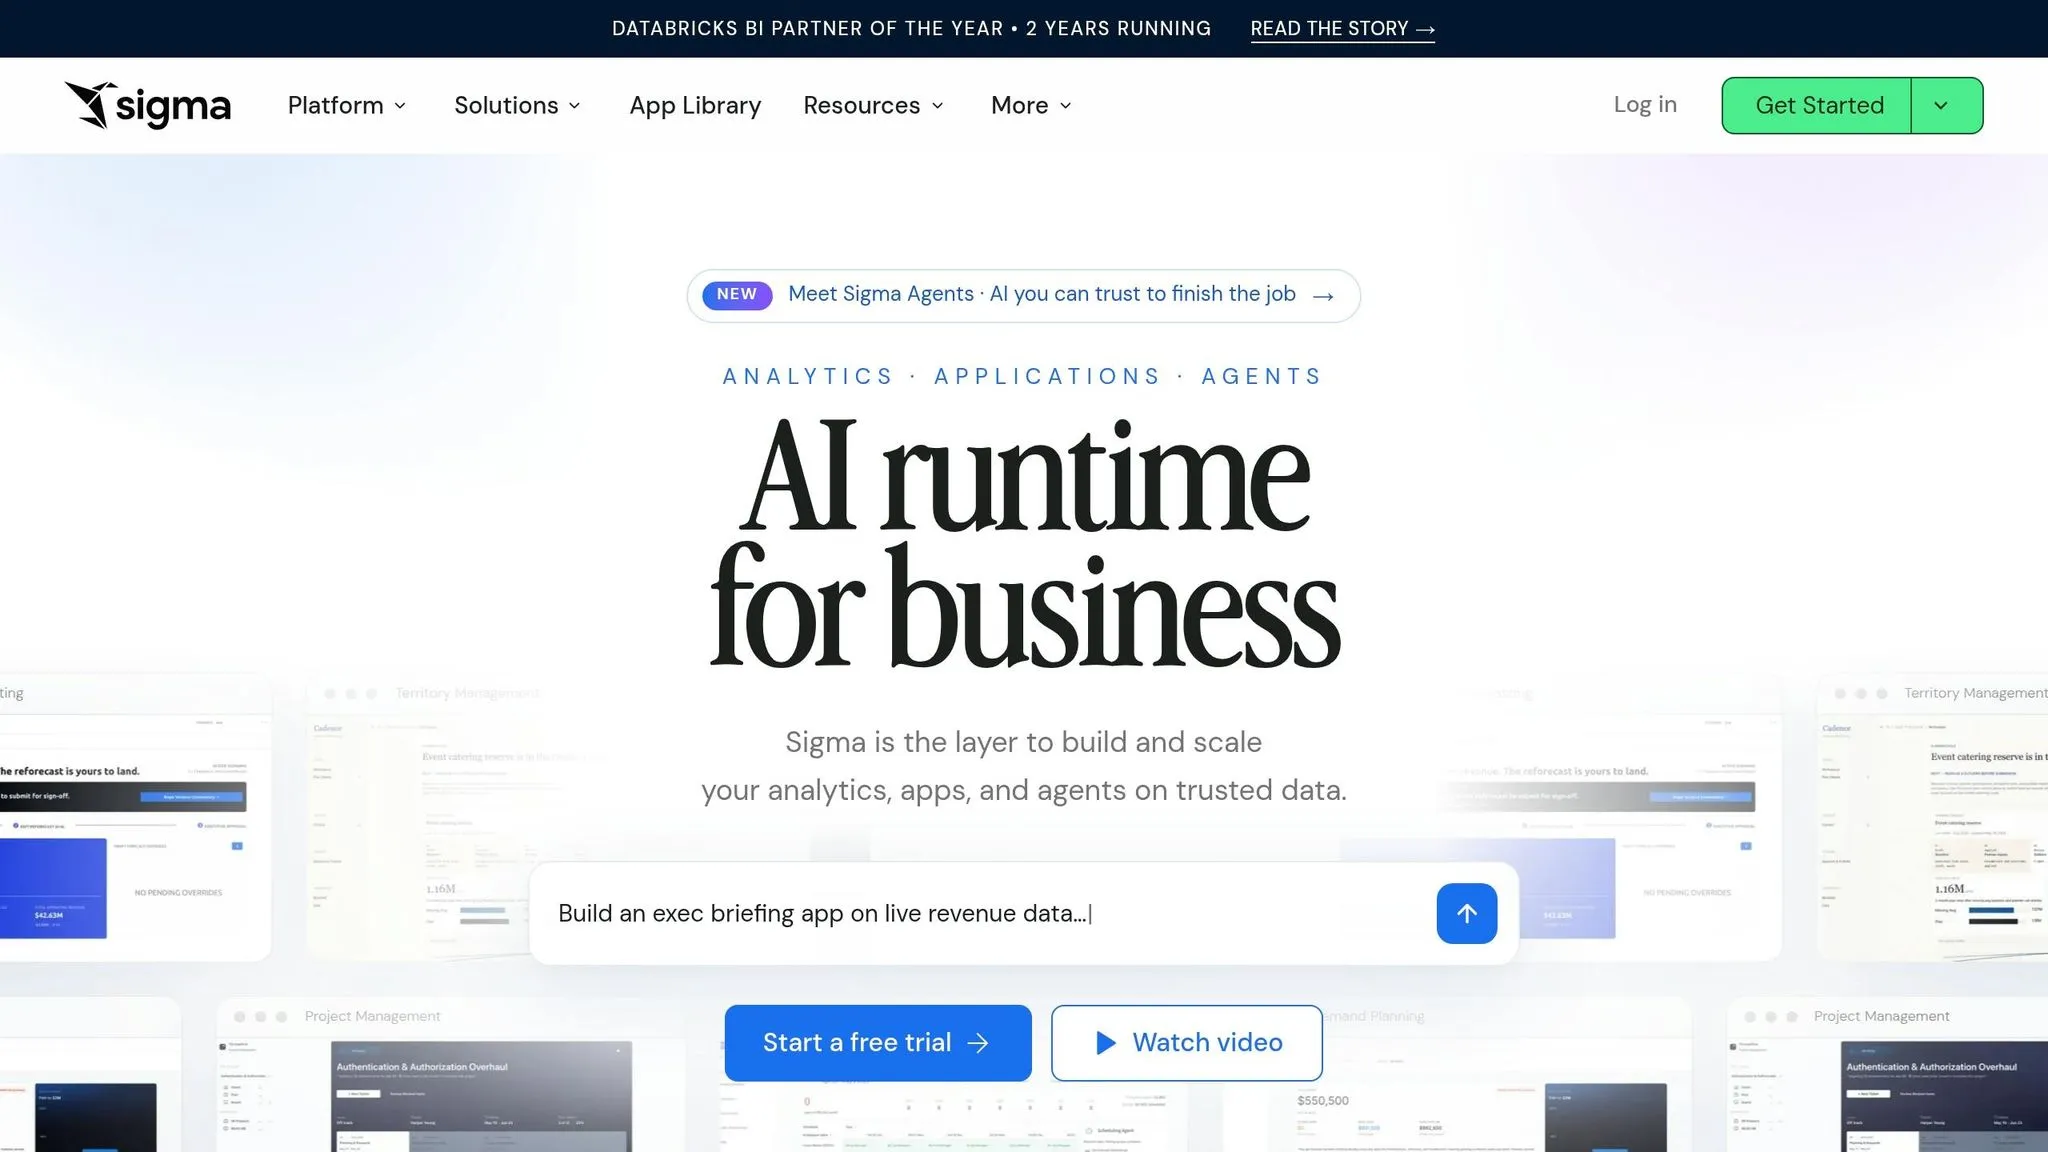
Sigma uses a spreadsheet-style interface to run live queries on warehouse data. For people who live in Excel or Google Sheets, that feels familiar right away. And for basic analysis, they don’t need SQL just to get started.
Self-serve workflow
Users can slice, filter, and pivot live warehouse data without waiting on a data engineer to build new models. That’s a big deal when teams want answers now, not after a ticket sits in a queue.
Sigma also supports native writeback through input tables. That means users can update forecasts or fix data entries inside a dashboard and sync those changes back to the warehouse. Looker does not support that by default [7].
There is one catch. This kind of ease works best when the warehouse model is already in good shape. If the data setup is messy, self-serve analysis can get messy too.
Semantic governance
Sigma does not use a centralized semantic modeling language like LookML. Instead, it works best as a self-serve analytics layer on top of a clean warehouse model, with dbt handling transformations and metric definitions upstream [4][5][6].
If the warehouse model is weak, users will see inconsistent results directly. There’s less insulation here. On the flip side, when the warehouse model is well set up, Sigma AI can answer questions from governed data instead of ad hoc spreadsheets.
AI analysis
Sigma includes Sigma AI and Cortex Agents for natural-language queries and automated insights against live warehouse data [7].
Warehouse fit
Sigma is warehouse-native, so it runs live queries against Snowflake, BigQuery, Databricks, and Redshift without data extracts or copies [3][7]. Pricing starts at about $300/month as a base, plus tiered seat costs [7].
It’s often a strong fit for teams that already have a mature, well-structured data warehouse and mainly need to give non-technical users direct access to explore it [1][11].
For teams that want a lighter setup and a different self-serve model, the next option takes a simpler path.
5. Metabase
For teams that want the fastest path to basic self-serve, Metabase keeps things simple. It’s a strong first BI tool for lean SaaS teams that need dashboards fast without a big budget. The open-source version is free to self-host, and Metabase Cloud starts at about $500/month [6][3].
Self-serve workflow
Setup usually takes hours to a day, not weeks. Non-technical users can build charts with a point-and-click question builder, while analysts can switch to SQL when they need more control. That mix makes Metabase easy to start using.
The tradeoff shows up later. Governance is limited at scale. So while adoption is easy, things can get messy as more people use it and more dashboards pile up.
Semantic governance
Metabase has no LookML-style semantic layer, so metric consistency depends on upstream modeling in dbt or in the warehouse, plus analyst oversight [6][4].
AI analysis
Metabase includes Metabot, an AI assistant that lets users ask questions in natural language [8][7]. It’s available as a $100/month add-on, and it sits on top of the query model instead of enforcing metric logic [8].
In plain English, that means the tool can help people ask for data in a more natural way, but it won’t fix messy definitions on its own. If the underlying data is clean and well-structured, answers tend to be better [8].
Warehouse fit
Metabase connects directly to Snowflake, BigQuery, Redshift, and Postgres [3][5]. It works best for small data teams that need fast, low-cost self-serve BI without a heavy semantic layer.
That simplicity is the main draw. The flip side is weaker governance as usage grows.
6. ThoughtSpot
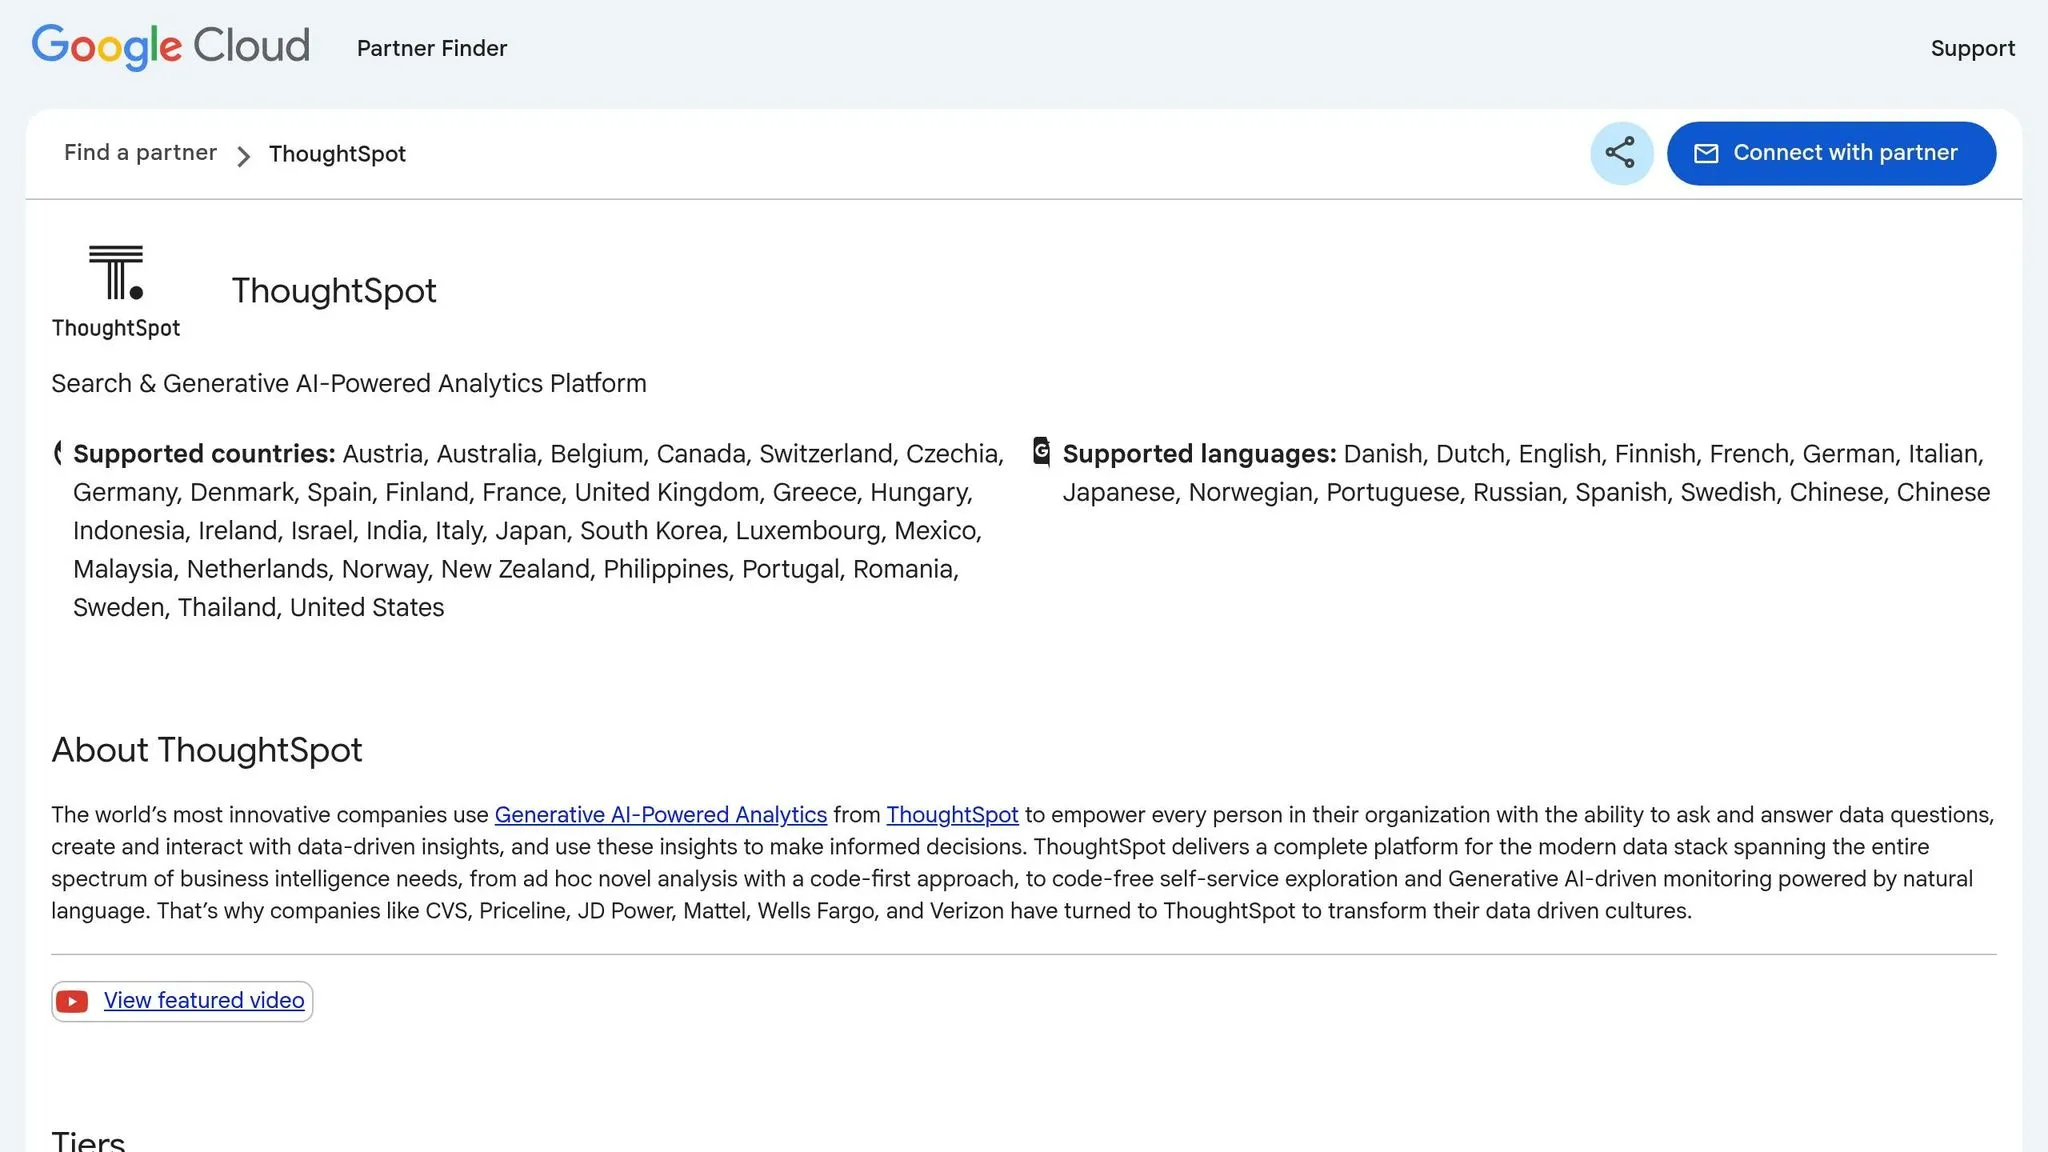
ThoughtSpot centers on search-driven analytics. People type plain-English questions into a search bar, and the platform turns those questions into SQL that returns live charts and Liveboards. In practice, it works best when teams need fast, governed self-serve on clean warehouse data. That makes it a strong fit for teams that want governed self-serve without leaning on dashboard-heavy workflows. For B2B SaaS teams that want business users to answer their own questions from governed metrics, the main tradeoff is the upfront work of semantic modeling.
Self-serve workflow
The big upside is simple: fewer analyst requests for one-off answers [1][2]. Instead of sending a Slack message and waiting in line, users can search for what they need on their own.
There is a catch, though. Before search becomes dependable, analysts or engineers need to define the core metrics and dimensions [1][2]. If that setup work isn't done well, search can feel hit-or-miss.
Semantic governance
ThoughtSpot relies on a semantic layer to make search dependable [2][4]. That layer gives the system a shared understanding of metrics, dimensions, and business logic, which is what keeps answers from drifting from team to team.
It can also pair with the dbt Semantic Layer for version-controlled, warehouse-native metric definitions [6]. On top of that, ThoughtSpot includes strong access controls and versioning [4], which matters when different teams need different levels of data access.
AI analysis
ThoughtSpot's Spotter 3 and SpotIQ support natural-language querying and can turn search results into Liveboards [2][7][8]. So the AI layer isn't working in a vacuum. It's tied back to the business logic already defined in the model, which helps keep answers consistent.
Warehouse fit
ThoughtSpot is a warehouse-native platform with live queries that runs directly against Snowflake, BigQuery, Redshift, and Databricks, without extracts [4][7]. That's a big deal for teams that want answers from live warehouse data instead of copied snapshots.
Pricing starts at $25 per user per month for the Essentials tier, and enterprise deployments can start at $50,000+ annually [7][10]. So this is very much an enterprise-priced option, best for teams with the budget to support governed search at scale.
Teams that want notebook-first analysis will likely want something different in the next section.
7. Hex
Hex takes a notebook-first approach. Analysts can work with SQL, Python, and R in one place, then turn that work into interactive apps for business users. It fits teams where analysts do the heavy lifting and other stakeholders mainly review the output.
Self-serve workflow
Hex is self-serve, but in an analyst-led way. Analysts build inside the notebook, and business users use the published app. That setup gives power users room to dig into the data, test ideas, and move fast.
The tradeoff is on the viewer side. For non-technical users, the experience can feel heavier than drag-and-drop BI tools built for ad hoc use. So if your team wants broad, no-code data access for everyone, Hex may feel a bit more hands-on than a pure BI dashboard tool.
Semantic governance
Hex's Team tier includes a semantic model agent that works with dbt models [9]. That matters for dbt-heavy teams because it helps keep analysis tied to shared metrics and versioned transformations.
Its governance model is lighter than Looker's LookML, which makes Hex a better fit for teams that want some structure without putting everything behind a fully centralized modeling layer [2][9].
AI analysis
Hex's Notebook Agent helps analysts generate code and move through multi-step analysis faster [7]. If your team likes working in notebooks, this is where Hex starts to make a lot of sense. The AI sits inside the workflow analysts already use, instead of pushing them into a separate chat-only setup.
Warehouse fit
Hex works best for teams that want code-first analysis without pulling data out of the warehouse. It connects directly to Snowflake, BigQuery, Redshift, and Postgres with live push-down SQL, so the compute stays in the warehouse [7][9].
Pricing starts at $36 per creator per month for the Professional tier. The Team tier starts at $75 per creator per month [7][9].
Pros and Cons
Every tool on this list makes a different trade-off between ease of use, governance, and cost. The goal isn't to pick the "best" one in the abstract. It's to match the tool to how much self-serve access, control, and day-to-day usage your team needs.
| Tool | Main Pros | Main Cons | Ideal Buyer |
|---|---|---|---|
| Querio | Governed self-serve on live warehouse data; editable SQL and Python logic | Best for warehouse-native governed self-serve, not lightweight dashboarding | Growing B2B SaaS data team that needs shared definitions without heavy modeling |
| Tableau | Strong visualizations; large user base and training ecosystem | Steep learning curve for advanced features; Creator licenses start at $75/user/month [7][3] | Analyst-led SaaS team where visual depth is the top priority |
| Power BI | Strong DAX-based semantic model; deep Microsoft 365 and Azure integration; $14/user/month [7] | Full Copilot requires Fabric capacity | Microsoft-first data team already running Azure or M365 |
| Sigma Computing | Spreadsheet-like interface; warehouse-native with no data extracts | Pricing starts around $300/month base; metric consistency requires more discipline as usage grows | Finance-heavy ops team that needs live warehouse access |
| Metabase | Fast setup; intuitive Question Builder for non-technical users | Limited semantic governance at scale | Cost-sensitive SaaS team that needs quick dashboards |
| ThoughtSpot | Search-first for business users and executives; strong natural-language query experience | Requires a clean, mature data model; typically starts at $50,000+/year [10] | Enterprise team with well-modeled warehouse and non-technical business users |
| Hex | Collaborative notebooks with SQL and Python; live pushdown to the warehouse [7] | Too analyst-heavy for broad business-user adoption | Technical data team that needs collaborative notebooks with stakeholder-facing output |
In practice, that's why some tools spread fast across a company, while others do a better job keeping metrics aligned. Understanding the essential features of modern BI tools can help you navigate these trade-offs.
Conclusion
The comparison above points to a simple takeaway: the right pick comes down to how much governance, self-serve access, and warehouse-native analysis your team needs.
If Looker’s developer-heavy workflow is the issue, each option tackles that pain in its own way. Tableau is a strong fit for deep visualization. Power BI makes sense for Microsoft-first teams. Sigma works well for spreadsheet-style analysis on live warehouse data. Metabase is a good match for fast, low-cost setup. ThoughtSpot leans into search-led AI. Hex suits teams that want a notebook-first workflow.
Querio makes sense when you need governed self-serve business intelligence on live warehouse data, with consistent metrics and no analyst bottleneck - backed by inspectable SQL and Python, plus shared metric logic across every dashboard and query.
To narrow the shortlist, focus on three things:
- metric governance
- the type of AI workflow you need
- whether your team wants live-query or import-based BI
Start with those, and the shortlist gets a lot smaller, fast.
FAQs
How do I choose between live-query BI and imported data?
It comes down to what matters most in your setup: speed, data freshness, or how your warehouse is built.
Live-query BI connects straight to Snowflake, BigQuery, or Redshift. That means reports show current data, without the delay or maintenance work that comes with an import pipeline.
Imported data can often make queries faster and cut warehouse costs. But there’s a tradeoff: you add latency, plus the extra work of keeping data synced.
For teams that run on modern cloud warehouses, live-query BI is often the go-to choice because it supports a single, governed source of truth.
What level of metric governance does my team really need?
You need a governed semantic layer when teams start reporting different numbers for the same KPIs, like revenue or active users. Once you have more than a few dozen dashboards, the lack of shared definitions usually leads to dashboard sprawl and less trust in the data.
If consistent metrics across the company matter most, a governed approach is a must. If you have fewer than five data users, or speed matters more than standardization, a formal semantic layer may not be needed.
Which option is easiest for non-technical business users?
It comes down to how your team works and how comfortable people are with data.
Metabase is often the easiest pick for simple, fast self-serve analysis. Its question builder feels intuitive, and the learning curve is low, so people can get started without much friction.
Sigma tends to fit teams that already think in spreadsheets. Power BI makes sense for Microsoft-heavy organizations. And ThoughtSpot is a good match for teams that prefer search-based analytics.