Business Intelligence
The 9 Best DuckDB-Powered Analytics Tools
Compare nine DuckDB-enabled analytics tools and choose by team workflow, governance needs, and sharing preferences.

If you only want the short answer: pick the tool based on how your team works, not just on DuckDB itself. In this list of 9 tools, I’d put them into four buckets: shared DuckDB (MotherDuck), notebooks (Hex, Jupyter + Python), code-led publishing (Evidence, Observable), and BI/self-serve (Superset, Metabase, Lightdash, Preset).
Here’s the plain-English version:
- MotherDuck: best if I want DuckDB in the cloud with team access
- Hex: best if I want SQL + Python notebooks I can turn into apps
- Jupyter + Python: best if I want full control for solo analysis
- Evidence: best if I want reports in code with Git-based workflows
- Apache Superset: best if I need self-hosted dashboards and can run it myself
- Metabase: best if I want simple self-serve for business users
- Lightdash: best if my team already runs dbt and cares about metric control
- Observable: best if I want browser-based interactive data apps
- Preset: best if I want managed Superset on Snowflake or BigQuery
A few patterns stand out fast:
- Only some tools are DuckDB-first
- Some put DuckDB in the browser with DuckDB-Wasm
- Some treat DuckDB as just one connector
- Governance is uneven across the group
- Self-serve and analyst freedom usually pull in opposite directions
For example, Metabase is easier for non-technical users, while Jupyter + Python gives me more control but far less built-in sharing. And while Lightdash is the closest thing here to a governed metrics setup, it still depends on how well the dbt project is set up.
Bottom line: if I care most about analyst speed, I’d look first at MotherDuck, Hex, or Jupyter. If I care most about metric control, I’d start with Lightdash, Superset, or Preset. If I care most about easy sharing, I’d focus on Metabase or Observable.
::: @figure 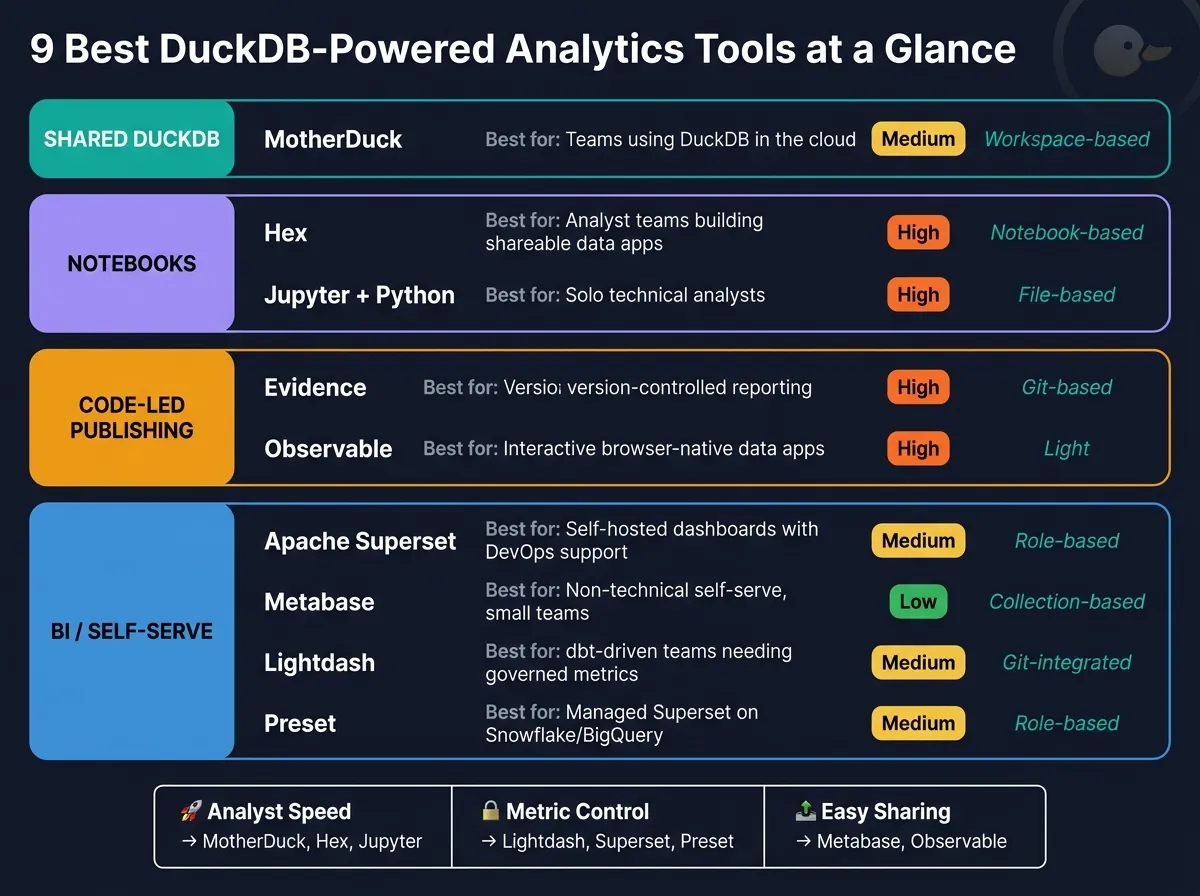 {9 Best DuckDB Analytics Tools Compared: Find Your Perfect Fit}
:::
{9 Best DuckDB Analytics Tools Compared: Find Your Perfect Fit}
:::
Data Visualisation Tools With DuckDB & MotherDuck - Hex/Preset
::: @iframe https://www.youtube.com/embed/F9yHuAO50PQ :::
Quick Comparison
| Tool | Main use | DuckDB’s role | Best fit | Main limit |
|---|---|---|---|---|
| MotherDuck | Shared SQL analysis | Cloud DuckDB service | Teams using DuckDB together | Weak fit for governed BI |
| Hex | Notebook + app building | In notebooks with SQL/Python | Analyst teams sharing apps | Less direct for non-technical users |
| Jupyter + Python | Ad hoc deep dives | Local engine/library | Solo or technical analysts | Little built-in governance |
| Evidence | BI in code | Local/browser-side engine | Version-controlled reporting | Not drag-and-drop self-serve |
| Apache Superset | Self-hosted dashboards | Connector | Teams with DevOps support | High setup and maintenance work |
| Metabase | Simple self-serve BI | Direct DuckDB connection | Small teams, business users | Weak metric control at scale |
| Lightdash | dbt-led BI | Works with warehouse/dbt setup | Teams with mature dbt models | Less useful without dbt |
| Observable | Interactive browser apps | Browser-side DuckDB | Data apps and custom analysis | Weak fit for recurring BI |
| Preset | Managed Superset | Indirect, warehouse-first | Teams that want hosted Superset | Not DuckDB-native |
If I were choosing today, on September 3, 2026, I’d use one simple filter: who is asking questions, where the data lives, and how much control the business needs over metric definitions. That tells me far more than BI tool features do.
1. MotherDuck
MotherDuck is a managed DuckDB cloud service built for fast, shared SQL analysis. It works well for teams that want to use DuckDB together without being stuck in a local-only setup.
It’s a good fit for ad hoc analysis, especially for analytics teams working with data from Snowflake, BigQuery, Redshift, or Postgres. Put simply, MotherDuck is closer to shared DuckDB analysis than tightly controlled BI.
| Dimension | MotherDuck |
|---|---|
| DuckDB role | Managed cloud DuckDB service |
| Best for | Shared DuckDB analysis in the cloud |
| Not ideal for | Governed enterprise BI |
That shared-cloud setup leads into the next group of tools, which bring DuckDB into notebooks, browser-based analysis, and BI workflows.
2. Hex
Hex is a collaborative SQL and Python notebook platform where data analysts can write queries, build logic, and turn their work into interactive data apps. It’s a good fit for teams that like working in notebooks but also need a clean way to share results with other people.
What makes Hex stand out is simple: it turns notebook analysis into apps that stakeholders can click through without touching code. That’s a big step up from sending around static charts or screenshots. As one reviewer put it:
"Analysts love the notebook experience, and Hex apps are a nicer way to share an analysis than a static dashboard." - Kateryna Kozachenko, Marketing & Growth, Bruin [1]
Hex also comes with a built-in AI Notebook AI agent that can chain SQL and Python cells together and help analysts write queries faster inside the notebook [2].
| Dimension | Hex |
|---|---|
| DuckDB role | Notebook analytics with DuckDB and warehouse connections |
| Best for | Analyst teams building and sharing custom data apps |
| Not ideal for | Non-technical users doing self-serve exploration |
| Pricing (editor) | $36/mo (Professional), $75/mo (Team) [1] |
| Viewers | Unlimited on paid plans [1] |
There is a clear skill gap here. Business users will usually interact with the published apps, while the data team handles new analysis requests. So if your setup is analyst-led and sharing-heavy, Hex makes a lot of sense. If your team wants more direct, hands-on DuckDB work inside notebooks, the next tool is a better match.
3. Jupyter + Python with DuckDB
Jupyter + DuckDB is a strong fit for technical analysts who want SQL and Python in the same notebook for ad hoc analysis on CSV, Parquet, or warehouse data. This is an analyst-owned setup, built for individual work. It shines when you need to jump back and forth between local files and warehouse queries without slowing down.
The main upside is flexibility. If your team uses Snowflake, BigQuery, Redshift, or Postgres, you can query warehouse data, pull in local files, and use DuckDB right next to Python libraries like pandas or Polars in one notebook. That makes it a good choice when the question is too custom or too messy for dashboard-first BI.
The downside is pretty simple: this setup stays analyst-led. The data team still ends up handling most questions unless you add a separate semantic or self-serve layer. Governance and reproducibility also need extra process outside the notebook. And once that work needs to turn into something reusable or business-facing, you’re usually looking at a BI layer meant for repeatable reporting.
| Dimension | Jupyter + Python + DuckDB |
|---|---|
| DuckDB role | Local analytical engine for files and warehouse connections |
| Best for | Technical analysts doing complex, ad hoc deep dives |
| Not ideal for | Non-technical users, recurring dashboards, governed self-serve |
| Pricing | Free, open-source for local use |
| Collaboration | Minimal by default; best for solo work |
4. Evidence
Hex and Jupyter shine when you want to poke around in data and follow your curiosity. Evidence is built for a different job: repeatable, code-defined reporting.
Evidence is a code-first analytics tool that turns SQL and warehouse data into lightweight reports and dashboards. It uses DuckDB for fast local or browser-side querying, including DuckDB-Wasm. The sweet spot is analytics teams that want reporting they can version-control, review, and ship like software. It’s a weaker fit for casual self-serve work.
Use Evidence when your team wants warehouse-backed reports that live in code and ship like software.
| Dimension | Evidence |
|---|---|
| DuckDB role | Local and browser-side query engine via DuckDB-Wasm |
| Best for | Code-first, version-controlled reporting and dashboards |
| Not ideal for | Non-technical self-serve exploration or drag-and-drop BI |
That makes Evidence a better fit for versioned reporting than drag-and-drop BI tools, which is where the next tools come in.
5. Apache Superset
If your team needs a self-hosted BI layer that can query DuckDB-backed data, Apache Superset is an open-source option. Compared with Evidence, Superset moves away from code-defined reporting and into a broader dashboard layer. That matters for teams that want DuckDB speed but still need a familiar BI front end.
Superset is self-hosted, so your team handles provisioning, upgrades, authentication, and access control. The license costs $0. The ops work does not.
For DuckDB, governance is manual and SQL-driven. If you need audit-grade reporting, keep SQL deterministic and enforce a governed semantic layer upstream. In that setup, Superset makes sense for teams that want a classic dashboard layer and can run the stack themselves. It also helps frame the next set of tools, which lower the barrier for teams that want faster self-serve use.
| Dimension | Apache Superset |
|---|---|
| Deployment | Self-hosted |
| Cost model | Free, open source |
| Operational effort | High - you manage the infrastructure |
| Governance | Manual / defined upstream |
| AI features | No native AI features |
Superset is a strong fit when self-hosting is a hard requirement and your team already has a clear governance process. It makes less sense if you need low-touch deployment or built-in AI-assisted analysis.
6. Metabase
Metabase is a good pick for simple self-serve BI when business users want to dig into data fast, without a lot of setup. Compared with Superset, it gives up some depth in exchange for easier adoption.
With DuckDB, Metabase tends to work best in self-hosted or small-team setups where it can connect to the DuckDB file directly. That makes it a practical option for solo analysts and small teams. At the same time, concurrent access to one DuckDB file gets tougher to handle as usage grows. Once teams start sharing dashboards more broadly, they often shift the serving layer to Postgres or a warehouse-backed model.
The core tradeoff here is accessibility versus depth. Metabase is less suited to teams that rely on complex SQL workflows, governed metric logic, or a shared metric layer across teams. That simplicity is part of the appeal for lightweight self-serve. But if your team uses dbt-driven modeling, you’ll often want a more structured layer after that.
| Dimension | Metabase |
|---|---|
| Deployment | Cloud or self-hosted |
| DuckDB fit | Best for direct file-based access in small-team setups |
| Governance | Best for lightweight exploration; weak for governed metrics. |
| Best for | Non-technical self-serve and small-team dashboards |
Metabase works best when business users need simple exploration on top of DuckDB. Lightdash is a better fit for teams that need more modeling discipline.
7. Lightdash
If Metabase is the lighter self-serve pick, Lightdash is the dbt-native choice for teams that want tighter control over metrics.
Lightdash is a dbt-centric BI tool that adds a self-serve layer on top of the same dbt models and metric definitions your team already manages. Its big draw is governed metrics: business logic stays in dbt instead of getting rebuilt inside the BI tool.
For DuckDB-focused teams, Lightdash makes sense when DuckDB is just one part of a warehouse-native analytics stack. It fits best when DuckDB sits inside a warehouse-backed dbt workflow, such as Snowflake, BigQuery, Postgres, or Redshift.
| Dimension | Lightdash |
|---|---|
| DuckDB fit | Best alongside dbt on a warehouse |
| Governance | Strong - centered on dbt models and metric definitions |
| Best for | dbt-driven teams that want governed self-serve BI |
Here’s the catch: Lightdash only pays off if you already use dbt. If you don’t, setup takes more work. And if your team leans on notebooks or AI-assisted analysis tools, Lightdash isn’t built for that.
So in practice, Lightdash is the governed self-serve option. The next set of tools moves more toward visual and browser-native analysis.
8. Observable
Observable is a strong pick for code-first, browser-native analysis built on DuckDB that you want to publish as an interactive data app. It fits data teams and analysts who like working in code and need room for custom analysis that goes past standard dashboards.
Put simply: Observable is better for sharing exploratory work than for running a governed BI layer.
It shines when analysts publish interactive work that other people can dig into on their own. Think browser-native analysis that readers can click through and inspect, not recurring reports or dashboard-heavy metric tracking.
| Dimension | Observable |
|---|---|
| DuckDB fit | Browser-native DuckDB analysis |
| Governance | Light governance; better for curated apps than metric enforcement |
| Best for | Interactive data apps and exploratory analysis |
In practice, Observable works best for interactive exploration, not metric-driven dashboards. It isn't a fit for governed self-serve BI or scheduled reporting at scale. If your team needs a more BI-focused delivery model, the next tool is a better fit.
9. Preset
Preset is managed Superset for governed dashboards on Snowflake and BigQuery. In plain English, it works best for teams that want BI delivery without taking on the setup and maintenance work themselves. It’s less about DuckDB-led analysis and more about serving dashboards from warehouse data.
That’s why Preset matters in this comparison: it works as a BI front end over cloud warehouses, not as a DuckDB-native workflow.
Preset’s main draw is governance with low admin work. You keep Superset’s dashboard workflow, but Preset takes care of most of the ops side. If your team likes Superset and doesn’t want to babysit the infrastructure, that’s a pretty clear win.
| Dimension | Preset |
|---|---|
| DuckDB fit | Indirect; Preset is not DuckDB-centric. |
| Governance | Managed deployment and access controls |
| Best for | Teams wanting managed Superset on cloud warehouses |
| Admin overhead | Low for the customer; Preset handles the infrastructure |
The tradeoff is simple: Preset is still a managed BI layer, not a DuckDB-first analytics tool. If your team needs DuckDB-native analysis, go with another option. Preset makes the most sense when your team already uses Superset and wants managed hosting.
How the 9 Tools Compare by Use Case
The tool-by-tool sections above show that these tools use DuckDB in very different ways. This table gives you a fast scan of those differences in one place.
| Tool | DuckDB Role | Skill Level Required | Collaboration & Governance | Deployment |
|---|---|---|---|---|
| MotherDuck | Primary cloud engine | Medium | Workspace-based | SaaS |
| Hex | Local SQL engine | High | Notebook-based | SaaS |
| Jupyter + Python | Local library | High | File-based | Local / Self-hosted |
| Evidence | Static site engine | High | Git-based | Self-hosted (static) |
| Apache Superset | Data source connector | Medium | Role-based | Self-hosted / Managed |
| Metabase | Data source connector | Low | Collection-based | Self-hosted / SaaS |
| Lightdash | dbt-DuckDB engine | Medium | Git-integrated | SaaS / Self-hosted |
| Observable | Browser-side DuckDB | High | Notebook-based | SaaS |
| Preset | Managed connector | Medium | Role-based | SaaS |
The biggest difference comes down to where DuckDB lives: as the main engine, as a connector, or inside the browser at runtime.
That split shapes how teams work. On one side, you have governed metrics. On the other, you have fast, flexible analysis. And that tradeoff matters more than it may seem at first glance.
Most of the tools here don't include a governed semantic layer. Lightdash comes the closest because of its dbt tie-in, but even then, governance depends on how well the dbt project is set up and maintained. If your definition layer isn't consistent, you'll get different answers to the same question. For teams that need accurate reporting, that's a serious headache—especially when evaluating the best embedded analytics tools for your product.
"A tool that is right 85% of the time, with no way to know which 15% is wrong, is slower than the analyst it replaced." - Valiotti Data [3]
As teams grow, the bigger problem is metric drift. One group says "active user" means one thing, another group means something else, and suddenly nobody trusts the dashboard. That's where the self-serve versus code-led split also starts to matter.
Tools like Metabase make it easier for business users to get answers without much setup. Tools like Evidence and Jupyter assume the person asking the question can also write SQL or Python. That's a very different working style, and it changes who can use the tool day to day.
The next section turns those patterns into a short pick list.
Pros, Cons, and Which Tool to Pick
Use this final pass to line up each tool with the job it does best.
| Tool | Biggest Pro | Main Tradeoff | Best Fit |
|---|---|---|---|
| MotherDuck | DuckDB speed with cloud sharing | Not a full governed BI layer | Teams that want collaborative DuckDB without giving up cloud access |
| Hex | Flexible SQL + Python notebooks | Better for analyst-heavy workflows than for business-user self-serve | Data teams with notebook DNA |
| Jupyter + Python | Maximum flexibility | Mostly a manual, local workflow | Solo analysts and prototyping |
| Evidence | Beautiful BI-as-code output | Code-first workflow | Engineering-led teams that want version-controlled reports |
| Apache Superset | Open-source, self-hosted control | Requires more operational ownership | Teams with DevOps capacity and strict data residency needs |
| Metabase | Easy for non-technical users | Weak on consistent definitions without a semantic layer | Small teams needing quick, low-code dashboards |
| Lightdash | dbt-native metrics layer | Governance only stays strong if the dbt project is mature | dbt-first teams that want a governed BI layer |
| Observable | Browser-native DuckDB with interactive publishing | Light governance; not suited for recurring metric reporting | Analysts sharing exploratory or interactive data apps |
| Preset | Managed Superset with low admin overhead | Not DuckDB-centric; depends on cloud warehouse connections | Teams that want managed Superset on Snowflake or BigQuery |
The short version: pick based on your main constraint. If you care most about speed, one set of tools makes sense. If you care most about control over metric definitions, the answer changes. And if broad self-serve access is the main goal, you'll likely land somewhere else.
Here’s how that plays out by team type:
-
50-person B2B SaaS company: You need fast answers without metric drift. If teams across sales, marketing, product, and finance all look at the same numbers, a governed BI layer is usually the safer pick.
-
Healthcare analytics team: Put auditability, access control, and live warehouse connections first. Local file-based workflows may be handy for side analysis, but they usually shouldn’t sit at the center of the stack.
-
Finance or fintech team: Traceable metric definitions and versioned logic matter a lot. Lightdash with a mature dbt project is the closest fit among these nine tools.
-
Data team wanting AI-driven analytics on live warehouse data: This is where governed metrics matter a lot. AI is only as good as the layer beneath it, so use a tool that keeps outputs tied to governed definitions instead of raw schema names.
If you're stuck between two options, use this simple filter:
- Choose MotherDuck, Hex, or Jupyter + Python when speed and analyst flexibility matter most.
- Choose Lightdash, Apache Superset, or Preset when governance, control, or warehouse-first reporting leads the decision.
- Choose Metabase or Observable when ease of sharing or lightweight self-serve matters more than tight metric control.
In plain English: don't pick the tool with the most features. Pick the one that fits the way your team already works. That usually leads to fewer workarounds, fewer reporting fights, and a much smoother rollout.
FAQs
::: faq
How do I choose between notebooks, BI, and browser-based DuckDB tools?
Choose the tool based on how technical your team is, how much self-service people need, and how they like to work.
- Notebooks like Hex work well for analyst-heavy teams that use SQL and Python for deeper analysis.
- BI tools like Metabase or Apache Superset make more sense when you need broader self-service and tighter governance.
- Browser-based or AI-native tools are a good fit for fast, conversational access, especially when users can inspect the SQL behind the answers. :::
::: faq
When is DuckDB enough, and when do I need a warehouse-first setup?
DuckDB is enough for fast local analysis, ad hoc exploration, and embedded analytics when your data still fits on local compute. It’s a good fit when you want speed without the overhead of a centralized server.
A warehouse-first setup makes more sense when you need centralized governance, such as row-level security, audit logs, and consistent metric definitions, or when your data no longer fits well on a single machine. :::
::: faq
Which DuckDB tools are best for governed self-serve analytics?
For governed self-serve analytics, tools with a centralized semantic layer tend to produce the most consistent results. ThoughtSpot and Omni stand out when teams want to scale self-service without losing control, while Looker and Power BI bring strong enterprise governance inside ecosystems many companies already use.
For teams that need both governance and flexibility, Omni is a strong fit. And if inspectable, auditable AI-generated SQL is high on your list, Querio is a strong option too, with a governed context layer and an AI-native workspace. :::