Supply Chain Management
AI Analytics for Logistics & Supply Chain Teams
Unify warehouse data, govern metrics with dbt, and run ETA, stockout, supplier lead-time and cost-to-serve AI workflows for trusted answers.

If your team still waits hours - or days - for answers on late shipments, stockout risk, supplier delays, or cost-to-serve, the fix is simple: put your TMS, WMS, ERP/OMS, carrier feeds, and supplier data in one warehouse, define metrics once, and let people ask questions in plain English against live data.
I’d boil the article down to this:
- Start with the data model, not the chatbot.
- Define shared metrics in dbt and a semantic layer.
- Launch 4 workflows first: ETA exceptions, stockout risk, supplier lead-time analysis, and cost-to-serve.
- Put answers where people already work: Slack, Teams, email, dashboards, and notebooks.
- Measure success by time to answer, shared numbers, and business impact.
A few numbers make the case. Only 6% of companies report end-to-end supply chain visibility, and 20% say they don’t trust their own data accuracy. In one cited case, AI-driven forecasting and inventory work cut expedited shipping costs by 22%, from $2.4 million to $1.87 million per year.
Here’s the short version of what matters:
- You need one warehouse model for orders, shipments, loads, stops, lanes, warehouses, SKUs, POs, receipts, and inventory.
- You need locked joins like order ID to shipment ID and PO to receipt.
- You need clear KPI rules for on-time delivery, fill rate, days of supply, freight cost per mile, and cost-to-serve.
- You need daily and weekly rhythms, like a 7:00 AM delay and stockout digest before standup.
- You need traceable answers with visible SQL so analysts can check the logic.
| Area | What I’d set up first | Why it matters |
|---|---|---|
| Data | One warehouse with TMS, WMS, ERP/OMS, carrier, and supplier data | Stops conflicting answers |
| Metrics | dbt models and a semantic layer | Keeps KPI logic the same |
| Workflows | ETA risk, stockout risk, supplier lead time, cost-to-serve | Covers the main day-to-day questions |
| Access | Slack/Teams for planners, scheduled reports for operators, notebooks for analysts | Cuts back-and-forth |
| Review cadence | Daily alerts, weekly scorecards, monthly cost review | Turns analysis into action |
Bottom line: I’d treat AI analytics as a warehouse-first reporting layer with chat and notebook access - not as a shortcut around data quality. That’s what makes the answers usable in day-to-day supply chain work.
Supply Chain Analytics Explained with Real-World Examples | AI + Data | Intellipaat
::: @iframe https://www.youtube.com/embed/L83gEkbVaIw :::
Build the data foundation before adding AI workflows
::: @figure 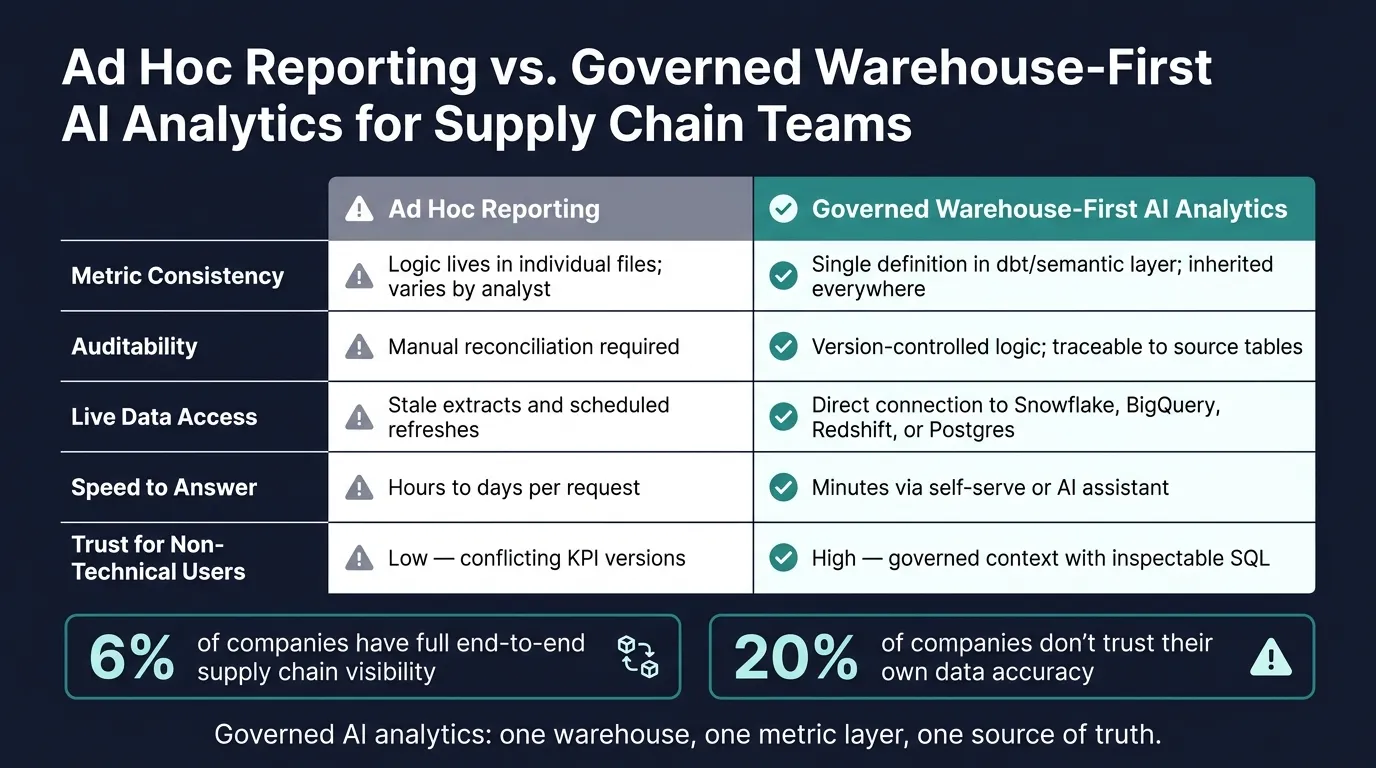 {Ad Hoc Reporting vs. Governed AI Analytics for Supply Chain Teams}
:::
{Ad Hoc Reporting vs. Governed AI Analytics for Supply Chain Teams}
:::
Map the systems and core entities you need in one warehouse
Before an AI workflow can answer a logistics question with any consistency, the data needs to live in one warehouse and follow one model. That usually means pulling data from your TMS for shipment execution, WMS for inventory and fulfillment activity, ERP or OMS for orders, demand, and financial context, carrier EDI or API feeds for pickup, delivery, and status events, and supplier records for purchase orders and lead times.
Start with the systems that explain three things: shipment status, inventory position, and order fulfillment. Then map those sources to shared business keys. That step sounds simple on paper. In practice, it's where a lot of teams get tripped up.
Model orders, shipments, loads, stops, carriers, lanes, warehouses, SKUs, purchase orders, receipts, and inventory snapshots with durable keys. Just as important, lock down the joins between them:
- order ID to shipment ID
- shipment ID to load ID
- load ID to stop sequence
- SKU to inventory snapshot
- purchase order to receipt
If those joins aren't solid, the AI tool can still produce an answer. It just may not match across systems, which is where trust starts to fall apart.
Define governed metrics with dbt and a semantic context layer
Once the raw data is in place, the next step is shared metric definitions. If each team calculates on-time delivery in its own way - with different promised date rules, grace periods, or shipment status logic - the AI assistant will give different answers based on who wrote the query. That's exactly the mess governed metric definitions are meant to fix.
In dbt, teams can standardize formulas for on-time delivery, transit time, fill rate, stockout risk, days of supply, freight cost per mile, and cost-to-serve. So instead of five spreadsheet versions of the same KPI, the business works from one definition.
Each metric should spell out:
- its grain
- its time window
- its source tables
- how edge cases are handled
For example, does an early arrival count as on time? Which costs belong in cost-to-serve: linehaul, accessorials, detention, storage, handling, and expedited freight? Those details matter more than people think.
Querio's context layer stores governed joins, metric definitions, and trusted queries as version-controlled SQL, Markdown, and Python alongside dbt. When governed metrics live in dbt and the semantic layer for SaaS, every dashboard, alert, and AI query pulls from the same logic.
Ad hoc logistics reporting vs. governed warehouse-first AI analytics
The difference here is pretty simple: one setup produces conflicting answers, and the other helps people get trusted answers fast. Only 6% of companies report full end-to-end supply chain visibility [3], and a 2025 visibility report found that 20% of respondents don't trust their own data accuracy [4]. That gap usually comes from weak governance, not from having too much data.
| Dimension | Ad hoc / spreadsheet reporting | Governed warehouse-first AI analytics |
|---|---|---|
| Metric consistency | Logic lives in individual files; varies by analyst | Single definition in dbt/semantic layer; inherited everywhere |
| Auditability | Manual reconciliation required | Version-controlled logic; traceable to source tables |
| Live data access | Stale extracts and scheduled refreshes | Direct read-only connection to Snowflake, BigQuery, Redshift, or Postgres |
| Speed to answer | Hours to days per request | Minutes via self-serve or AI assistant |
| Trust for non-technical users | Low - conflicting versions of the same KPI | High - governed context with inspectable SQL |
Ad hoc reporting turns analysts into manual report builders. Warehouse-first AI changes their role. They set the logic once, and planners can reuse answers they trust. Those governed inputs are what make ETA exceptions, stockout risk, supplier lead-time, and cost-to-serve workflows work in the first place.
With the warehouse model and metric layer in place, the first AI workflows can run on inputs the business can check and rely on.
Set up the first 4 AI analytics workflows
ETA exception detection from shipment events and promised delivery windows
Start with the data you already have in your TMS and OMS: shipment master data, carrier events, lane history, and promised delivery windows. Model that data as fact_shipments, fact_shipment_events, and dim_lanes, then enrich it with weather, traffic, and holiday data.
The core job here is simple: compare the predicted delivery time with the promised window.
A good starting point is a baseline transit model built from historical P50 and P90 transit hours by lane and service level, like LTL from Chicago, IL to Dallas, TX. From there, layer in signals such as terminal dwell time, time since the last carrier event, and carrier reliability metrics.
The output should be a daily exception board that shows shipments likely to miss the promised window by more than 60 minutes. Group that list by carrier, lane, customer, and facility so teams can spot patterns fast instead of digging through raw event logs.
AI-powered ETA systems can identify delay patterns 24–72 hours before they appear in carrier tracking updates [2], which changes the work from reactive follow-up calls to planned intervention. Put the board in Looker, ThoughtSpot, Power BI, or Querio notebooks so planners, customer service, and ops all work from the same alert set.
Use severity tiers and suppression rules. If an alert doesn't call for a clear action, it shouldn't fire.
That exception list becomes the daily operating queue for planners and customer service.
Stockout risk reporting from demand, inventory, and lead-time data
Once shipment exceptions are on the board, the next issue is straightforward: will inventory cover demand until replenishment lands?
This workflow joins four governed tables:
fact_demandfor historical daily orders by SKU and locationfact_inventory_on_handfor current quantities in cases, pallets, and poundsfact_inbound_supplyfor open POs with expected receipt dates- A supplier lead-time dimension with average, standard deviation, and P90 values by supplier and lane
The main metric is days of supply: available inventory divided by forecasted daily demand. Pair that with fill rate and at-risk units. Then add forecasting for seasonality and promotions, and score the probability of stockout over the next 7 or 14 days.
The output is a ranked table a planner can use right away. Say a high-margin SKU at a Midwest DC shows 3 days of supply, a 65% stockout probability over the next 10 days, and $85,000 in sales at risk. That tells the planner what to do next: expedite a PO or rebalance inventory across DCs. No guesswork, and every number ties back to governed warehouse logic.
One detail matters a lot here: define available inventory clearly in your dbt model. Exclude damaged units, customer-reserved stock, and quarantine holds. If available supply is overstated, trust in the report disappears fast.
Supplier lead-time analysis and cost-to-serve dashboards
After service risk and stock risk, use the same warehouse data to figure out which suppliers and customers are driving variability and cost.
Supplier lead-time analysis starts by joining fact_pos and fact_receipts on PO number. Track average lead time, variability, and on-time delivery rate, which is the share of POs received on or before the promised delivery date.
These measures matter because lead-time variance affects safety stock and reorder timing. A supplier scorecard should show, for each supplier, average lead time, P90 lead time, on-time rate, and how often extreme delays happen.
AI adds another layer here. It can spot patterns that get buried in rolled-up averages. For example, a supplier may look fine across the year but slip in Q4 for one product family. That's the kind of signal that should feed into reorder point changes before peak season hits.
Cost-to-serve dashboards pull together freight costs, warehouse handling costs, and delivery costs, then allocate them to orders with plain SQL join logic. For example, line-haul cost on a consolidated load can be spread across shipments by weight or cube.
Expose measures such as:
- Cost per order
- Cost per unit
- Cost per mile
Break those out by customer, lane, channel, and service level.
Lead-time variance shapes inventory policy. Cost-to-serve shows where service levels stop making financial sense. Finance and operations should work from the same allocation logic, not two different versions of the truth.
Choose the tools and access patterns your team will actually use
These workflows only work when planners, operators, and analysts can get to the same governed answers inside the tools they already open every day. Once the foundation is in place, the next move is simple: match each role with the fastest path to an answer they can trust.
What each tool in the stack should do
Each layer should have a clear job.
Your data warehouse - Snowflake, BigQuery, Redshift, or Postgres - is the live system of record. It holds shipment, inventory, order, and cost data in USD.
dbt sits on top of that warehouse and manages transformation and metric logic. Governed models like fct_shipments and fct_inventory_positions stay version-controlled and tested.
Your BI tool - Looker, ThoughtSpot, Hex, or Power BI - then makes those models usable through dashboards and explore views for KPI tracking across ETA risk, stockout risk, supplier delays, and cost-to-serve.
Querio plugs into that same warehouse and context layer. It adds plain-English analysis, inspectable SQL and Python, interactive notebooks with SQL, Python, and drilldowns, scheduled automations, and assistant access through Slack, Teams, or Claude.
How planners, operators, and analysts should access answers
Use one access pattern for each role so routine questions don't turn into ad hoc tickets.
Planners work in Slack and Teams. They should be able to ask, "Which SKUs are at high stockout risk in the Midwest this week?" and get a straight answer plus a link to the notebook behind it - no ticket required.
Operators need scheduled exception reports before the morning standup. A 7:30 AM automation that flags late shipments by carrier, pick waves behind schedule, and inbound POs at risk of stockout gives them something they can act on before the day gets moving.
Analysts need room to go deeper. They should be able to open the interactive notebook behind any answer, inspect the SQL, change filters, or push the analysis further in Python.
Passport Global deployed Querio on top of its Snowflake warehouse in 2025, enabling 100+ internal team members and 1,000+ merchant customers to run self-serve analysis, with granular one-off investigations dropping from two weeks to roughly one hour. [1]
Dashboard-only workflows vs. notebooks plus governed self-serve
This matters because ETA exceptions, stockout risk, and supplier delays need two things at once: steady monitoring and root-cause analysis. That's where the gap between these approaches starts to show.
| Criteria | Dashboard-Only | Dashboards + Notebooks + Governed Self-Serve |
|---|---|---|
| Flexibility | Fixed views; ad hoc questions require analyst support | Ask new questions over governed data models anytime |
| Time to root cause | Slow; requires tickets and manual exports | Fast; pivot, drill, and test hypotheses in minutes |
| Audit trail | Often ends up in emailed Excel files | All queries tied to warehouse tables and version-controlled code |
| Non-technical users | Easy for monitoring; limited for nuanced questions | Chat-based access and scheduled exceptions, no SQL required |
The combined setup keeps dashboards as the monitoring layer. Then, when someone needs to dig deeper, they can click straight into an interactive notebook and keep working from the same governed models behind the dashboard.
That’s the access model that makes daily standups, exception queues, and analyst deep-dives move faster.
Run AI analytics as part of daily supply chain operations
Set up daily and weekly operating rhythms
After the warehouse model, metrics, and access patterns are in place, the next step is cadence. In plain terms: once the workflows are built, plug them into day-to-day operations on a fixed schedule.
At 7:00 AM every day, send a delay digest and stockout review to Slack or email before standup. Each week, publish carrier scorecards. Each month, review cost-to-serve by customer and channel so teams can support pricing and network decisions.
Daily exceptions should trigger fast action. Weekly and monthly reviews help teams spot repeat patterns and deeper cost problems. Automate outputs that repeat. Keep analysts in the loop when judgment affects customer commitments or major cost decisions.
Measure success with speed, trust, and business impact
Once this rhythm is in place, check whether the team is getting answers faster and working from the same numbers.
Track time to answer. For mature teams, the goal is under five minutes for most operational questions. [5][6] Trust shows up when the same on-time rate or fill rate appears in dashboards, AI queries, and weekly reports. That’s when teams stop arguing about whose number is right and start doing something about it.
Traceable logic matters here. Planners and analysts need to see exactly how a risk score or ETA prediction was calculated. One documented case cut expedited shipping costs by 22% - from $2.4 million to $1.87 million per year - after putting AI-driven demand forecasting and inventory optimization in place. [6]
The minimum viable AI analytics setup for logistics teams
The mistake most teams make is simple: they try to build too much, too soon. A minimum viable setup should cover four workflows:
- ETA exception detection
- Stockout risk reporting
- Supplier lead-time analysis
- Cost-to-serve dashboards
These should run on a governed warehouse with a semantic layer that keeps metric definitions consistent.
Each answer should trace back to a warehouse table and a versioned metric definition. That means using dbt models for core entities, role-based access controls, and audit logs that show who ran a query or changed a rule.
Keep answers where people already work - Slack, email, and dashboards - and send high-impact decisions to human review.
FAQs
::: faq
How long does it take to set up a usable AI analytics foundation for supply chain teams?
A usable AI analytics foundation usually takes about 60 days for startups and about 120 days for mid-market companies that have more formal governance and semantic layer needs.
A common rollout looks like this:
- Days 1–30: Audit requests, sort the highest-impact questions first, and assign metric owners.
- Days 31–60: Build the governed semantic layer and run a pilot with a small user group.
- Days 61–90: Measure analyst ticket reduction and refine the setup based on feedback. :::
::: faq
What data quality issues should we fix before launching AI analytics workflows?
Before launching AI analytics, fix inconsistent metric definitions, unclear fields, and missing documentation so results stay trusted and consistent.
Also standardize business definitions for SKUs, units, and supplier codes. Make sure operational data uses stable identifiers, valid grain, and clear timestamp rules. Assign KPI owners, and set up automated checks for issues like negative stock or missing costs. :::
::: faq
Which teams should own metric definitions and daily AI analytics workflows?
Ownership works best when it’s shared.
Data teams or analytics engineers should manage metric definitions in the modeling layer. That includes consistent logic, reusable entities, and governed semantic definitions. This is the part that keeps the numbers stable, so people aren’t arguing over which version is right every time a dashboard changes.
Operations leaders should own those same metrics in day-to-day use. That means they’re responsible for the outcome, alert response, and result validation inside their part of the business. Put simply: the data team sets the rules of the road, and operations drives the car.
That split matters. It keeps data teams focused on governed infrastructure instead of getting pulled into one-off report requests. :::