How to Measure Key Performance Indicators: A Practical Guide
Learn how to measure key performance indicators that drive growth. A practical guide to define, track, and act on real data.
https://www.youtube.com/watch?v=2tuWjtc2Ifk
published
Outrank AI
how to measure key performance indicators, kpi measurement, business metrics, performance tracking, data-driven decisions
330f7666-94e3-4016-b883-d5be8d891aea

Drowning in data but starving for real insights? It’s a common story. Many businesses get so caught up in tracking dozens of metrics that they lose sight of which ones actually move the needle. This guide is about cutting through that noise.
This isn't about collecting more data; it's about finding clarity. We'll walk through a practical, no-nonsense approach to connect your daily metrics directly to your most important business goals. It's a critical skill, especially when you consider that global data creation is expected to blow past 180 zettabytes by 2025. Despite this flood of information, most companies struggle to turn it into smart decisions.
Many organizations are stuck with bloated KPI frameworks, sometimes tracking 50 or more metrics on a single dashboard without a clear understanding of what’s driving real business outcomes. It’s time to change that.
Moving Beyond Vanity Metrics to Meaningful KPIs
To get this right, you need a framework that takes you from just reporting numbers to truly understanding the story they tell about your business. This means shifting your mindset—instead of tracking everything you can, you focus on the vital few indicators that directly impact your strategic goals.
This isn't a one-and-done setup. It’s a continuous cycle of defining what matters, measuring it accurately, and then optimizing based on what you learn.
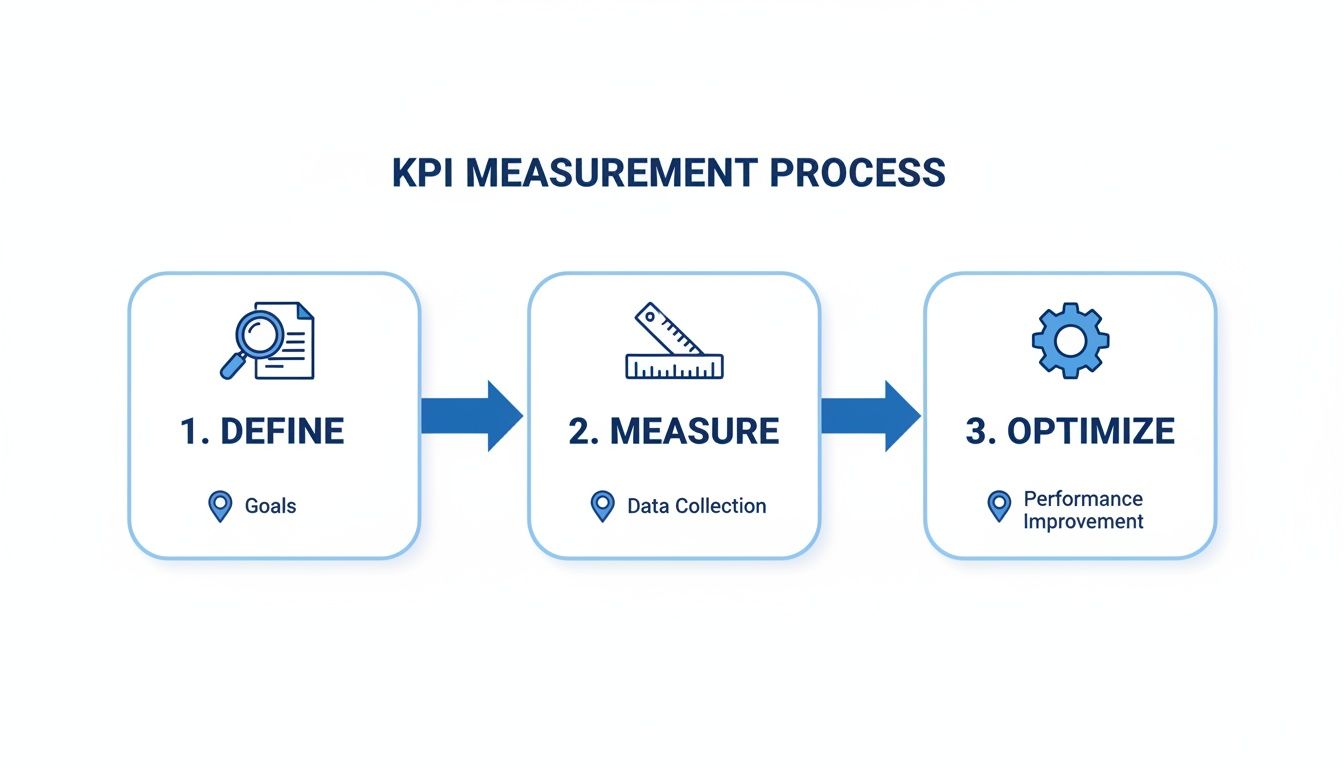
Each stage feeds into the next, which is what keeps your strategy sharp and relevant.
The real value of a KPI isn't the number itself, but the conversation it starts. An effective key performance indicator prompts your team to ask critical questions: "Why did this number change?" and "What should we do next?"
This is what separates high-performing teams from those stuck in data overload. Instead of just admiring a chart, they use it as a springboard for action. For a great example of this in the e-commerce world, check out these Amazon KPIs that actually drive profit. It's a perfect illustration of how focusing on profit-centric metrics can completely reframe your strategy.
To get a clearer picture of the journey ahead, here’s a high-level look at the entire KPI measurement lifecycle.
The 7 Stages of Effective KPI Measurement
Stage | Core Activity | Primary Goal |
|---|---|---|
1. Choose Relevant KPIs | Aligning metrics with strategic business objectives. | Ensure every KPI directly supports a key business outcome. |
2. Define Metrics & Rules | Creating clear, unambiguous definitions for each KPI. | Standardize calculations and eliminate data ambiguity. |
3. Identify Data Sources | Pinpointing where the necessary data lives. | Establish reliable and accurate data collection points. |
4. Set Baselines & Targets | Establishing a starting point and defining success. | Provide context for performance and set clear goals. |
5. Implement & Visualize | Building dashboards and reporting systems. | Make KPI data accessible and easy to understand for all teams. |
6. Validate & Monitor Quality | Regularly auditing data for accuracy and consistency. | Maintain trust in the data and the insights derived from it. |
7. Establish Review Cadence | Setting up a rhythm for review and action. | Turn insights into concrete actions and drive continuous improvement. |
This table maps out the path from initial idea to ongoing optimization. Following these stages will help you build a system that produces real, actionable insights.
Ultimately, learning how to measure KPIs is about creating a culture of accountability and continuous improvement. It provides the clarity needed to align your teams, spend your resources wisely, and make decisions that consistently push your business forward. For a deeper look into this, you might find it useful to read about what metrics really matter and how AI can surface them.
How to Choose and Define Relevant KPIs for Your Business
Choosing the right Key Performance Indicators (KPIs) is where your measurement strategy will either succeed or completely fall apart. It's shockingly easy to get lost tracking dozens of metrics that look impressive in a report but have zero connection to what actually moves the needle for the business.
The secret isn't finding a magic list of "the best" KPIs. It's about forging an unbreakable link between your highest-level company goals and the specific numbers your teams look at every single day.
Think about a single, massive objective like "Increase Profitability." That goal means something entirely different to a product manager than it does to an operations lead or the finance department. This is the whole game. Instead of one generic, company-wide dashboard, you have to translate that big-picture goal into role-specific, actionable indicators that each team can genuinely influence.
Aligning KPIs with Strategic Objectives
The best place to start is by working backward from your most important company goal. If the big-ticket item is growth, what really drives that? Is it acquiring a flood of new customers? Is it increasing the value of the customers you already have? Or is it breaking into totally new markets? Each of those paths demands its own unique set of KPIs.
Let's take that "Increase Profitability" goal and see how it cascades across a few teams:
The Product Team might zoom in on Customer Lifetime Value (CLV). Their work on feature adoption, user experience, and retention directly impacts how much revenue a single customer generates over their entire relationship with you.
The Operations Team will be laser-focused on metrics like Cost Per Unit or Order Fulfillment Time. Their lever for profitability is efficiency, so they measure anything that cuts waste and gets things done faster and cheaper.
The Finance Team, of course, looks at the final score. They'll be tracking Gross Profit Margin and Net Profit Margin—the ultimate indicators of whether all the strategies are actually adding up.
When you take this approach, every single team knows exactly how their daily work feeds into the company's success. It’s no longer abstract.
Asking the Right Questions to Uncover Your KPIs
Once you've tied potential KPIs to strategic goals, you have to define them with absolute, ruthless clarity. A vague KPI is a useless one. A good KPI definition is like a recipe—anyone in the company should be able to follow it and get the exact same number.
To dig in and find what really matters for a specific team, try asking these questions:
What is the one outcome my team is directly responsible for?
What specific actions can we take to influence that outcome?
How can we measure the real-world impact of those actions?
What data do we actually need to make that measurement?
Answering these helps you graduate from a fluffy metric like "user engagement" to something concrete and measurable, like the Daily Active Users to Monthly Active Users (DAU/MAU) Ratio or the Average Session Duration for a key feature. If you need some inspiration, check out our guide with more specific KPI examples for various business functions.
Creating a Clear KPI Definition Template
To make sure everyone is speaking the same language, document every single KPI using a simple, standardized template. This little bit of governance completely eliminates confusion and prevents two teams from reporting different numbers for the same metric.
Component | Description | Example (Customer Acquisition Cost) |
|---|---|---|
KPI Name | A clear, concise name for the metric. | Customer Acquisition Cost (CAC) |
Definition | A plain-language explanation of what it measures. | The total average cost to acquire one new customer. |
Formula | The exact mathematical calculation used. | (Total Sales & Marketing Spend) / (Number of New Customers Acquired) |
Data Source(s) | Where the raw data comes from. | CRM (New Customers), Accounting Software (Spend) |
Owner | The person or team responsible for this metric. | Marketing Team Lead |
Reporting Frequency | How often the KPI is reviewed. | Monthly |
Using a template like this is a deceptively powerful move. It forces clarity from the very beginning and creates a single source of truth. And as you define your acquisition metrics, it’s critical to learn how to calculate Cost Per Acquisition (CPA) correctly to avoid common and costly mistakes.
A well-defined KPI is more than a number—it’s a contract between teams. It sets clear expectations, defines success in unambiguous terms, and makes sure everyone is pulling in the same direction.
This is what it looks like in practice. A modern business intelligence tool can bring these critical KPIs to life in a clean dashboard. By visualizing metrics like Monthly Recurring Revenue (MRR) and Churn Rate, teams can see what’s happening at a glance, allowing them to spend their time on analysis and action, not digging through spreadsheets.
Setting Baselines and Realistic Performance Targets
So, you’ve picked your KPIs. Great. But a number on a dashboard is just that—a number. Without context, it doesn't tell you if you’re winning, losing, or just treading water. This is where baselines and targets come in. They’re what turn a simple metric into a powerful tool for driving real progress.
Think of a baseline as the "you are here" marker on a map. It’s a snapshot of your current performance before you start making changes. You absolutely have to know where you're starting from to have any clue if your efforts are actually paying off.
It’s simple, really. You can't measure improvement if you don't know your starting line.

Grounding Your Goals in Reality
Setting good targets is a delicate dance. If you aim too high, you’ll just demoralize your team with goals that feel completely out of reach. But if you aim too low, you're encouraging everyone to coast, leaving a ton of potential growth on the table. The sweet spot is grounding your ambitions in cold, hard evidence.
I've found there are three solid ways to set targets that are both challenging and realistic:
Look at your own history. Dig into your performance data from the last six to twelve months. What are the trends? If your customer acquisition cost has been creeping up by 2% every quarter, setting a target to slash it by 10% next month is probably a fantasy unless you're planning a massive strategic overhaul.
Check industry benchmarks. How do you stack up against the competition? Industry reports and trade associations are goldmines for this kind of data. Knowing the average SaaS churn rate in your niche is 5% gives you a much-needed reality check for your own retention goals.
Analyze your competitors. This one can be tricky, but it's not impossible. Public statements, investor reports, and case studies can offer clues about how your rivals are performing. This helps you set targets that aren’t just about internal improvement but about gaining a real competitive edge.
By blending these approaches, you stop pulling targets out of thin air. Your goals become data-driven, strategic, and, most importantly, believable.
The Power of Tiered Goal Setting
Here’s a pro-tip I’ve seen work wonders: ditch the single, all-or-nothing target. Instead, create a tiered system that defines different levels of success. This adds nuance and keeps teams motivated, even if they don't quite hit that moonshot goal.
A simple tiered structure might look something like this:
Tier | Description | Example (Monthly Active Users) |
|---|---|---|
Baseline | The absolute minimum acceptable performance. | Maintain at least 5,000 MAU. |
Target | The realistic goal we expect the team to hit. | Achieve 6,000 MAU. |
Stretch | The ambitious goal for when everything goes right. | Reach 7,500 MAU. |
This kind of system recognizes that performance isn't just a pass/fail. It allows you to celebrate solid progress while still pushing for those blowout quarters, fostering a much healthier and more motivating culture. If you need a hand with the math, our guide on using a KPI calculator for smarter business insights can help you streamline the process.
A target should stretch your team, but not break them. The best goals live at the intersection of ambitious and achievable, inspiring action rather than anxiety.
This is the core philosophy behind measuring KPIs effectively. It’s not about obsessing over an arbitrary number; it’s about building a system that drives continuous, sustainable improvement across your entire organization.
Building Dashboards That Tell a Clear Story
So, you’ve defined your KPIs and set your targets. That’s the hard part, right? Well, now it's time to bring them to life. This is where you move from theory to practice, building a central hub that tells your performance story with clarity and precision.
The real goal here is to finally break free from the soul-crushing cycle of clunky, manual spreadsheets. We're moving toward automated, real-time insights that actually empower your team to make smart moves, fast.
This isn't just about making life easier; it's a fundamental change in how you run your business. Real-time KPI dashboards have become essential for modern leadership, completely changing how organizations react to performance data. The shift in behavior is huge—leaders go from old-school, after-the-fact management to a state of constant awareness. As problems surface sooner, you can jump in before they snowball. You can find more insights on real-time dashboards at leandatapoint.com.
The Shift From Manual Reporting to Automated Insights
For as long as I can remember, the go-to tool for tracking KPIs has been the spreadsheet. We all know it, but let's be honest, it’s loaded with problems that can seriously hold you back. Manual data entry is tedious, a breeding ground for human error, and it creates a bunch of disconnected data silos. By the time you piece a report together, the numbers are already old news.
This is where automated dashboards, powered by modern business intelligence (BI) tools, change the game. They create a single source of truth by plugging directly into your data sources—your CRM, accounting software, product analytics—and pulling everything in automatically. Everyone looks at the same live numbers, all the time. No more arguments about whose spreadsheet is correct.
AI-powered platforms like Querio take this a step further. They don't just connect your data; they let anyone on your team ask questions in plain English. You don't need to know SQL or wait in line for an analyst to get you what you need. This kind of accessibility is what builds a true data-informed culture, where curiosity is rewarded with immediate answers.
A great dashboard doesn't just vomit data onto a screen; it answers your most pressing business questions at a glance. It should feel less like a dense report and more like a clear, interactive conversation about your performance.
The right dashboard becomes your team's command center, providing the clarity needed to be proactive instead of just reacting to last month's news.
Designing Dashboards for Clarity and Action
A truly powerful dashboard isn't a chaotic jumble of every metric you can think of. It's an exercise in strategic design and ruthless prioritization. The best ones tell a story, guiding your eyes to the most important information first.
To build a dashboard that people actually want to use, stick to a few core principles:
Create a Clear Visual Hierarchy: Your most critical KPIs—like total revenue or customer churn—should be front and center. Make them big and bold at the top. Supporting metrics that add context can be smaller and placed below.
Choose the Right Visualization: Please, stop using pie charts for everything. Line charts are perfect for showing trends over time, bar charts are great for comparisons, and simple number cards are ideal for those top-line KPIs. The goal is to make the data effortless to understand.
Avoid Clutter at All Costs: Every single thing on your dashboard needs a purpose. If a chart doesn’t directly help answer a key business question, get rid of it. White space is your best friend—it reduces mental overload and makes the important stuff pop.
To help you put this all together, our team built a handy resource. Before you jump into your BI tool, take a look at our guide on creating a KPI dashboard planner. It'll help you map out your structure and make sure it aligns perfectly with what you’re trying to achieve.
Manual Spreadsheets vs Automated Dashboards
When you put the old way of doing things next to the new way, the difference is night and day. Seeing the comparison makes it pretty clear why upgrading your process is a no-brainer.
Feature | Manual Tracking (Spreadsheets) | Automated Tracking (BI Platform) |
|---|---|---|
Data Timeliness | Outdated, often weekly or monthly | Real-time or near real-time updates |
Accuracy | High risk of human error in data entry | Data pulled directly from sources, ensuring accuracy |
Accessibility | Limited access, often siloed in files | Centralized and accessible to the entire team |
Analysis | Manual and time-consuming | Automated analysis and interactive deep-dives |
Collaboration | Difficult to share and collaborate on | Built-in sharing, commenting, and collaboration |
Ultimately, building effective dashboards is the final, crucial step in learning how to measure key performance indicators. It’s what connects your strategy to confident, data-backed execution.
Creating a Rhythm for KPI Reviews and Adjustments

Learning how to measure key performance indicators isn't a project you just check off a list. It's a living, breathing part of how you run your business. The most brilliant dashboards in the world are useless if they just sit there gathering digital dust. The real magic happens when you build a steady, predictable rhythm for looking at the numbers and, more importantly, doing something about them.
This is where you move from just having data to building a data-informed culture. It’s not about cramming more meetings onto everyone’s calendar. It’s about weaving KPI discussions into the conversations your teams are already having, making data a natural and essential part of every decision.
Matching KPIs to the Right Meeting Cadence
Not all metrics are created equal, and they definitely don't all need to be checked every single day. Trying to dissect a long-term strategic KPI in a daily huddle is a complete waste of time. On the flip side, waiting an entire quarter to check a critical operational metric could be a recipe for disaster.
The trick is to match the KPI's velocity—how quickly it changes and how fast you can actually influence it—to the right review schedule.
Here’s a practical framework I’ve seen work time and again:
Daily Huddles: These quick, 15-minute stand-ups are perfect for high-velocity, operational metrics that the team can directly impact today. Think daily sales qualified leads or customer support tickets resolved. The conversation is tactical, focused on unblocking immediate issues.
Weekly Team Meetings: Here, you zoom out just a little. These meetings are the place for leading indicators that predict future outcomes. You might review the sales pipeline growth from the past week or the feature adoption rate for a new product release. The goal is to spot trends early and make course corrections for the week ahead.
Monthly Business Reviews: Now you’re looking at a blend of leading and lagging indicators. This is a good time to dig into metrics like Customer Acquisition Cost (CAC) or Monthly Recurring Revenue (MRR) growth. You're assessing how the month's strategies played out and planning for the next one.
Quarterly Strategic Reviews: This is the 30,000-foot view. Leadership gets together to look at the major lagging indicators that define the health of the business—things like Net Profit Margin, Customer Lifetime Value (CLV), and market share. The discussion here is all about overall strategy and whether fundamental changes are needed for the next quarter.
By slotting your KPIs into the right cadence, you make sure every conversation is relevant and leads to action. Nobody feels like they're sitting through a meeting looking at numbers that don't matter to their work.
The Unspoken Rules of KPI Governance
"KPI governance" sounds stuffy and corporate, but it's really just a simple plan for keeping your metrics sharp, relevant, and trustworthy. Without it, I guarantee your beautiful, carefully built dashboard will slowly degrade into a mess of outdated, confusing, and irrelevant numbers.
This really boils down to two simple but powerful practices: assigning clear ownership and knowing when it's time to let a KPI go.
A key performance indicator without an owner is just a number. A KPI with a clear owner becomes a commitment—a promise to understand, report on, and improve that specific aspect of the business.
This is non-negotiable. Every single KPI you track needs a designated owner. This isn’t just the person who pulls the data; it’s the person who is ultimately accountable for that number's performance. They are the go-to expert who can explain why it moved and what the team is doing about it.
Knowing When to Retire a KPI
Finally, you have to be willing to say goodbye. KPIs aren't meant to be permanent. Your business evolves, your strategy shifts, and a metric that was critical last year might just be noise today.
You should regularly ask these simple questions about every KPI you track:
Does this metric still directly connect to a current strategic goal?
Are we actually making decisions based on this number?
Is there a new, better metric that tells a more accurate story?
For example, a startup might obsessively track website visitors in its first year. But as the business matures, the visitor-to-lead conversion rate becomes a far more meaningful metric to focus on. It’s a natural evolution. Running a "KPI audit" once or twice a year is a healthy practice that keeps your measurement system lean, focused, and powerful.
Common Questions About Measuring KPIs

As you start rolling out a new KPI framework, questions will inevitably surface. That’s a great sign—it means your team is thinking critically about what really moves the needle. Let's dig into a few of the most common questions I hear from teams on the ground.
These aren't just academic debates; they're the practical hurdles that can derail your whole measurement strategy. Nailing these down is what turns data into a real competitive edge.
How Many KPIs Should We Actually Track?
There’s no magic number here, but I can tell you this: less is almost always more. I've seen far too many teams build a dashboard with 20+ KPIs, and it's a classic recipe for disaster. They end up drowning in data but starving for actual insight. The most important signals get completely lost in the noise.
A good rule of thumb is to stick to 3-5 primary KPIs for any single department or strategic goal. For the big picture—say, an executive-level dashboard—you really shouldn't have more than 7-10 top-level metrics. It forces you to be ruthless about what truly matters.
Here's a simple test: if a metric doesn't directly inform a critical decision or track progress on a core business goal, it’s probably a vanity metric. Demote it to a secondary operational report or get rid of it. The goal is focus, not just data collection.
What’s the Difference Between a Leading and a Lagging Indicator?
Getting this right is absolutely fundamental to managing performance effectively. It's the difference between driving by looking through the windshield versus staring into the rearview mirror.
Let's break it down:
Lagging Indicators measure what has already happened. They tell you the final score. Think of metrics like "Revenue in Q3" or "Annual Customer Churn Rate." They're simple to measure because the events are in the past, but you can't do much to influence them in the short term.
Leading Indicators are predictive. They give you a hint of what’s to come. Examples would be the "Number of Sales Demos Booked this Week" or "New Trial Sign-ups." These metrics are often a bit messier to track, but they are things your team can directly impact with their day-to-day actions.
A smart KPI strategy needs both. You use leading indicators to manage your weekly activities and get a feel for whether you're heading in the right direction. Then, the lagging indicators confirm if those activities actually produced the long-term results you wanted.
Lagging indicators tell you if you hit the target. Leading indicators tell you if you're on track to hit the target. Both are essential for a complete picture of business health.
How Do We Get Our Team to Actually Use the Dashboards?
Ah, the million-dollar question. Building a great-looking dashboard is one thing; getting people to make it part of their daily routine is another challenge entirely. It all comes down to relevance and accessibility.
First, involve your team from the very beginning. When you're picking the KPIs for their department, get them in the room. When people have a say in choosing the metrics they'll be measured on, their sense of ownership goes through the roof.
Second, the data has to be dead simple to access and understand. This is where modern tools really shine, letting anyone explore information without needing a data science degree. When people can get answers to their questions in seconds, they naturally start digging deeper.
Finally, weave the dashboard into your existing rhythms. Make it the centerpiece of your weekly team huddles, one-on-ones, and project check-ins. When performance conversations are consistently grounded in shared, visible data, the dashboards stop being a chore and become the team's shared language for success.
Ready to build a data-informed culture where anyone can get answers? Querio is an AI-powered business intelligence platform that makes it easy for every team to query, visualize, and analyze information without writing a single line of code. Stop waiting for reports and start making faster, smarter decisions today. Learn more at https://www.querio.ai.

