Guide
Self Service Analytics Architecture: A Practical Guide
Learn how to design a self service analytics architecture that balances governance, speed, and trust. Covers semantic layers, governance, and real reference
The self-service analytics market is projected to grow from USD 6.62 billion in 2026 to USD 21.93 billion by 2034, a projected 16.14% CAGR over that period, according to Fortune Business Insights' self-service analytics market coverage. Yet market expansion doesn't guarantee adoption. Industry analysis citing BARC-based reporting places average BI tool adoption at about 15% of employees in mid-to-large companies, while a joint BARC and Eckerson study found adoption around 25% and said it had barely moved over seven years, as summarized by Upsolve's analysis of self-service analytics.
That gap changes the architectural question. The problem isn't whether employees have access to dashboards. It's whether they can find the right data, understand how a metric was calculated, verify its lineage, and use it without creating another unofficial version of the truth. A self service analytics architecture succeeds when it makes trustworthy exploration easier than private spreadsheets, copied SQL, and requests queued behind a data team.
Table of Contents
- Why Self Service Analytics Architecture Matters Now
- What Self Service Analytics Architecture Is
- The Eight Core Components and How They Connect
- Three Reference Architecture Patterns Compared
- Implementation and Migration Checklist
- Scaling for Trust, Provenance, and Mixed Skill Levels
- Measuring Success Beyond Dashboard Counts
Why Self Service Analytics Architecture Matters Now
Cloud data platforms, BI products, catalogs, and AI-assisted interfaces are receiving sustained investment, yet usage remains uneven. Leadership backing for self-service initiatives is widespread, and lakehouse platforms now support a substantial share of analytics workloads. The platform layer is modernizing faster than the user layer can convert access into confident decisions.
The gap usually appears in a simple question: “What does revenue include?” If the answer changes with the dashboard, data mart, analyst, or SQL query a person finds first, the organization has created multiple interfaces to competing interpretations. Users may have access, but they cannot verify which result deserves trust.
Practical rule: If a business user can't inspect the definition and origin of a number, treat that number as an adoption risk, not merely a documentation gap.
Self-service analytics emerged in the early 2010s as a response to IT-led reporting models that had dominated the prior decade. Those models protected consistency while making every new question dependent on a specialist. Modern platforms often reverse the trade-off, giving teams flexible tools without a durable contract for metrics, access, and provenance. The evolution of self-service analytics from 2015 to 2025 shows how the category has changed while the adoption problem has persisted.
Trust becomes harder to maintain as more people use the system. A small team can resolve an unclear definition through direct conversation with the data owner. A larger organization cannot rely on that context. Copied calculations create parallel interpretations, while unexplained discrepancies reduce confidence in later dashboards, even when those dashboards use valid data.
That makes provenance a product requirement, not a catalog feature. Users should be able to see the source, transformation path, metric definition, owner, and refresh status without opening a ticket or reading implementation code. These details let analysts verify results before sharing them and let business users challenge a number using evidence rather than intuition.
The architecture should therefore optimize for independent verification, alongside independent querying. A fast answer that nobody trusts is slower in operational terms than a governed answer that takes slightly longer to produce. Certified metrics, visible lineage, understandable business terms, and controls applied before data reaches a dashboard make the trusted path the shortest path.
What Self Service Analytics Architecture Is
A self service analytics architecture is a layered operating system for data access, building on the fundamentals of self-service data analytics. It connects operational sources to governed business concepts and exposes those concepts through interfaces suited to different users. The architecture determines not only who can query data, but whether users can verify how a result was produced.
The flow starts with ingestion. Application databases, SaaS systems, event streams, files, and other operational sources land in a warehouse or lakehouse. Storage provides a durable foundation, yet raw tables preserve system records rather than business meaning. A column named status, for example, may be technically clear while remaining ambiguous to a commercial user.
Transformation cleans, joins, tests, and organizes those sources into usable models. Each model needs an owner, documented dependencies, and a clear refresh expectation. Business definitions should remain discoverable outside transformation code, because self-service users cannot validate a dataset by reading every pipeline that created it.
The semantic layer as the contract
The semantic layer sits between modeled warehouse data and downstream consumers. It defines metrics, joins, dimensions, terminology, and calculation rules once, then makes them available to dashboards, notebooks, APIs, and AI assistants. IBM's explanation of the semantic layer describes it as a way to centralize business meaning and prevent different consumers from resolving the same KPI differently.
That makes the semantic layer an architectural contract. A dashboard may change, a notebook may be replaced, and an AI interface may evolve. The definition of “active customer” should remain stable until an accountable owner changes it deliberately and records the change.
Access, governance, and consumption
Access controls apply permissions to underlying data and governed models. Role-based access control, row-level security, column-level security, and masking should operate near the warehouse or lakehouse, rather than depending only on settings inside individual reports.
The consumption layer adapts the same governed concepts to different work. Executives may need a curated metric view. Analysts may need exploratory notebooks and SQL. Product managers may need a conversational interface, while engineers may need programmatic access. Self-service means each user can work independently within defined boundaries, not that every user receives the same interface.
The query engine connects these experiences to live or appropriately refreshed warehouse data. Centralized metric logic can still support different tools through APIs or database interfaces. Hex's guidance on self-service analytics emphasizes separating models, query execution, metrics, and user-facing workflows.
Metadata and provenance complete the design. Users should see dataset ownership, refresh timing, source systems, applicable filters, and metric calculations at the point of use. Without that evidence, a polished interface conceals uncertainty instead of making analysis trustworthy.
The Eight Core Components and How They Connect
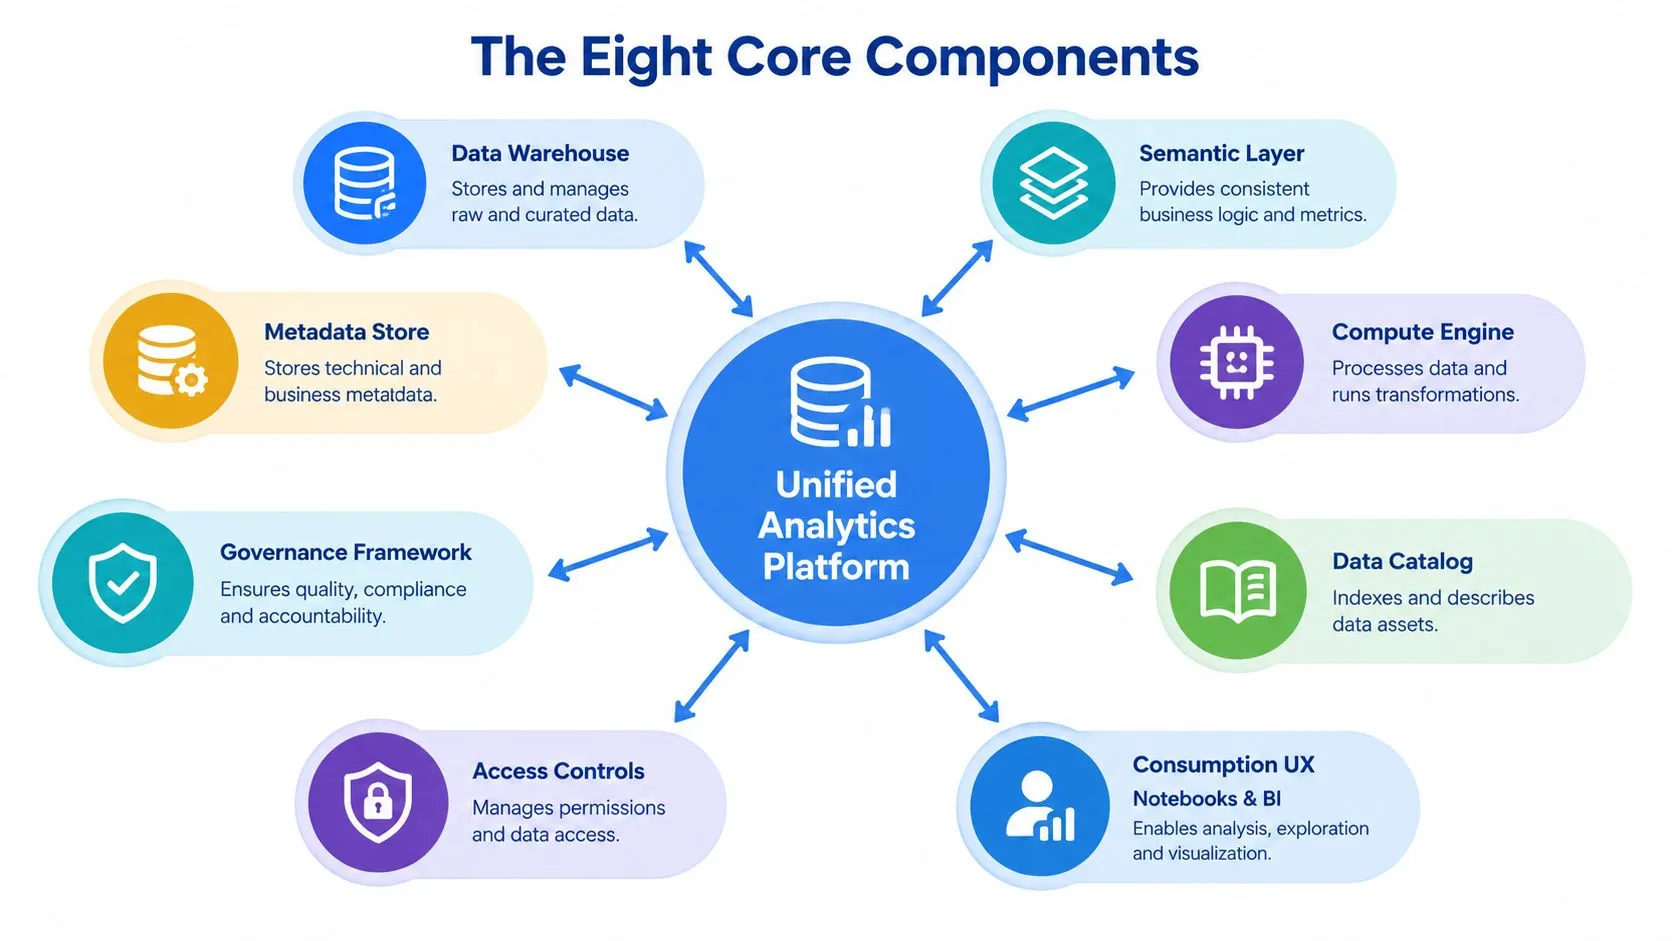
A self-service platform behaves like a system of dependencies. The warehouse stores and organizes data, the compute engine executes work, and the consumption layer presents results, but the semantic layer is the trust backbone connecting those capabilities to business meaning.
The eight components are:
- Data warehouse or lakehouse, which holds raw, modeled, and curated data.
- Semantic layer, which standardizes metrics, joins, dimensions, and terminology.
- Compute engine, which executes transformations, queries, notebooks, and AI-assisted analysis.
- Data catalog, which makes assets searchable and records ownership and descriptions.
- Consumption UX, including notebooks, BI tools, applications, and conversational interfaces.
- Access controls, including role, row, column, and masking policies.
- Governance framework, which defines certification, ownership, change management, and acceptable use.
- Metadata and observability, which capture lineage, freshness, query behavior, quality signals, and cost.
These parts don't deliver equal value at every stage. Teams often optimize compute because slow queries are visible, then discover that users still avoid the platform because they can't distinguish an approved dataset from an abandoned one. A faster engine can't resolve an ambiguous metric. A catalog can't correct a flawed definition. A dashboard can't compensate for missing lineage.
The relationships that make the stack trustworthy
The catalog should index warehouse and lakehouse assets, but it should also point users toward governed semantic objects rather than presenting every table as equally suitable. Governance should define how an asset becomes certified, and that certification should appear in the catalog and consumption tools. Access controls need to follow the data through compute, not disappear when a user moves from a dashboard into a notebook.
Monitoring closes the loop. Query history can show which models are expensive, which metrics are reused, and where users bypass governed assets. Lineage can show the impact of a source change before a report breaks. Quality signals can give users a reason to pause when a familiar metric has incomplete or stale inputs.
A catalog tells users what exists. Provenance tells them whether they should believe it.
The implementation sequence matters because each component supplies context to the next. Semantic layers and their key benefits are most useful when they govern definitions that have clear owners and reliable upstream models, not when they are added as another naming layer over unresolved source data.
The architectural test is simple: can a user move from a result back to its metric definition, then to its source, owner, refresh status, and access policy without leaving the workflow? If not, the platform may be technically integrated but operationally fragmented.
Three Reference Architecture Patterns Compared
Three patterns appear repeatedly in production environments. None is universally correct. The right choice depends on domain maturity, the organization's tolerance for central control, and whether cross-domain consistency matters more than local speed.
| Dimension | Federated | Hub-and-Spoke | Lakehouse-Native |
|---|---|---|---|
| Control | Distributed across domain teams, with shared policies where possible | Centralized modeling, access, and certification | Often centralized at storage and platform level, with domain variation in analysis |
| Flexibility | High for mature domains with strong ownership | More limited because central teams coordinate changes | High for notebooks, data science, and unstructured exploration |
| Time-to-value | Fast for domains that already have reliable models | Predictable for standardized enterprise reporting, slower for new requests | Fast for technical teams close to the lakehouse |
| Semantic consistency | Requires a shared semantic layer and cross-domain review | Stronger by default because definitions are centrally managed | At risk when logic remains inside notebooks or dashboards |
| Main failure mode | Fragmented governance and conflicting cross-domain metrics | Central team bottlenecks and frustrated domain specialists | Governance and metric definitions arrive after adoption has already fragmented |
Federated architecture
Federated designs let domains own their data products while a shared semantic layer and catalog provide cross-domain structure. This works well when product, finance, operations, and marketing teams have capable owners who can maintain models and respond to quality issues.
The trade-off is organizational, not merely technical. A shared customer concept can still acquire different meanings across domains unless the organization establishes an explicit resolution process. Federated architecture maximizes autonomy, but it turns consistency into a collaboration problem.
Hub-and-spoke architecture
Hub-and-spoke places the warehouse, transformation standards, semantic models, and much of governance under a central data function. Domain teams consume trusted assets and request additions through a managed process.
This pattern is effective for regulated reporting and companies that need strong metric control. It becomes painful when the central team treats every exploratory question like a production data product. Users then create shadow datasets because the official path is too slow for their decisions.
Lakehouse-native architecture
Lakehouse-native platforms favor flexible storage, notebook workflows, and broad access to structured and less structured data. They suit technical teams doing exploratory analysis, machine learning, and engineering-heavy work.
The weakness appears when business users need stable definitions. If “revenue” lives in several notebooks and dashboard calculations, the platform has enabled exploration without creating a shared business language. The best lakehouse implementations add semantic modeling and certification early rather than bolting them on after conflicting reports spread.
Choose the pattern that matches your operating maturity, not the one that looks most modern in a reference diagram.
Implementation and Migration Checklist
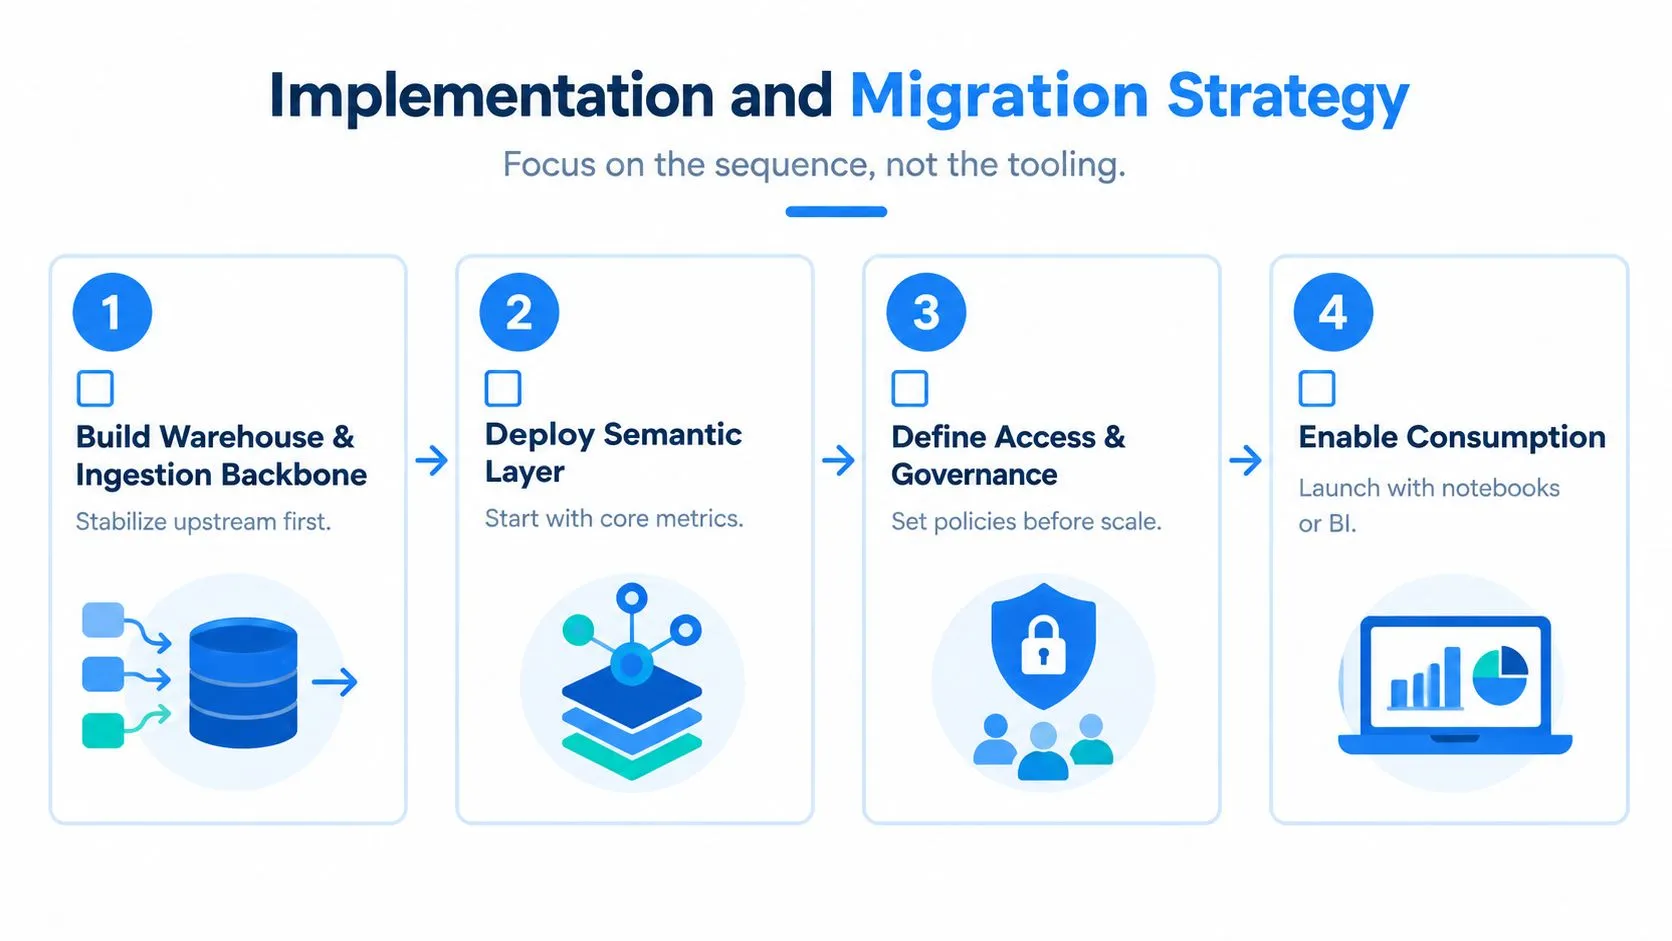
Sequence matters more than product selection. A team that introduces a polished BI interface before stabilizing data contracts and metric ownership may generate immediate activity, but it also makes later correction expensive because users become attached to inconsistent outputs.
Establish the foundation first
Start by inventorying the sources that matter for the first use case. Build ingestion and storage around reliable refresh behavior, identifiable owners, and observable failures. Don't attempt to expose every source at once. A smaller set of dependable data products creates a stronger base for trust than a large catalog filled with unverified tables.
The first release should produce a usable warehouse or lakehouse backbone and a documented source-to-model path. That artifact gives engineers something concrete to monitor and gives users an answer when they ask where a number came from. Guidance from AWS on building self-service analytics solutions similarly places integration, catalogs, lineage, quality, fine-grained access, and role-specific workflows at the center of the implementation.
Define a small metric contract
Add the semantic layer before opening broad access. Start with a narrow set of canonical metrics chosen from a real decision workflow, such as pipeline value, retention, order volume, or support backlog. The exact metrics depend on the business, but each needs an owner, definition, grain, filters, refresh expectation, and lineage path.
This step forces disagreements into the open while the scope is still manageable. It also prevents each dashboard author from deciding independently what a term means.
Put controls in front of scale
Configure access policies, certification states, lineage collection, and change review before users build widely. Row-level and column-level restrictions should apply consistently across BI, notebooks, APIs, and AI-assisted workflows. Retrofitting those controls after users have copied data into private extracts creates both technical cleanup and political resistance.
Release monitoring at the same time. Track failed refreshes, expensive queries, stale models, permission denials, and use of uncertified assets. A cost report or lineage-enabled dashboard is more useful than a launch presentation because it proves the platform is operating.
Roll out discovery and personas
Publish curated datasets in the catalog once they have owners and meaningful descriptions. Then sequence enablement by persona:
- Analysts first, because they can test definitions, identify edge cases, and help improve the exploration workflow.
- Operational managers next, because they need repeatable answers tied to active decisions.
- Executives after that, because executive reporting depends on stable definitions and concise presentation.
Each phase should ship an artifact, such as a certified dataset, a lineage-enabled dashboard, a governed notebook, or a query cost report. Training should teach users how to verify a result, not only how to click through a visualization.
Scaling for Trust, Provenance, and Mixed Skill Levels
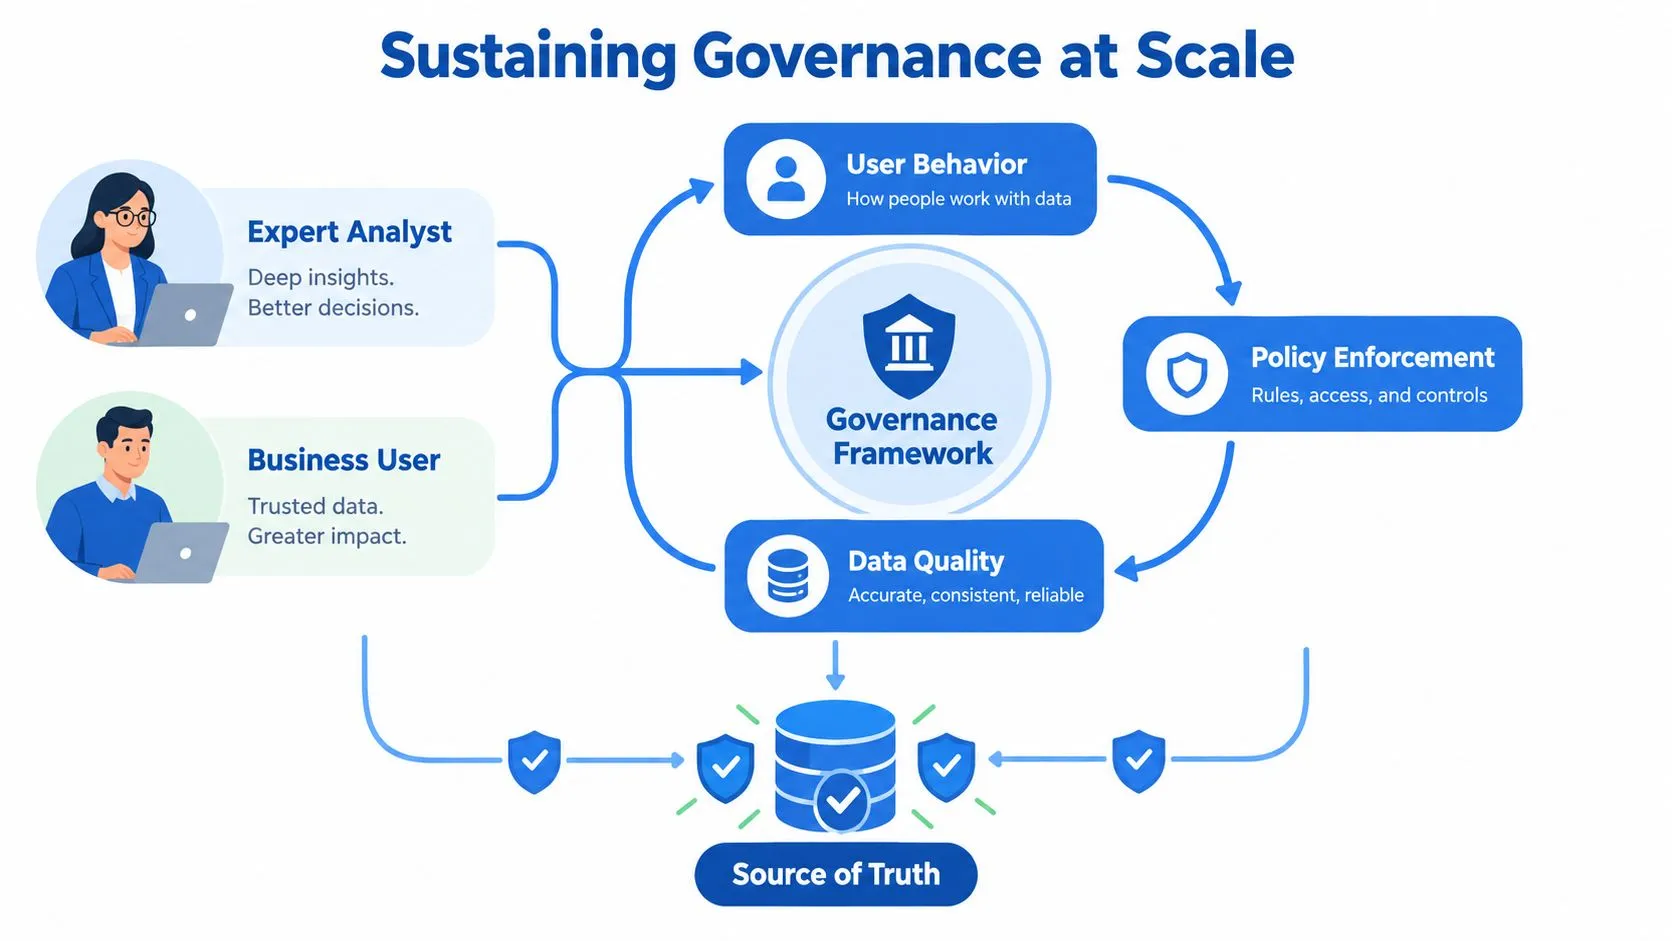
Self-service adoption stalls when users cannot verify how a number was produced. Compute capacity matters, but trust usually fails earlier. A user may accept a learning curve. They will not accept different answers from different interfaces without an explanation they can inspect.
Growth creates three related risks. Teams duplicate metric logic across reports, notebooks, and ad hoc queries. AI-assisted querying can produce plausible answers from an incomplete or misunderstood schema. Technical and non-technical users also need different levels of control, so one interface rarely serves every decision equally well.
The architecture should expose provenance by default rather than hide it behind BI abstractions. The distinction between leadership support and active business-user engagement appears in discussions of analysis of self-service enablement and data trust, but the practical design test is simpler: can a user verify the source, definition, transformation, and freshness of an answer before sharing it?
Make provenance part of the result
Lineage belongs beside the result, not in a separate governance portal that users must remember to open. Show source references, metric definitions, refresh status, owner, filters, and certification state in the exploration flow. A “why this number” panel often provides more value than another chart because it lets users test an answer before repeating it in a meeting.
Certification should attach to the semantic object or governed dataset, not only to a dashboard. A certified dashboard can otherwise coexist with many uncertified copies of the same underlying logic. Certification only works when it sits inside a real data governance framework with named owners and change management.
Constrain AI without killing exploration
Natural-language interfaces reduce the skill required to ask a question, while making incorrect answers easier to produce. An AI assistant should resolve requests against approved semantic models rather than raw warehouse tables whenever possible. The interface should show generated logic or an explanation, identify the underlying metric, and signal when the request falls outside the governed model.
Recent guidance on self-service analytics strategy describes a move from distributing BI tools toward centralizing governance while preserving flexible interfaces, including AI-assisted querying and notebook workflows. The architectural implication is direct: AI needs clearer semantic structure, not less.
Separate interfaces by risk and skill
A shared policy layer can support several experiences:
- Curated metric views for leaders who need approved answers with minimal configuration.
- Exploration workspaces for analysts who need filters, joins, and iterative investigation.
- Notebook environments for engineers and advanced analysts who need Python, SQL, or deeper modeling.
- AI-assisted query tools for users who need plain-language access within defined boundaries.
Querio illustrates a workflow that combines plain-language questions, approved definitions, live warehouse data, role-based access, and notebook-style analysis. The interface can vary by persona. The source, metric, permission, and provenance layers should not.
Measuring Success Beyond Dashboard Counts
Dashboard counts measure production. Query volume measures activity. Neither proves that users trust the system or that the architecture improves decisions.
A useful measurement program should combine adoption velocity, provenance, reuse, and decision quality. Avoid inventing a universal target. A healthy baseline is the current behavior captured consistently, followed by improvement in the direction that matters for the business.
| Metric | How to Measure | Healthy Baseline | Failure Signal |
|---|---|---|---|
| Time to first insight | Track the time from a new user's access approval to their first validated answer | New users reach a verified answer through the governed path without repeated help requests | Users open the platform but still depend on analysts for basic questions |
| Certified metric reuse rate | Compare references to certified semantic metrics with copied calculations across reports and notebooks | Certified definitions appear repeatedly in active decision workflows | Teams recreate the same KPI in separate assets |
| Lineage coverage | Measure how much of the actively used analytical surface has visible source, model, owner, and refresh metadata | Frequently used datasets and metrics have inspectable provenance | Users can't explain where important figures originated |
| Decision reversal rate | Review decisions made from analytics and record how often later evidence forces a material reversal caused by data or definition issues | Reversals are investigated and separated from normal business uncertainty | Leaders stop trusting analytics after unexplained discrepancies |
| Governed to shadow dataset ratio | Compare actively used approved assets with unmanaged extracts, private tables, and unofficial reports | Governed assets become the default route for recurring analysis | Shadow data grows because the official workflow is too slow or confusing |
The first metric exposes friction at onboarding. The second exposes metric drift. The third measures whether trust is visible rather than assumed. The fourth distinguishes a bad business outcome from a bad analytical input, and the fifth shows whether governance is changing behavior or merely documenting it.
Review these measures together each quarter. A platform with rising query volume but weak lineage coverage may be creating more unverified answers. A platform with fewer dashboards but stronger certified-metric reuse may be serving decisions better.
The question isn't how much analytics the company produces. It's how often people can defend the number they use.
A quarterly trust review should record the strongest adoption path, the most common provenance failure, the metrics with competing definitions, the users who still need analyst intervention, and the shadow assets worth replacing. Leadership can then decide whether the architecture is earning continued investment through reliable self-service or merely accumulating license and maintenance costs.
Build your first self-service analytics workflow around a small set of governed metrics, visible lineage, and the interfaces your teams already use. Explore how Querio lets business users ask plain-language questions against approved warehouse definitions while data teams retain control of context, access, and deeper analysis.