Guide
How to Improve Team Productivity for Data Teams
Learn how to improve team productivity in data and product teams. Discover a framework to fix bottlenecks, automate analytics, and scale output effectively.
The most popular advice on how to improve team productivity starts in the wrong place. It tells analysts to manage their calendars, protect their focus, and process requests faster. Those habits can help an individual, but they won't fix a data team that spends its day translating vague questions, locating inconsistent definitions, rebuilding familiar reports, and waiting for approvals.
A productive data team isn't a collection of fast individual contributors. It's a system that turns business questions into reliable decisions with minimal coordination waste. That requires clear ownership, measurable throughput, governed self-service, and management practices that keep people engaged. Gallup's global workplace research found that only 20% of workers worldwide were engaged in 2025, while low engagement was associated with an estimated $10 trillion in lost productivity globally, roughly 9% of global GDP. The reported engagement findings and productivity estimate point to a structural problem, not a personal time-management failure.
Table of Contents
- Redefining Productivity for Modern Data Teams
- Diagnosing Workflow Bottlenecks and Collaboration Waste
- Setting Measurable KPIs for Focus and Throughput
- Scaling Output with Self-Serve Analytics and Automation
- Managing Change and Aligning Team Expectations
- Measuring Long-Term Impact and Continuous Refinement
Redefining Productivity for Modern Data Teams
A busy data team can still be a low-throughput system. Analysts answer tickets, engineers repair pipelines, product managers request custom cuts, and executives ask for another dashboard version. Individual effort remains high, yet delivery slows because each request requires fresh interpretation, coordination, and validation.
This creates a human API. The data team becomes the access layer for information across the organization. A stakeholder submits a question, an analyst translates it, an engineer checks the data, someone validates the result, and the requester returns with a clarification. The team is manually routing access to data instead of building reliable paths to it.
Individual output and team throughput measure different outcomes. An analyst can close many requests while leaving the organization dependent on that analyst tomorrow. A stronger operating model turns recurring questions into documented definitions, reusable queries, governed datasets, and interfaces that non-technical colleagues can use independently.
Practical rule: If a request repeats, improve the system instead of merely handling it faster.
Engagement is an operating condition
Engagement affects whether people can sustain careful analytical work. Gallup's research links higher engagement with a 10% increase in customer loyalty and engagement. The Gallup engagement research supports an operating implication: protect attention, reduce avoidable clarification work, and give people enough context to make decisions without repeated escalation.
For a data leader, this means measuring working conditions alongside delivery. Analysts should not spend their strongest cognitive hours reconstructing definitions or locating basic context. Managers should assess clear priorities, credible ownership, accessible documentation, and protected analytical time rather than treating visible busyness as commitment.
A support channel still has a legitimate role. Sensitive access, expert judgment, and bespoke modeling require specialist involvement. Routine access should follow a different path. A virtual personal assistant can absorb repeatable administrative work, and governed self-service can absorb repeatable information requests, leaving professionals to handle decisions that require judgment.
Product thinking changes the team boundary
Internal users should be treated as customers of a data product. The team needs to define user problems, document the intended experience, observe where people fail, and improve the interface over time. The case for product thinking in modern data teams is strongest when technical correctness is evaluated alongside usability: can the right person answer the right question without opening another ticket?
That standard changes what productivity means. It includes decision throughput, reliability, quality, discoverability, and the amount of specialist intervention each request requires. A productive team removes recurring demand from the critical path while preserving expert capacity for high-value analysis. The result is a data function that scales through clearer interfaces and reusable infrastructure, not through more individual effort.
Diagnosing Workflow Bottlenecks and Collaboration Waste
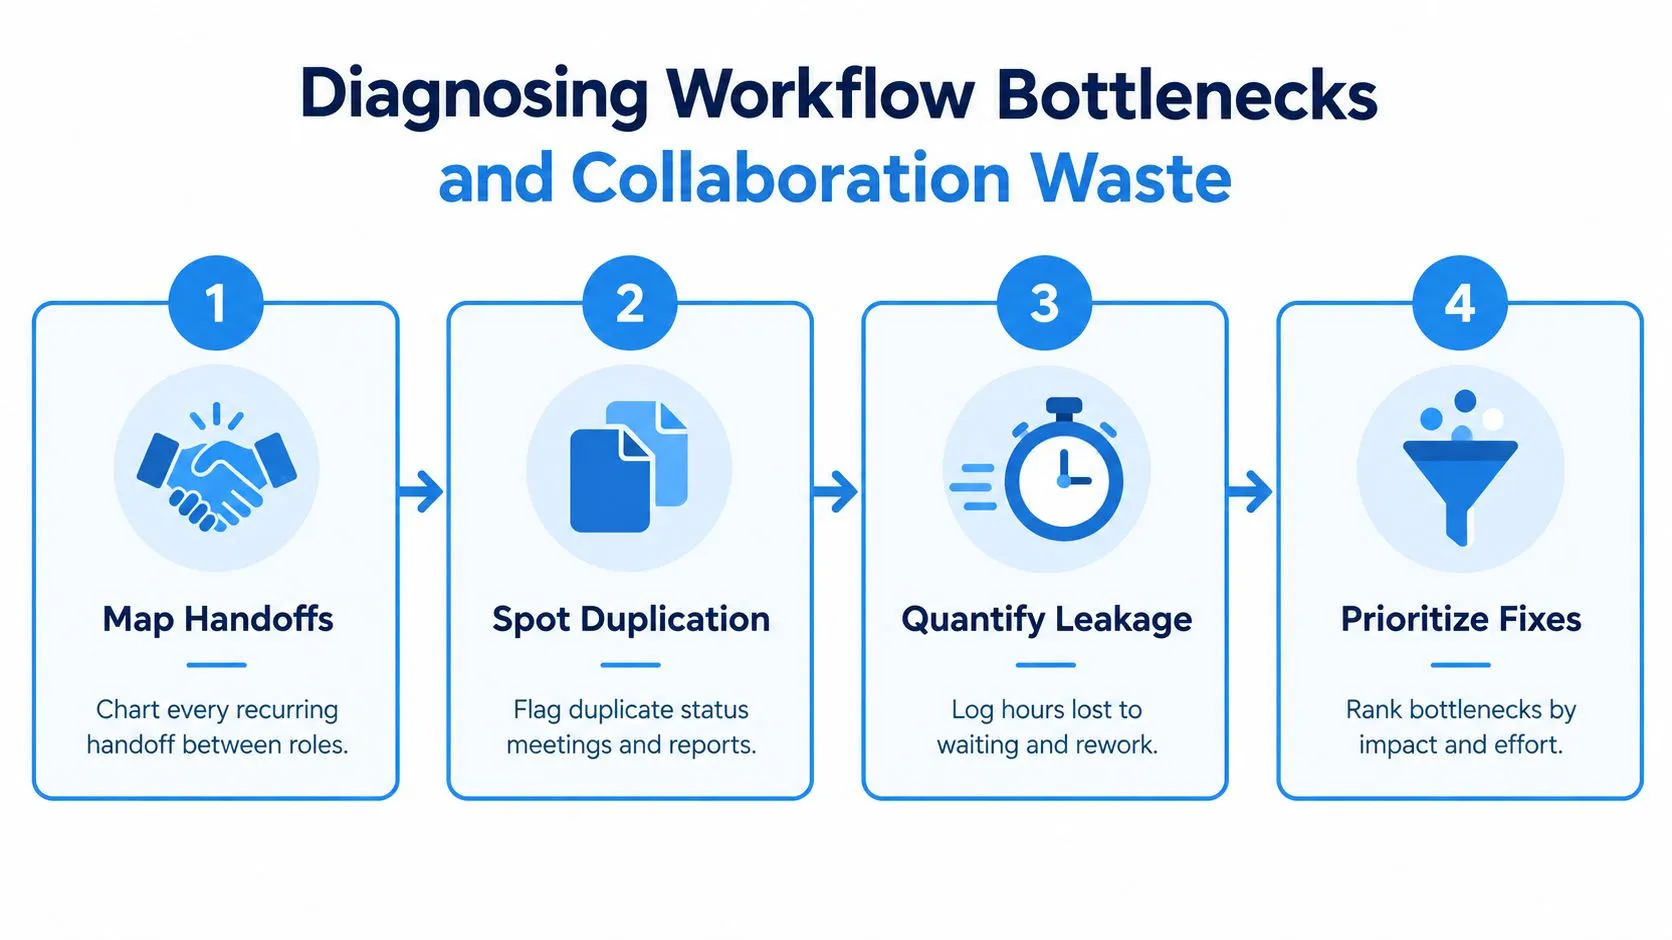
Before buying another analytics tool, map how work moves. Data leaders often optimize visible production, such as query writing or dashboard delivery, while missing the interfaces where work stalls. The largest leak may sit between product and data, between analytics and engineering, or between an approved definition and its implementation.
Research on collaboration found that poor collaboration can reduce team productivity by an average of 39%, with the loss rising to 60% for the least effective teams. The collaboration findings from SHRM support a useful diagnosis: capacity disappears through miscommunication, unclear ownership, waiting, and rework.
Map the request path
Start with a sample of recurring work, not an abstract process diagram. Follow each request from intake to delivery and record:
- Requester and owner: Who asks the question, and who is accountable for the answer?
- Handoffs: Which roles touch the work before delivery?
- Waiting states: Where does the request pause for access, clarification, validation, or deployment?
- Rework: Which answers lead to corrections because definitions or assumptions weren't shared?
- Duplicate reporting: Which meetings, spreadsheets, dashboards, or status messages repeat the same information?
This exercise often reveals that the analyst isn't the bottleneck. The bottleneck is an unclear metric definition, a missing permission model, or a workflow that requires several people to confirm a routine fact.
Separate coordination from coordination waste
Not every handoff is wasteful. A sensitive financial metric may need review, and a production change may require engineering ownership. The diagnostic question is whether the handoff protects quality or merely compensates for missing context.
Measure collaboration load alongside delivery. Count recurring meetings, messages that request status rather than decisions, clarification cycles, and time spent locating the authoritative dataset. Then compare that load with the work that ships. A team can reduce meetings and still become less productive if it removes necessary decisions while leaving ownership unclear.
The fastest workflow isn't the one with the fewest steps. It's the one where every step has a reason, an owner, and a visible exit condition.
Use a lightweight weekly review to identify blocked work. Assign one owner to each deliverable, document the decision needed to unblock it, and remove duplicate reporting once a reliable source of truth exists. Leaders who want a broader operational checklist can also consult this Fluidwave guide to team productivity.
The human API pattern deserves special attention. If analysts repeatedly answer the same category of question, the team should treat that demand as evidence for a product or infrastructure investment. Reducing the data team's bottleneck role starts with measuring which requests are predictable enough to standardize and which still require expert intervention.
Setting Measurable KPIs for Focus and Throughput
A team can't improve what it defines poorly. Hours worked and message volume are attractive metrics because they're easy to collect, but they describe activity rather than value. They can reward immediate responsiveness even when constant responsiveness prevents the deep work needed for reliable analysis.
Knowledge-worker benchmarks identify focus time, collaboration load, workday span, and AI adoption as core productivity metrics. The same benchmark source reports that employees are interrupted roughly every 2 minutes and may need more than 23 minutes to regain focus after an interruption. The knowledge-worker productivity benchmarks make the measurement problem clear: a calendar full of activity can conceal a fragmented operating system.
Build a baseline before setting targets
Begin with a representative period and record the team's actual work patterns. Don't use the baseline to rank individuals. Use it to find system conditions that make delivery harder.
Track:
- Focus time: Periods reserved for analysis, modeling, coding, or writing without scheduled collaboration.
- Collaboration load: Meetings, recurring status work, clarification threads, and approval steps tied to delivery.
- Workday span: The distance between the first and last work activity, interpreted carefully rather than treated as a performance score.
- Throughput: Completed analytical deliverables, shipped models, resolved high-value questions, or released reusable assets.
- Quality and rework: Corrections, failed handoffs, unclear definitions, and revisions after delivery.
Then connect each measure to an operational decision. If collaboration load is high, redesign intake. If focus time is fragmented, cluster meetings and protect deep-work blocks. If throughput is stable but rework rises, improve definitions and review gates rather than pushing for more output.
Replace visible activity with useful signals
| Metric Type | Traditional (Vanity) | Modern (Throughput) |
|---|---|---|
| Effort visibility | Hours logged | Decision-ready deliverables completed |
| Responsiveness | Messages answered | Requests resolved through documented self-service |
| Meeting activity | Meetings attended | Decisions made and recorded |
| Dashboard production | Reports created | Trusted assets reused by stakeholders |
| Individual utilization | Calendar filled | Focus time protected for high-value work |
| AI usage | Tool access | Governed workflows that reduce rework |
The distinction matters because a metric changes behavior. If managers reward response speed, analysts keep checking channels. If managers reward reusable assets and reliable decisions, analysts have a reason to improve the system.
For a practical framework that connects measurements to management decisions, use this guide to measure key performance indicators. Review KPIs with the team, explain what each metric is for, and remove any measure that encourages gaming or surveillance.
Scaling Output with Self-Serve Analytics and Automation
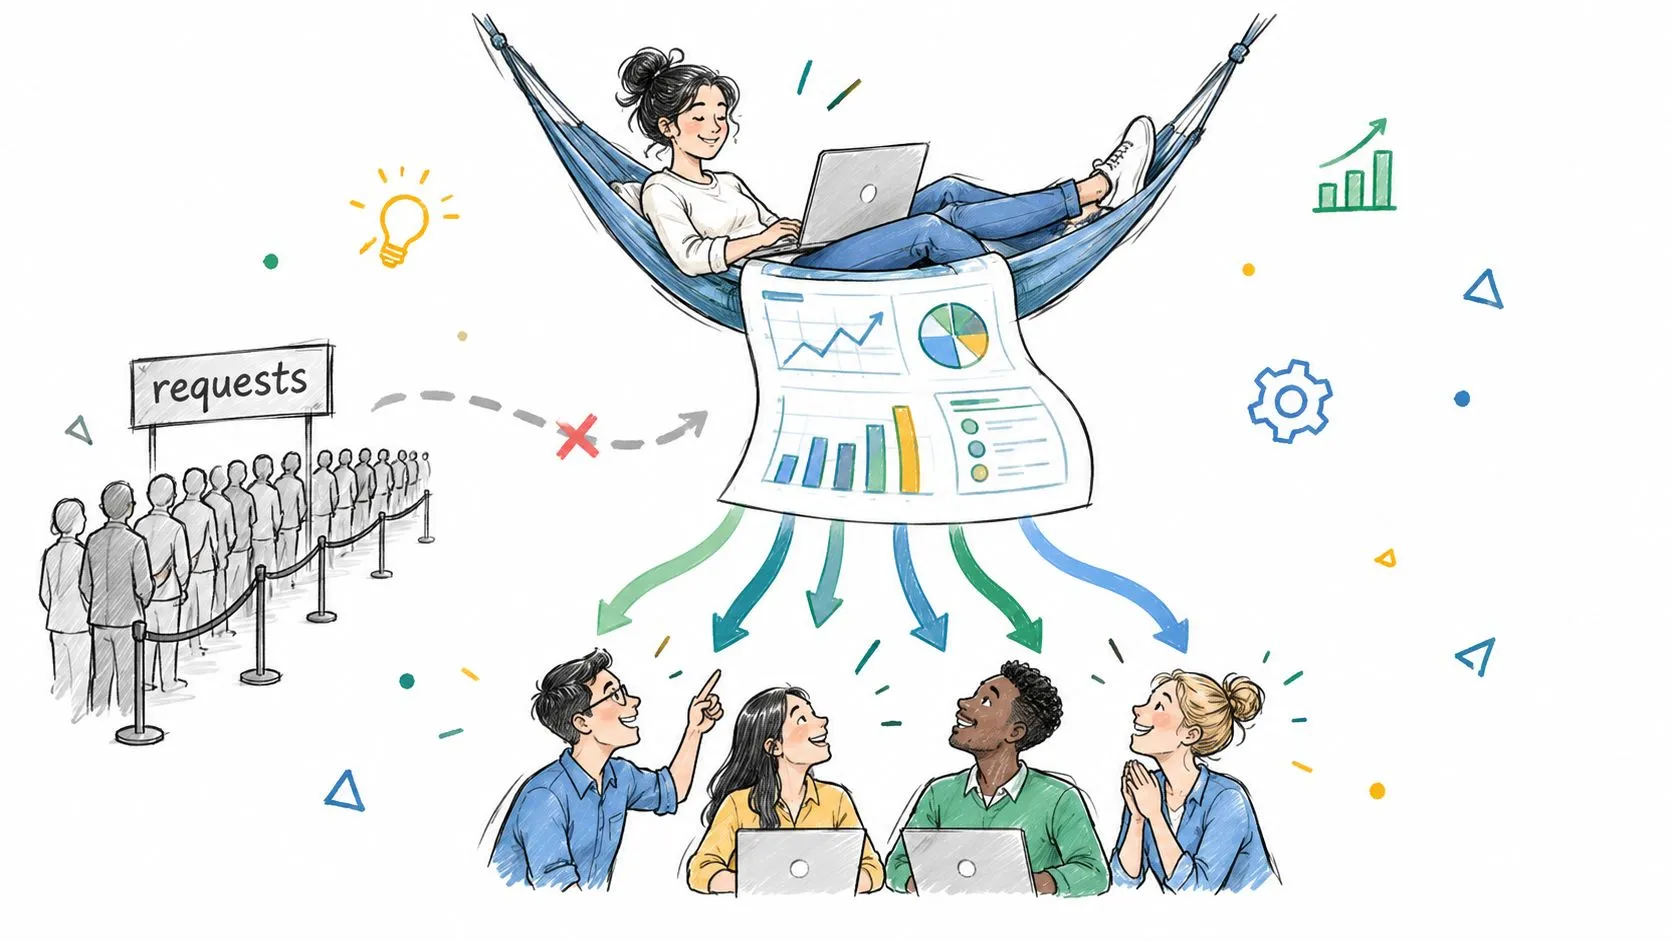
The most direct way to increase data-team capacity is to remove routine questions from the specialist queue. That doesn't mean giving everyone unrestricted access to raw tables. It means building a governed path from a business question to a reproducible answer, with permissions, definitions, and context embedded in the workflow.
A self-serve system can include curated warehouse models, semantic definitions, templates, notebooks, approval rules, and searchable documentation. It should let a product manager explore an approved dataset while routing sensitive or ambiguous work to an analyst. This is different from installing a chatbot and hoping usage creates impact.
Design the self-serve boundary
A useful boundary has three layers:
- Safe exploration: Non-technical users can answer recurring questions against governed data without changing production logic.
- Collaborative analysis: Users can comment, compare assumptions, and share a result with the relevant team.
- Expert escalation: Analysts and engineers handle new metrics, sensitive data, complex joins, and production changes.
AI coding agents and automated notebooks can make the second layer more flexible. Instead of forcing every user into a rigid dashboard, the team can provide a controlled environment where questions become inspectable analysis. The code, assumptions, and output remain connected, which makes a result easier to review and reuse.
The risk is fragmentation. Atlassian's 2026 State of Teams survey reported that uncoordinated AI transformation costs the Fortune 500 $161 billion annually, highlighting the need for shared workflows, governance, and training rather than isolated tool adoption. Atlassian's State of Teams discussion supports a critical design principle: AI access without operating standards can create more versions of the truth.
Before rollout, define approved data sources, naming conventions, access roles, review requirements, and escalation routes. Train users on how to validate an answer, not just how to generate one. Instrument the system so the team can see which questions are answered successfully, which fail, and where users return to manual support.
A warehouse-native platform such as Querio uses AI coding agents and custom Python notebooks to let technical and non-technical users query and build on company data within a shared environment. Its relevance here isn't the interface alone. The operating-model shift is from answering every request to maintaining infrastructure that makes reliable answers repeatable. Teams evaluating that approach can review how lean data teams deliver company-wide self-service analytics.
The following walkthrough illustrates how a team can structure that transition from request handling to delegated analysis.
Managing Change and Aligning Team Expectations
New infrastructure doesn't create productivity by itself. People must understand when to use it, trust the outputs, and know what happens when it fails. Without that operating agreement, employees often revert to direct messages and personal spreadsheets because those paths feel faster than learning an unfamiliar system.
Hybrid work adds another coordination risk. UNC Charlotte researchers found that teammates' expectations about where others work can change team effort even when individual output stays comparable. The UNC Charlotte research on remote work and team productivity suggests that explicit norms may matter more than a blanket return-to-office rule.
Make collaboration predictable
Write norms that answer operational questions rather than expressing broad preferences:
- Which requests belong in the self-serve workspace?
- Where should users record assumptions and definitions?
- When does a question require an analyst?
- What information must be included before a request enters the queue?
- Which decisions happen synchronously, and which are documented asynchronously?
- How should distributed teammates signal availability and expected response times?
These rules reduce the belief gap around how work happens. A product manager shouldn't need to guess whether an analyst is available, and an analyst shouldn't need to infer whether a request is urgent from a message timestamp.
Treat adoption as a product funnel
Track adoption through behavior. Identify where users stop: discovering a dataset, forming a question, validating an answer, sharing the result, or returning for another analysis. Each failure point suggests a different fix. Better documentation addresses discovery, templates address question formation, and review guidance addresses validation.
Start with a narrow group of recurring use cases. Let users attempt real work, observe their questions, and revise the data model or interface. The data team should publish examples that reflect actual decisions, not generic demonstrations. When users see a direct connection between self-service and their own work, adoption becomes less dependent on training sessions.
Managers also need to protect the data team's role. Self-service shouldn't become an excuse to transfer ambiguous work to unprepared stakeholders. Set clear escalation routes, review the quality of self-serve outputs, and recognize analysts for reducing repeated demand through durable improvements.
Measuring Long-Term Impact and Continuous Refinement
Productivity improvement is a control loop, not a launch project. After changing intake, collaboration norms, or analytics infrastructure, leaders should test whether the team delivers more valuable work with less avoidable friction. A dashboard cannot answer that alone. Reviews must connect workflow signals with quality, engagement, and business outcomes.
As established earlier, higher engagement correlates with higher productivity. That relationship makes team health an operating metric, not a separate human-resources topic. Review trends in engagement, analyst retention, and capacity alongside delivery measures. The Gallup's engagement benchmark provides context for keeping this connection visible without repeating the earlier productivity comparison.
Use a layered review cadence
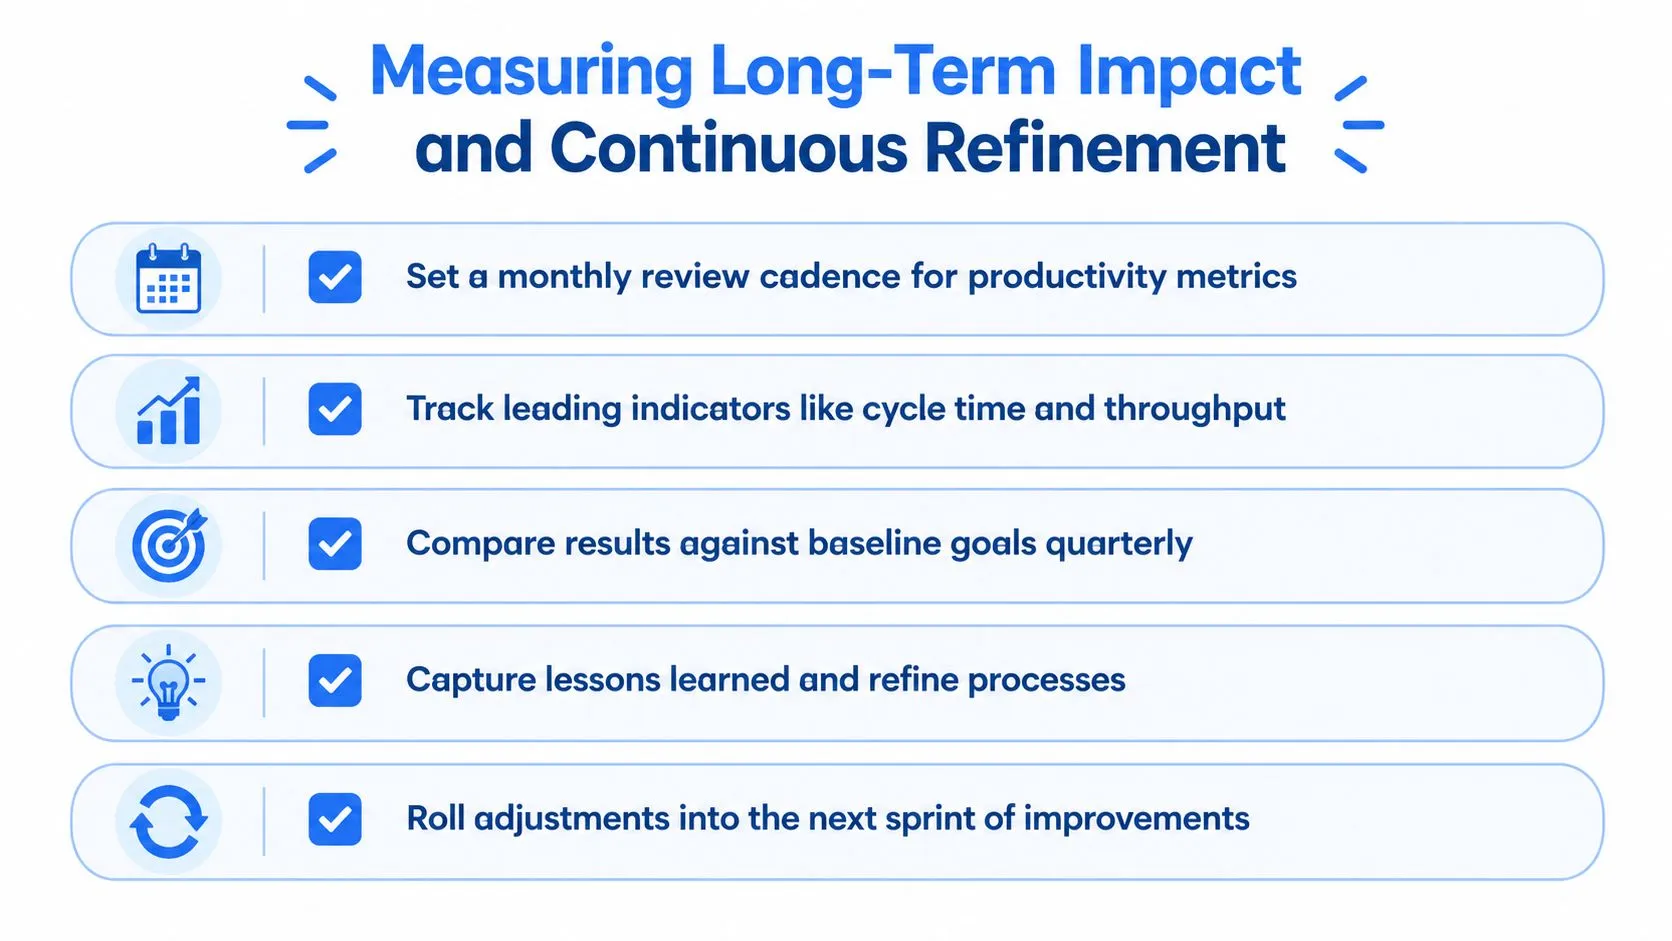
Monthly, inspect leading indicators: focus time, collaboration load, blocked work, self-serve usage, failed queries, and requests requiring manual intervention. Add the percentage of recurring questions resolved through self-service and the time from question to decision. Segment results by workflow, not by individual rankings.
Quarterly, compare the operating model with its baseline. Check cycle time, rework, strategic capacity, analyst retention, and whether self-serve resolution is improving. Review access controls and documentation at the same time. A productivity gain that weakens governance will not last.
After each meaningful change, collect user feedback and inspect behavior. If stakeholders avoid self-service, examine data definitions, permissions, and interface friction before assigning blame. If analysts bypass the system, identify the missing capability that sends work back to the human API.
Sustainable productivity comes from making the right behavior easier than the workaround.
The final test is business relevance. A stronger workflow should improve decision clarity, deliver important analysis reliably, and reduce dependence on a few specialists. It should also give the data team more capacity for modeling, experimentation, and strategic partnership.
Querio gives data teams a shared, governed workspace where AI coding agents and custom Python notebooks help technical and non-technical users query, analyze, and build on warehouse data without routing every question through analysts. Visit Querio to evaluate whether its self-serve analytics model can reduce the human API bottleneck.