Guide
Real Time Data Analytics: Architecture, Trade-Offs
Master real time data analytics with practical guidance on streaming architectures, latency SLAs, tool evaluation, and self-serve models for lean data teams.
Real-time data analytics is often sold as an automatic upgrade from batch reporting. That advice is incomplete. Faster data only creates value when someone, or some software system, can act before the information loses its usefulness. Otherwise, a streaming pipeline can turn a straightforward nightly job into a permanent operational commitment, complete with schema management, late events, freshness alerts, on-call work, and a larger bill.
The market momentum is real. One 2026 forecast valued the global real-time analytics market at USD 43.8 billion in 2026 and projected USD 223.3 billion by 2033, a 26.2% CAGR across that forecast period, while another forecast estimated USD 18.60 billion in 2025 and USD 68.40 billion by 2035, with a 13.92% CAGR from 2026 to 2035. The methodologies differ, but both forecasts point to a multi-tens-of-billions-dollar category with sustained double-digit growth expectations. (Persistence Market Research)
I've migrated two companies from batch systems to streaming. In both cases, the hardest question wasn't whether we could process events quickly. It was whether freshness changed a decision, a customer experience, or a measurable loss. That distinction should govern your architecture.
Table of Contents
- Why Real Time Data Analytics Is Not Always the Answer
- Streaming Versus Micro-Batch Processing Explained
- Core Architecture Components and Latency SLAs
- Use Cases That Justify Real-Time Investment
- Migrating From Batch Systems and Evaluating Platforms
- Building a Self-Serve Operational Model
- Next Steps for Startup and Mid-Market Data Teams
Why Real Time Data Analytics Is Not Always the Answer
The popular advice says that every dashboard should become real time. That's the wrong default. A dashboard refreshed every few seconds can look impressive while leaving revenue, retention, and operating decisions unchanged.
A practical test is simple: what action happens earlier because this data is fresher? If the answer is unclear, sub-second processing is probably solving a technical preference rather than a business problem. A finance report used in a weekly planning meeting doesn't become more valuable because its underlying query runs continuously. A support manager reviewing staffing trends may be perfectly served by scheduled updates.
The distinction matters because real-time systems add work in places batch pipelines often hide. Engineers must manage out-of-order events, transient data, replay behavior, stateful transformations, schema changes, and alerts that fire while the business is still operating. Analysts also have to reason about eventual consistency, partial windows, and metrics that may change after an event arrives late.
Practical rule: Define the decision deadline before you define the data latency. Don't pay for sub-second freshness when the business response happens at a human timescale.
A decision filter for latency
Classify each request according to the consequence of delay:
- Immediate intervention: Fraud blocking, security response, inventory protection, or automated pricing can justify streaming when delayed information changes the outcome.
- Fast operational awareness: A logistics or incident dashboard may benefit from minute-level freshness, but it may not need individual-event processing.
- Periodic analysis: Executive reporting, financial planning, and many product reviews usually work with batch or micro-batch data.
- Historical learning: Model training and trend analysis often need completeness and reproducibility more than the freshest possible events.
The market's adoption signals shouldn't be mistaken for proof that every organization needs the same latency. A 2025 Omdia finding cited in recent coverage reported that 82% of IoT enterprises were using or planning to use real-time data processing, but intent doesn't equal mature implementation, and it doesn't establish a business case for every workload. (IJSRMST review)
Before approving a streaming build, write down the metric it should move, the latest useful decision time, the cost of a stale result, and the fallback behavior when the stream is unavailable. The real-time analytics ROI discussion is useful for framing that business case, but the final decision still belongs to the team that owns the outcome.
Streaming Versus Micro-Batch Processing Explained
Real-time data analytics sits on a spectrum. Treating “real time” as a single architecture leads teams to overbuild.
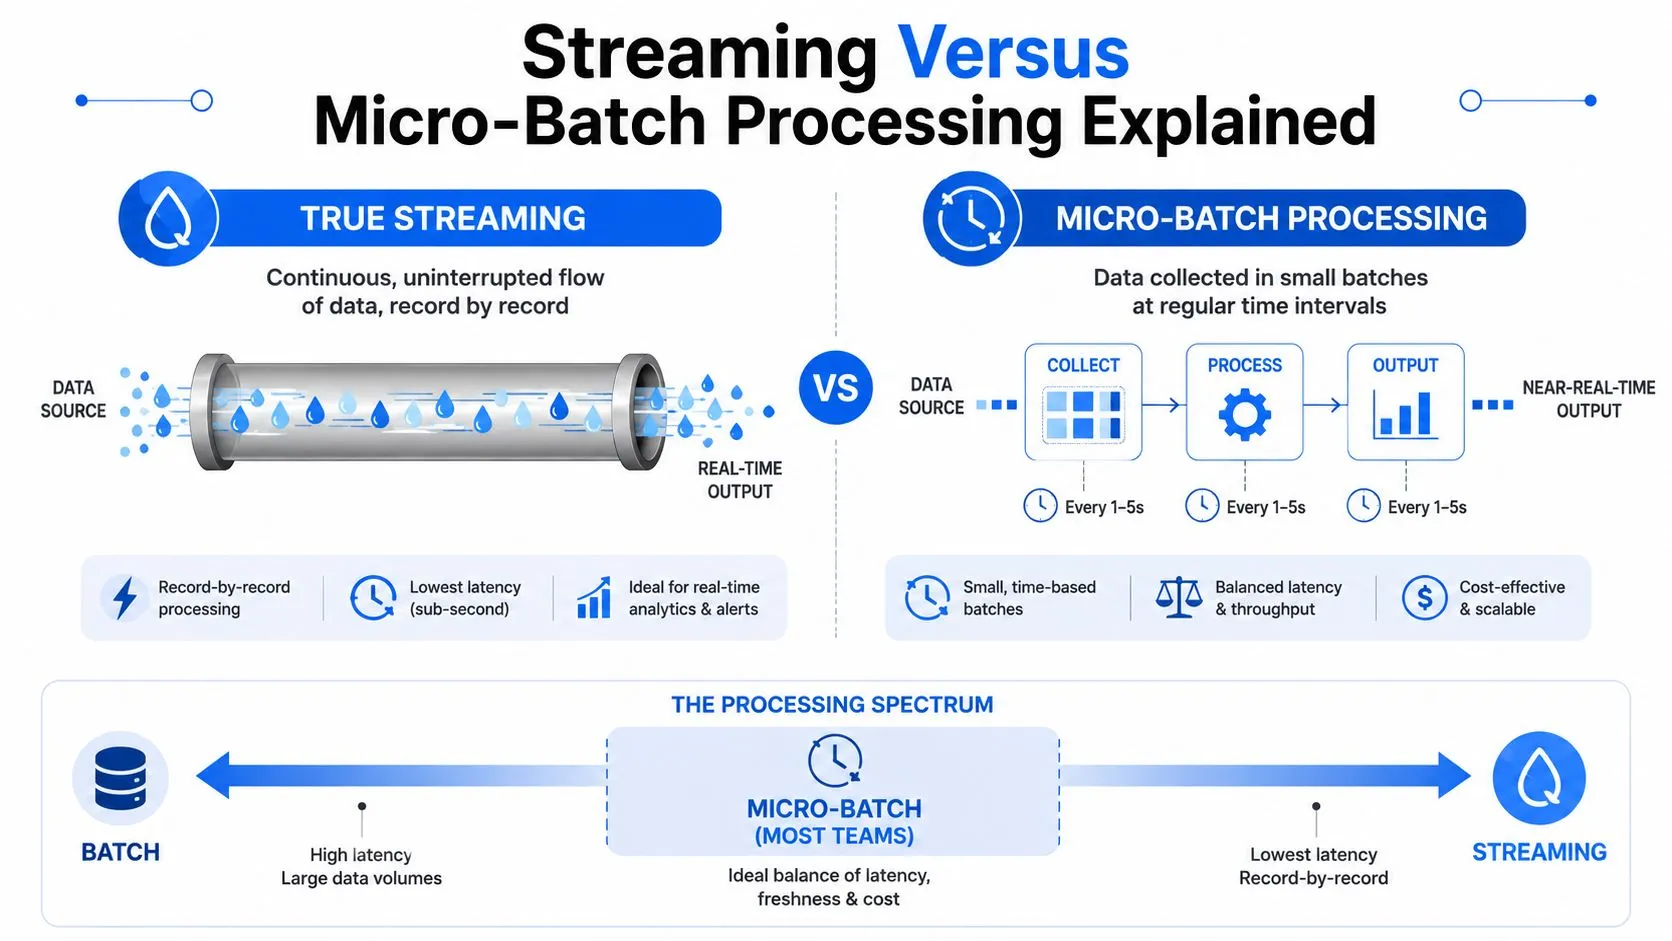
Batch processing collects a large volume of data and processes it together. An overnight ETL job is like a monthly billing statement. It's complete, auditable, and relatively easy to rerun, but it won't help a system react during the day.
Micro-batch processing handles smaller windows on a recurring schedule. It's closer to checking a bank app every few minutes. The data isn't continuously available, but the delay may be short enough for operational decisions, while the implementation remains easier to inspect and recover.
True streaming processes events as they arrive, like live transaction alerts. It can support immediate decisions, but the pipeline must maintain state continuously and handle events that arrive late, out of order, duplicated, or not at all.
Choose the least complicated model that works
Use the following as a starting point, not a procurement rule:
| Processing model | Freshness profile | Operational character | Good fit |
|---|---|---|---|
| Batch | Hours or longer | Reproducible and simple to rerun | Historical reporting and periodic planning |
| Micro-batch | Minutes or short intervals | Easier recovery with bounded processing windows | Operational dashboards and many product metrics |
| True streaming | Seconds, sub-seconds, or event-level | Continuous state, replay, and late-event management | Fraud controls, automated decisions, and live personalization |
The important distinction isn't only processing speed. It's also data latency versus query latency. Data latency measures the time from event creation until the event becomes visible to a query. Query latency measures how long the query takes to return. A fast database can still fail a real-time SLA if ingestion, processing, indexing, or materialization is slow. Benchmarking guidance from HPI recommends measuring both paths, with data becoming visible within a few seconds or even sub-seconds for real-time workloads. (HPI benchmark discussion)
Micro-batch is often the right compromise because it bounds the amount of state and makes failures easier to isolate. True streaming earns its complexity when the event loses value during the processing window, not merely because stakeholders like live-looking charts.
For event-heavy systems, such as on-chain transaction monitoring, a protocol-specific resource like this Solana trade WebSocket guide can clarify how events are captured before you design the analytical layer. For broader platform decisions, compare ingestion, transformation, storage, and serving as one system rather than choosing a broker in isolation. The data pipeline tools overview provides useful context for that wider toolchain.
Core Architecture Components and Latency SLAs
A real-time pipeline is a chain of latency budgets. The system doesn't become real time because one component is fast. Ingestion, processing, storage, and serving must all keep pace, and the slowest path determines the user experience.
Four components, four failure modes
Ingestion captures events through systems such as Kafka, Amazon Kinesis, or Google Pub/Sub. Partitioning affects parallelism and hotspots, while serialization and schema validation affect both throughput and failure behavior.
Processing applies transformations, joins, filters, and windows through engines such as Flink, Spark Streaming, or ksqlDB. Stateful operations need durable state and a policy for late arrivals. Complex joins can create more pressure than simple aggregations because the engine must retain and match information across streams.
Storage makes fresh data queryable. Systems such as ClickHouse, Druid, and Pinot are designed for analytical reads and high-frequency writes, but indexing and materialization choices create a direct trade-off between write cost, freshness, and query speed.
Serving exposes results through caches, materialized views, APIs, or dashboards. A low-latency query is useful only if the serving layer can handle concurrent demand and return a consistent view.
The HPI discussion makes the operational point clearly: teams must measure ingest-to-query visibility separately from query response time. Track p50, p95, and p99 query latency, then monitor freshness at the same percentiles. A p50 result can look healthy while the tail violates the SLA that users feel.
A planning table without invented precision
The following allocation is a design exercise, not a benchmark claim. Replace each budget with measurements from your workload.
| Component | Technology examples | Latency budget | Throughput capacity | Key trade-offs |
|---|---|---|---|---|
| Ingestion | Kafka, Kinesis, Pub/Sub | Allocate a small, explicit share of the end-to-end budget | Size for normal flow plus bursts | More partitions improve parallelism but increase coordination and management |
| Processing | Flink, Spark Streaming, ksqlDB | Reserve the largest share for joins and stateful logic | Match event volume and state growth | Rich transformations improve usefulness but increase state and tail latency |
| Storage | ClickHouse, Druid, Pinot | Measure visibility after indexing or materialization | Balance write rate with read concurrency | Aggressive indexing improves reads while adding write and maintenance work |
| Serving | APIs, caches, materialized views | Keep response time separate from freshness | Size for concurrent users and applications | Caching lowers response time but can serve stale results |
A useful architecture review asks what happens when the stream falls behind. Can consumers read the last known valid view? Can the team replay events without double-counting? Which fields can change after publication? Those questions are more valuable than a vendor's isolated benchmark.
Exactly-once delivery deserves similar care. A distributed stream-processing paper reported enforcement overhead below 10 milliseconds, while other Kafka and Flink benchmarking has found that exactly-once can still increase end-to-end latency when implementations rely on heavy coordination. (Distributed stream-processing research) Use idempotent sinks where possible, and reserve the strictest guarantees for workflows that require them. A real-time analytics platform architecture guide can help teams map these layers before committing to a stack.
Use Cases That Justify Real-Time Investment
The strongest real-time use cases share one trait: latency changes the action. If the system can intervene, personalize, route, price, or block something before the next event, freshness may create direct value. If a person only reviews the result later, micro-batch often deserves the first experiment.
Streaming-data adoption reflects that practical demand. In a 2023 survey of streaming-data users, 71% identified real-time analytics as the leading current use case, and nearly three in four respondents said AI and machine learning development would be the biggest adoption driver over the next 12 to 24 months. The same survey found 71% expected more streaming for analytical workloads and 81% expected more for transactional workloads. (Redpanda streaming data report)
Compare the decision, not the dashboard
| Use case | Revenue impact | Latency sensitivity | Infrastructure complexity | Verdict |
|---|---|---|---|---|
| Fraud detection | Direct loss prevention | High | High | Strong streaming candidate |
| Dynamic personalization | Can affect an active customer interaction | High to medium | High | Justify selectively, with measured decision impact |
| Product analytics | Usually informs product decisions rather than immediate automation | Medium to low | Medium | Start with micro-batch |
| Operational monitoring | Can reduce time to detect and respond to incidents | Medium to high | Medium to high | Stream critical signals, batch historical views |
Fraud detection is a clear candidate when a transaction must be evaluated before approval. Dynamic pricing and personalization can also qualify, but only when the offer or price can change during the customer's active journey. A continuously updated feed that nobody consumes in time is not a high-value stream.
Product analytics often gets overpromoted. Teams may ask for every click to appear instantly, then use the dashboard during a planning meeting. A micro-batch pipeline can provide the same decision quality with simpler backfills and fewer consistency problems.
Operational monitoring needs segmentation. Stream alerts for signals that require immediate intervention, such as service health or security events, while keeping slower trend analysis in the warehouse. For teams building a broader analytical practice, this practical SMB big data analysis guide is a useful reminder to connect infrastructure choices to business questions instead of starting with volume or tooling.
The anti-patterns are predictable: streaming pipelines for weekly executive reports, real-time feature infrastructure feeding models that refresh hourly, and live dashboards whose users still make decisions on a daily cadence. Score every proposed use case by the value of earlier action, the cost of stale data, and the operational burden of keeping the path healthy.
Migrating From Batch Systems and Evaluating Platforms
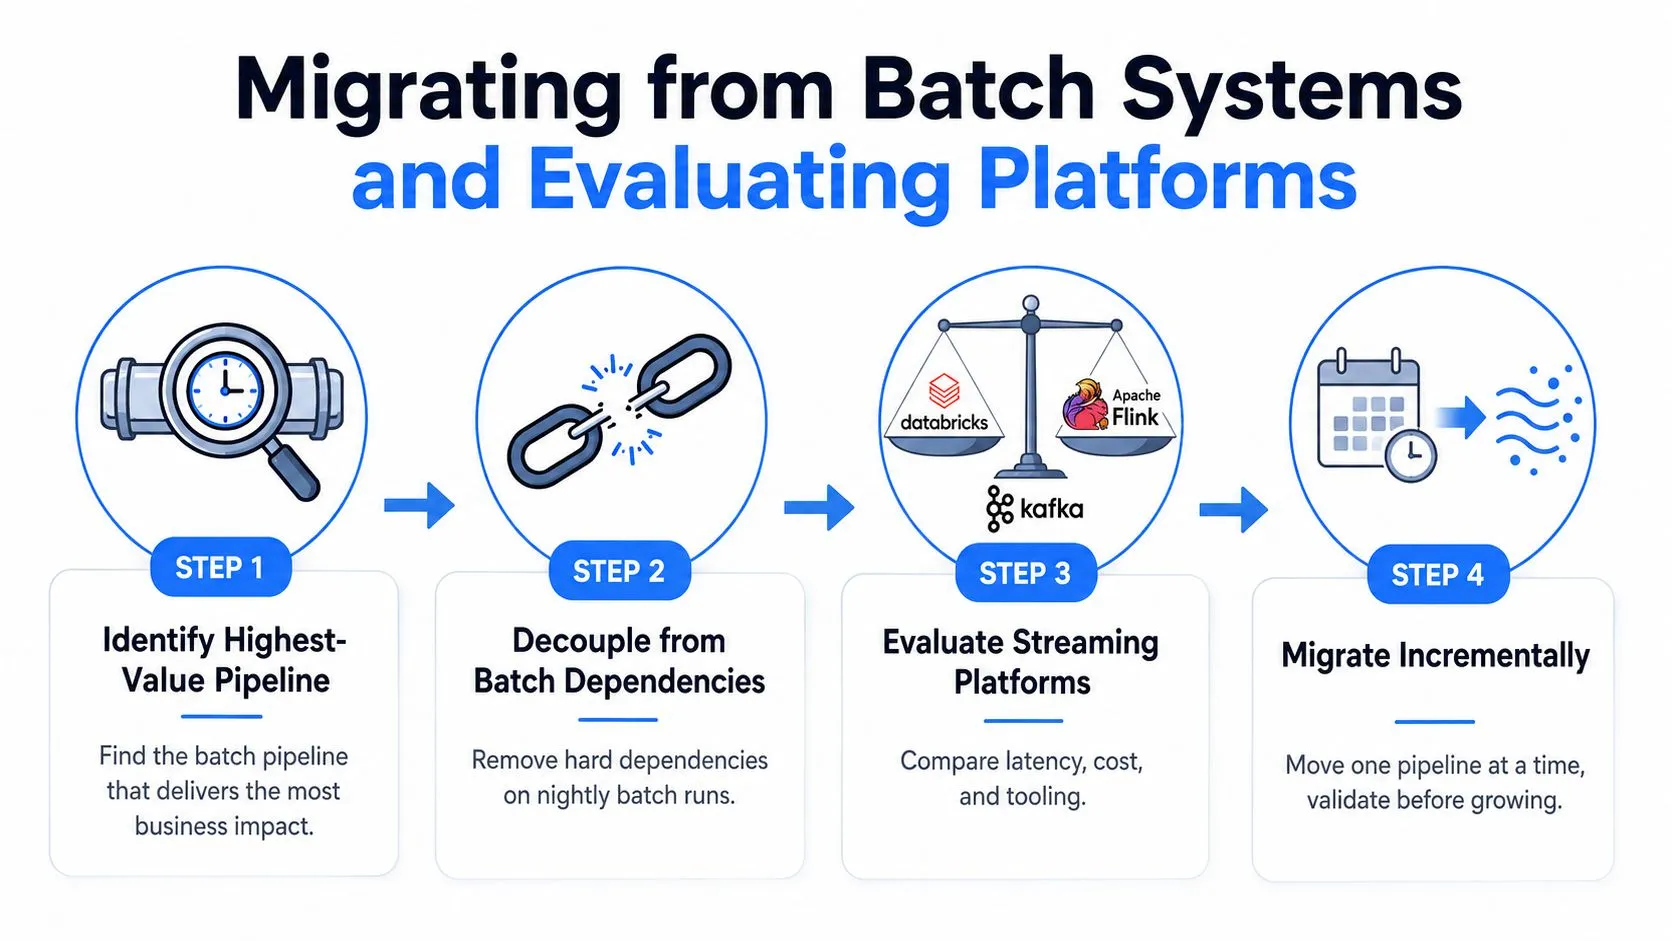
Most migrations begin with a familiar request: “The nightly job is too slow. Can we make it real time?” Don't translate that request directly into Kafka and Flink. First identify which output has the highest business value, then determine whether the bottleneck is ingestion, transformation, warehouse scheduling, query design, or an unreasonable reporting process.
Start by separating event capture from downstream transformation. Keep the existing batch path as a correctness reference, introduce a streaming or micro-batch path beside it, and compare outputs before moving consumers. That parallel period exposes missing events, duplicate handling problems, timestamp assumptions, and differences between provisional and final metrics.
Evaluate platforms against future pressure
Vendor demos tend to emphasize connectors and dashboards. I'd score platforms against the operational questions that become expensive after launch:
- Total cost under growth: Model infrastructure, storage, refresh, observability, support, and on-call work at substantially higher throughput than today. Managed services reduce platform maintenance, but pricing can become difficult to predict as event volume, retention, and query demand grow.
- Schema evolution: Test additive changes, incompatible changes, malformed events, and rollback. A registry is useful only when producers and consumers enforce contracts.
- Delivery guarantees: Verify how exactly-once is implemented, where idempotency belongs, and what happens during retries or replays. The strictest guarantee may not belong on every analytical path.
- Governance integration: Check catalog, lineage, access control, audit, and retention support. Streaming data still needs ownership and policy.
- Production readiness: Measure how quickly a team can build, test, observe, replay, and operate one pipeline. A feature-rich platform that only specialists can debug creates a different kind of bottleneck.
Open-source Kafka plus Flink can provide control and flexibility, but the team owns upgrades, capacity planning, failure recovery, and operational expertise. Managed options such as Confluent or Upsolver can reduce that burden, while introducing provider dependency and a pricing model that must be tested against realistic workloads.
Don't migrate every consumer at once. Move one high-value output, validate it against batch history, publish clear freshness semantics, and only then expand. A short architecture video can help align product and engineering stakeholders before implementation:
The platform should make the correct path easy, but no platform removes the need for ownership, testing, and cost controls.
Building a Self-Serve Operational Model
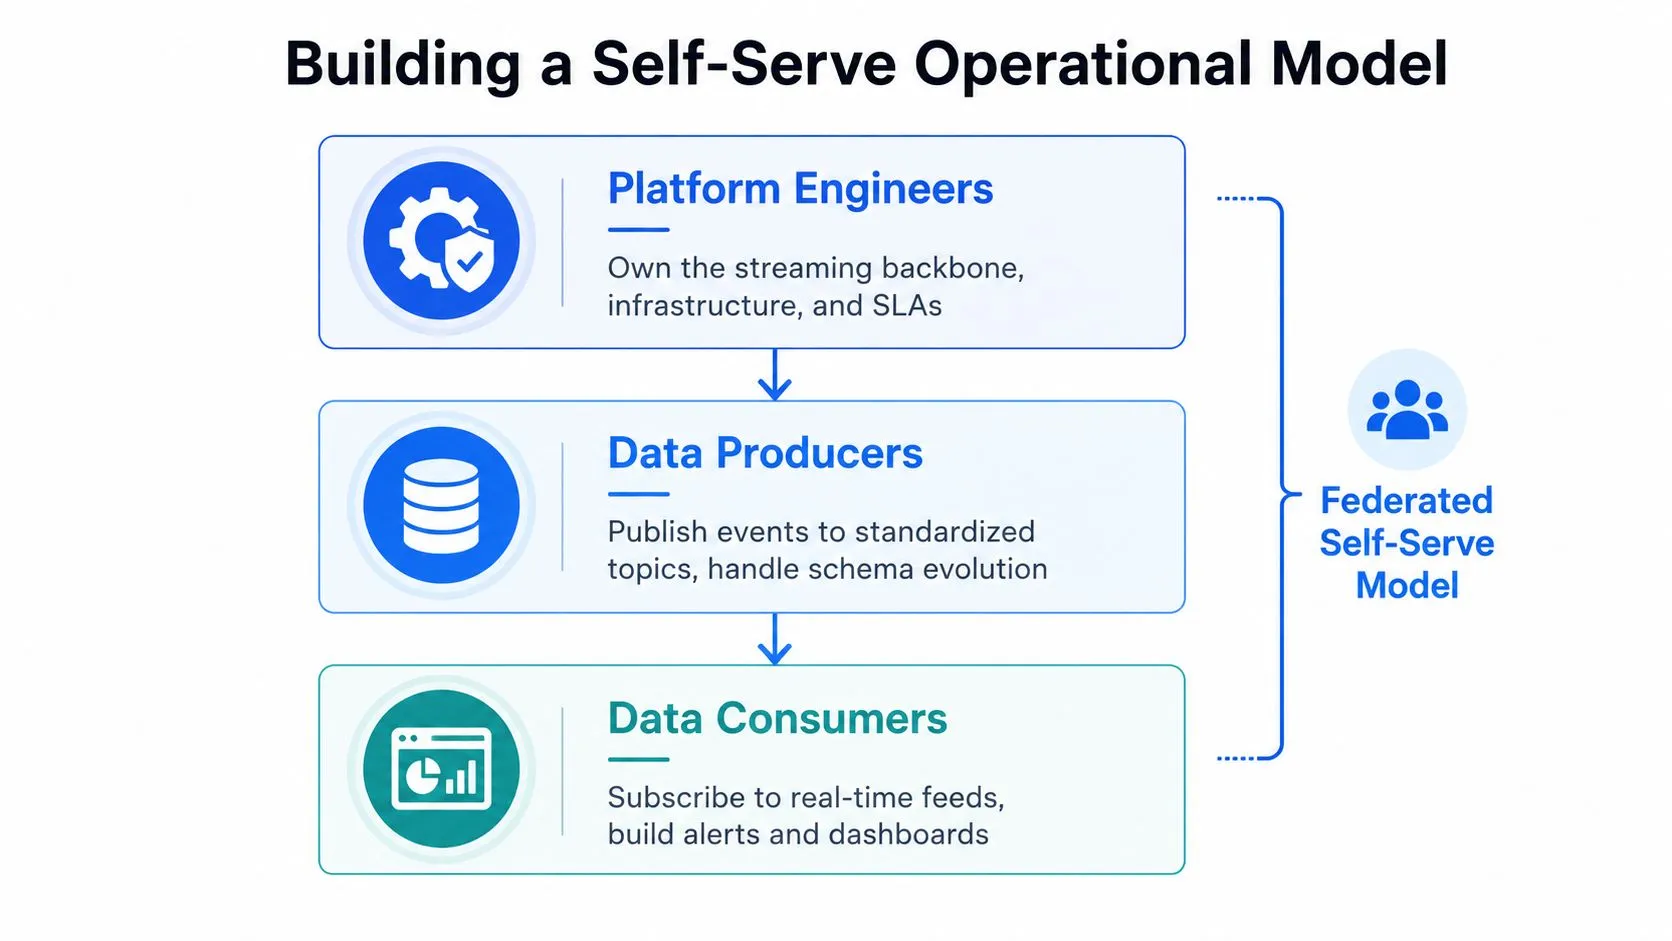
Real-time analytics fails when every pipeline requires a platform engineer. A five-person data team can't become a permanent query service for product managers, founders, and support operators while also maintaining brokers, connectors, schemas, and incident response.
A federated model works better. Platform engineers own the streaming backbone, security, observability, schema registry, and shared service levels. Data producers publish documented events and manage domain transformations. Data consumers use approved views, alerts, and APIs without changing the underlying delivery system.
Put guardrails where errors enter
Schema contracts belong at ingestion. Reject or quarantine incompatible events before they contaminate downstream metrics. Producers need versioning rules, ownership metadata, and a clear escalation path when a field changes.
Costs need attribution. Track spend by pipeline, domain, or product surface. Without attribution, teams can request broader retention, more frequent materialization, and additional consumers without seeing the infrastructure consequences.
Freshness alerts should measure usefulness. Uptime alone doesn't tell an analyst whether a dashboard reflects current events. Alert on ingest-to-query visibility, processing lag, failed materializations, and query tail latency. The user cares that the answer is current and available, not merely that a broker process is running.
For mid-market teams, “streaming-lite” is often the practical operating model. Use managed infrastructure for the parts that demand specialized operations, while keeping transformations in SQL or another language that domain analysts can inspect and test. Analysts should query governed materialized views rather than raw event topics, and engineers should own the path that creates those views.
Self-serve doesn't mean unrestricted access. It means users can answer approved classes of questions without opening a ticket for every filter or time range. Permissioned views, freshness labels, quality checks, and documented metric definitions prevent speed from becoming confusion. Guidance on enabling self-service analytics is relevant here because the interface and workflow matter as much as the underlying stream.
The operating model should also define who handles replays, who approves schema changes, who owns a broken SLA, and which consumers can fall back to the last known valid result. Those decisions should exist before the first production incident.
Next Steps for Startup and Mid-Market Data Teams
Start with an audit, not a new platform. List the batch pipelines that matter, the decisions they support, and the latest point at which fresh data changes the outcome. Remove vanity metrics from the candidate list. A live chart that doesn't influence action is a cost center with attractive visuals.
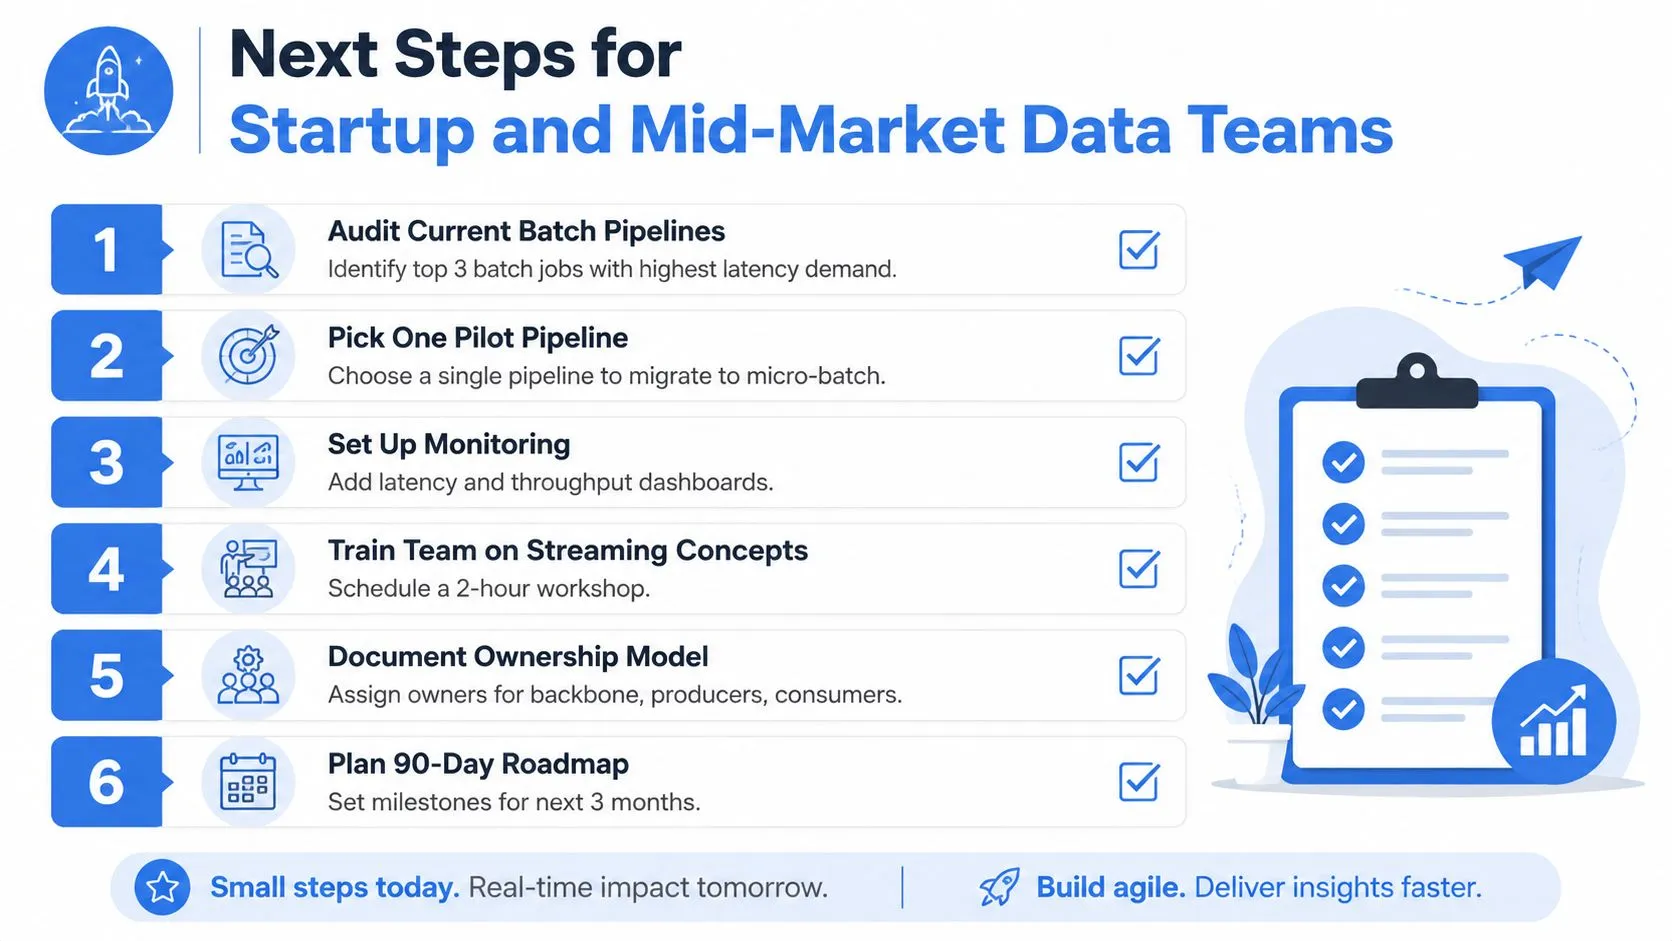
A practical rollout sequence
- Audit current pipelines: Identify the jobs with the strongest latency demand and document their consumers, dependencies, and failure impact.
- Choose one pilot: Start with micro-batch unless the decision deadline clearly requires event-level processing.
- Instrument the path: Measure freshness, query latency, processing lag, throughput, retries, and the age of the last valid result.
- Train the team: Teach event time, processing time, watermarks, replay, idempotency, schema evolution, and state management.
- Document ownership: Assign responsibility for the backbone, event producers, transformations, views, dashboards, and incident response.
- Set a migration horizon: Define milestones for the next phase, including a cost review and a decision on whether to expand streaming.
The hidden budget is operational. Real-time SLAs require monitoring, incident response, replay procedures, schema review, and people who can troubleshoot a pipeline while downstream users are waiting. If nobody is scheduled to own those responsibilities, the organization hasn't bought real-time analytics. It's bought an unresolved production risk.
Build, buy, or combine
| Team situation | Sensible approach |
|---|---|
| Small team with limited streaming expertise | Buy managed infrastructure and keep the analytical layer simple |
| Strong platform team with unusual requirements | Build selected components, with explicit ownership and support coverage |
| Existing warehouse and moderate freshness needs | Use micro-batch or a hybrid path before introducing full streaming |
| Mixed technical and non-technical users | Provide governed materialized views and self-serve interfaces while engineers own the stream |
The right design may be hybrid. Keep complete historical truth in the batch or warehouse layer, stream only decisions that need immediate action, and expose stable views to non-specialists. That approach avoids forcing every consumer onto the most expensive freshness tier.
Querio offers live connections to warehouses and databases, including Snowflake, BigQuery, Amazon Redshift, ClickHouse, and PostgreSQL, along with dashboards and analysis over current warehouse data. If your team needs self-serve exploration without turning data engineers into a manual query service, visit Querio and evaluate whether its workflow fits alongside the real-time layer you need.