Guide
Real Time Analytics Platform: A Practical Buyer's Guide
Find the right real time analytics platform for your startup. Compare architecture, features, and rollout strategies to scale data without bottlenecks.
At 11:07 p.m., the founder posts the same message every data lead has seen. The dashboard is stale, the number in Slack doesn't match the board deck, and somebody wants the “live” figure now. An analyst reruns a job against yesterday's snapshot, drops a screenshot into the thread, and everyone pretends that's close enough.
That's why teams start shopping for a real time analytics platform. Not because they want a shiny new stack. Because batch pipelines keep turning urgent questions into follow-up work, and follow-up work is where trust in data goes to die.
This guide is for heads of data, product leaders, and founders at mid-market startups who need a practical decision framework, not a vendor slideshow. You'll get the architecture, the feature checklist, the trade-offs vendors skip, and a rollout plan that doesn't assume a 20-person platform team. The core argument is simple. Real time is not just a latency dial, it's a four-bottleneck problem, ingest, query, freshness, and concurrency, and in 2026 the buying decision is increasingly shaped by governance and self-serve workflows, not just dashboard speed.
Table of Contents
- The 11pm Slack Ping That Started the Search
- What a Real Time Analytics Platform Does
- Architecture and Data Flow Inside the Stack
- Real Time vs Batch Analytics and When Each Wins
- Features That Separate Marketing From Engineering
- The Hidden Trade Offs Nobody Puts on the Slide
- A Phased Rollout Plan for Mid Market Startups
- Evaluation Checklist and Common Buyer Questions
The 11pm Slack Ping That Started the Search
The pattern is always the same. A founder notices a number that should've updated already. An ops lead opens the dashboard and sees a stale snapshot. The analyst in the hot seat knows the answer exists somewhere, but it lives behind a scheduled job, a warehouse refresh, or a notebook nobody wants to touch after hours.
That's when teams discover that “live” and real time aren't the same thing. The gap isn't just technical, it's organizational. Leadership wants to act now, while the stack is still optimized for a world where everybody was fine waiting until tomorrow morning.
Practical rule: if the number only matters after a human has already moved on, you probably don't need real-time processing.
The market is expanding quickly from a relatively small base, with the global real-time analytics market valued at USD 1,098.7 million in 2025 and projected to reach USD 7,544.50 million by 2034, a 25.1% CAGR over the forecast period, according to Fortune Business Insights. That growth explains the buzz. It doesn't excuse sloppy buying.
This article is deliberately opinionated. It won't pretend every dashboard needs sub-second pipelines, and it won't dress up vendor architecture diagrams as strategy. The point is to help you decide where real-time analytics is worth the complexity, where batch is still the better choice, and where governance and self-serve access matter more than another faster chart.
What a Real Time Analytics Platform Does
A real time analytics platform takes in events as they happen, transforms them on the fly, and makes the results available fast enough for people or systems to act. Vendors love to compress that into one glossy promise about “instant insights.” Ignore the pitch and judge the platform by the work it has to do.
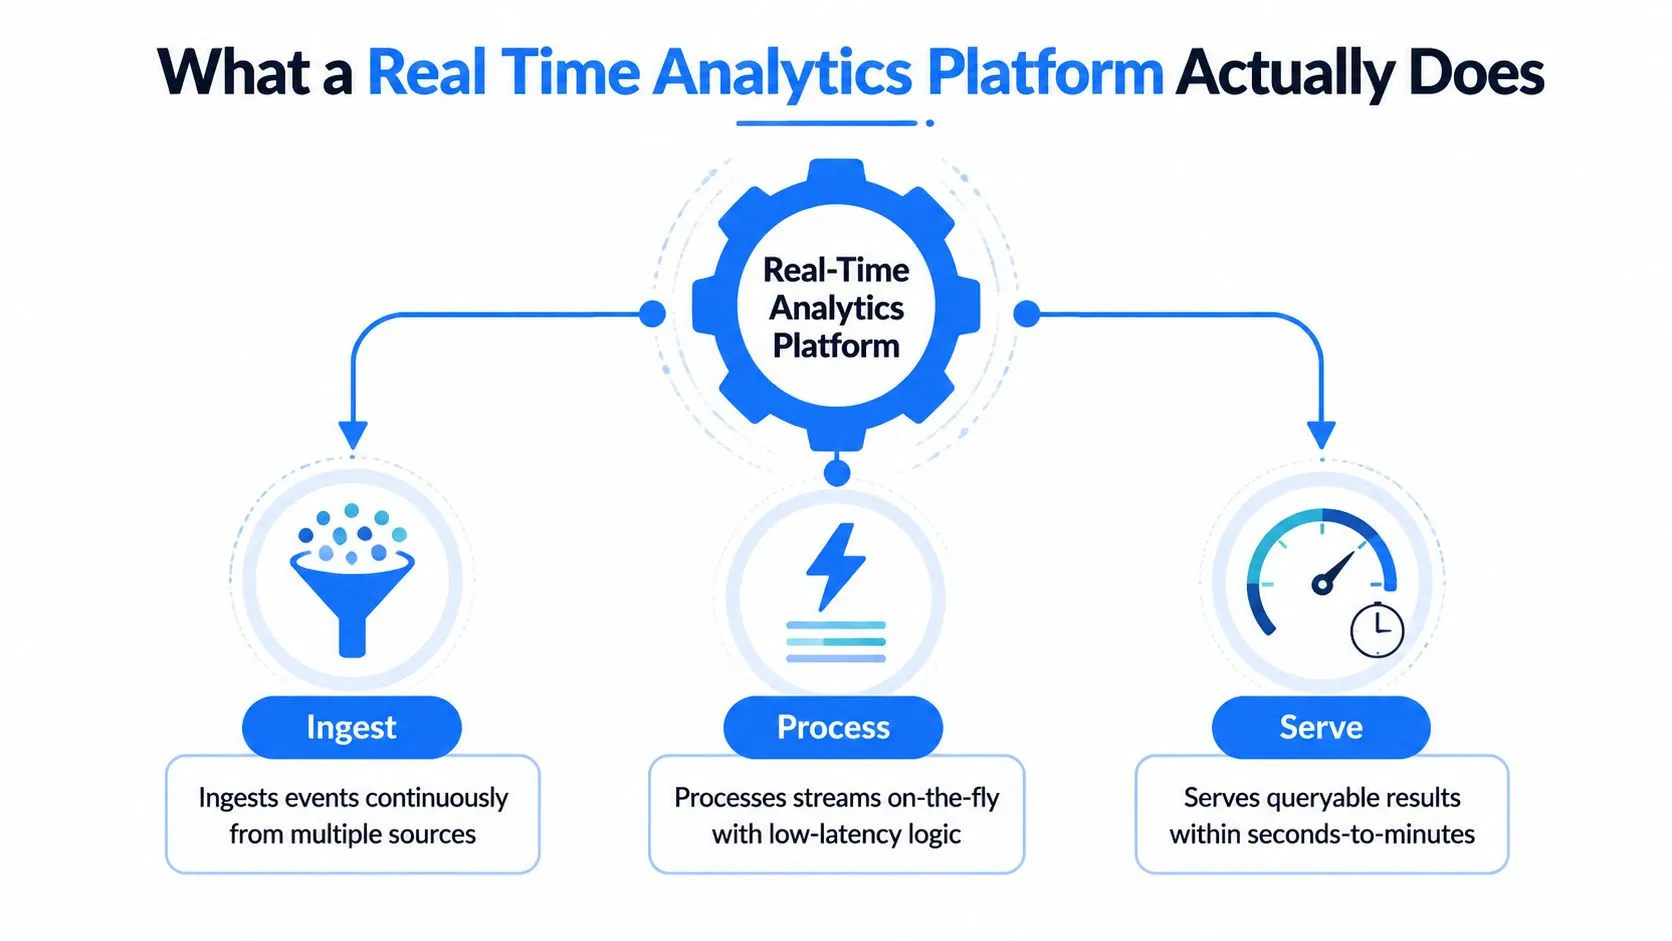
The useful way to sort the category is by latency tier. Skopx's platform guidance breaks it into true real-time (<1 second), near real-time (1–30 seconds), micro-batch (30 seconds to 5 minutes), and batch (minutes to hours). That matters because most operational use cases sit in the seconds-to-minutes range, not the sub-second brag zone. If nobody will act on the data within 5 minutes of arrival, the use case does not need real-time processing.
The four bottlenecks you should care about
The right evaluation lens is ingestion latency, query latency, data freshness, and concurrency. A platform can accept events quickly and still fall apart when 40 people open the same dashboard. It can answer queries fast and still miss the point if the data is stale by the time users see it.
That is part vendor decks skip. They show a clean demo against a tidy dataset, then skip reality of continuous event arrival, ongoing transformations, and multiple teams hitting serving layer at once. Once those three pressures line up, weak systems expose themselves fast.
Use this test: ask whether the platform stays useful when ingestion, transformation, and dashboard traffic all happen at the same time. If the answer depends on ideal conditions, the product is not ready for production in your use case.
For teams that start from reporting and move into live operational analytics, Querio's BI platform overview gives the right baseline. The shift is not about prettier charts. It is about moving from scheduled reporting to a system that keeps pace with the work.
A second pressure point sits outside the marketing slide: observability. If you cannot see where events stall, where freshness slips, or where query queues build up, you are guessing. The RapidNative guide on app observability is useful here because the same monitoring discipline that catches app failures also exposes analytics pipeline drift before users do.
In practice, the mid-market migration check starts. File-system notebook workflows like Querio can help teams bridge the gap between ad hoc analysis and governed BI, but only if the platform can keep those notebooks tied to fresh data and shared definitions. That is a trade-off worth making clear before anyone buys a vendor story about “real-time” without asking who owns freshness, access, and concurrency once the pilot ends.
Architecture and Data Flow Inside the Stack
A production real time analytics platform rarely comes from one magic engine, no matter what the vendor slide suggests. It is a four-part stack, data sources, streaming ingestion, stream processing, and an OLAP or analytics serving store. The names change, the failure points do not.
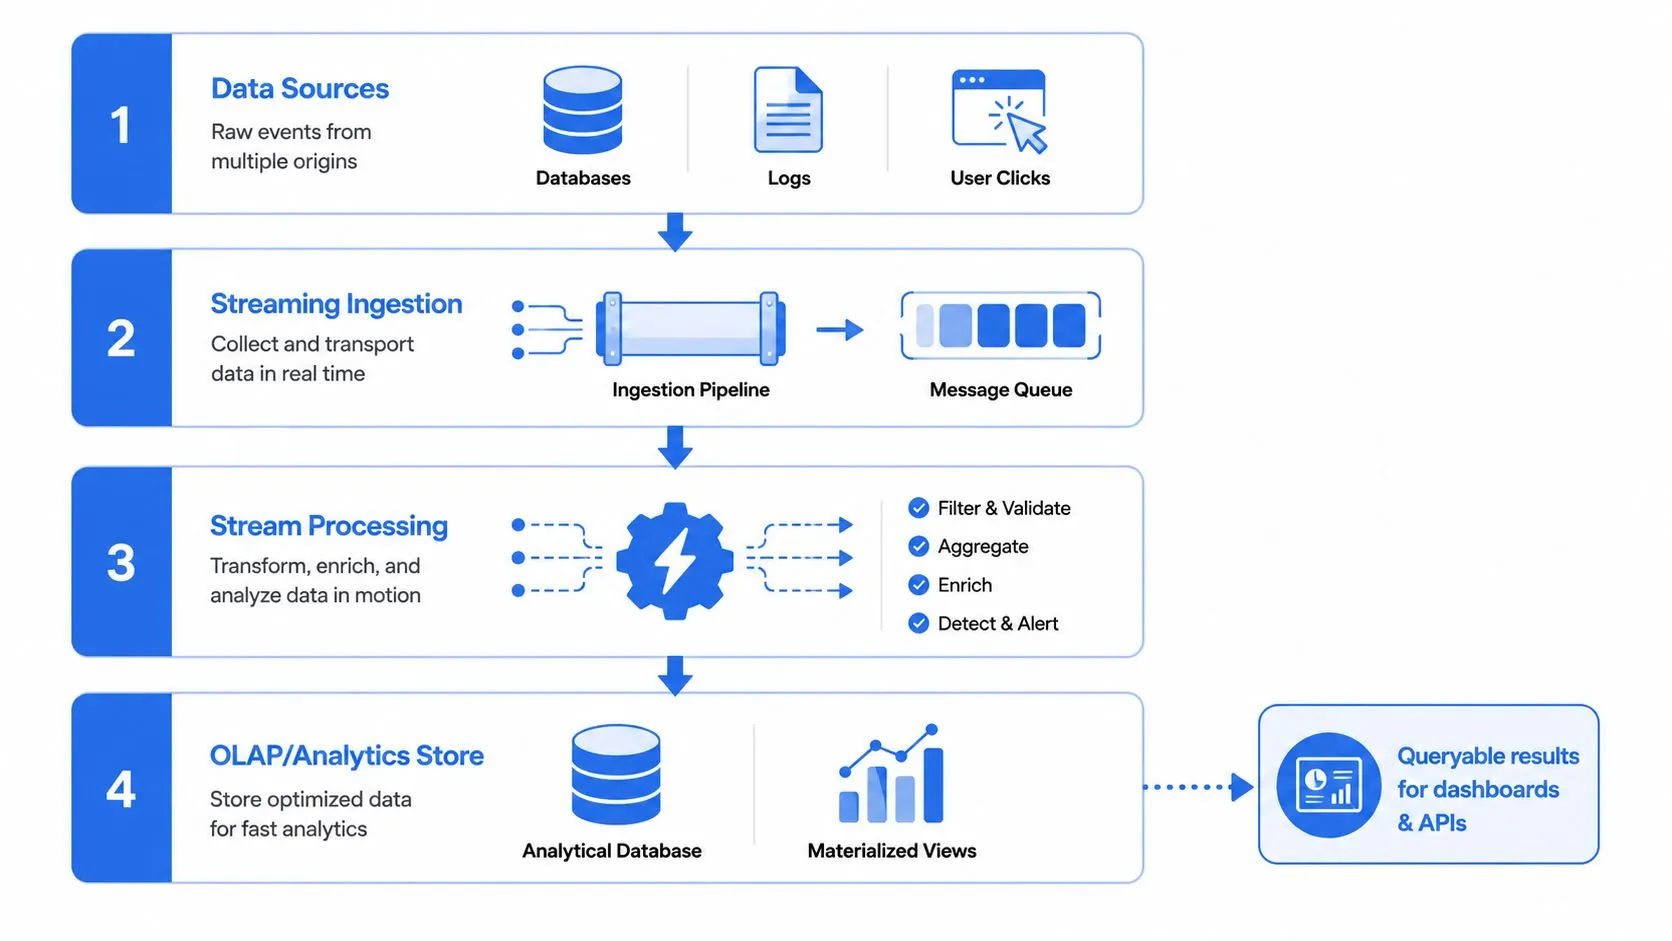
At the top, the inputs are application events, logs, transactions, and clicks. Ingestion usually runs through systems like Kafka, Kinesis, or Pulsar. Processing often happens in Flink or a similar stream engine. Serving typically lands in ClickHouse, Druid, or Pinot, where dashboards and APIs can read low-latency aggregates without fighting upstream traffic, as described in Codelit's architecture breakdown.
Why decoupling matters
Decoupling ingestion from serving is not an architecture fashion statement. It keeps bursty event traffic from choking the query layer. If dashboards share fate with the write path, every spike becomes a user-facing outage.
AWS documents a production pattern where Kinesis Data Streams captures streaming data from many sources, Apache Flink cleans and enriches records, and the output is written to destinations such as Amazon Timestream, DynamoDB, or S3 depending on the access pattern AWS real-time analytics pattern. That split is the right mental model. Keep raw events cheap to retain, and keep the serving store tuned for second-level dashboard reads and alerting.
The engineering takeaway is blunt. Latency-sensitive dashboarding should not depend on archival storage, and archival storage should not be forced to act like a serving engine.
For a warehouse-centric view of those boundaries, Querio's warehouse architecture guide is a useful companion read.
For teams debugging live pipelines, the RapidNative guide on app observability is also worth using, because streaming systems fail in the seams, not in the happy-path demo.
A mature platform is usually a portfolio of tools, not a single product. The buying question is whether your team can operate that stack without building a pile of brittle glue code.
Here's a concrete visual reference if you want to see the flow in motion.
Real Time vs Batch Analytics and When Each Wins
Batch is still the right answer for a lot of work. Overnight reconciliation, monthly close, ML training datasets, and any workflow where correctness matters more than immediacy should stay batch-first. The mistake is not using batch, the mistake is forcing real-time complexity onto a problem that doesn't benefit from it.
| Dimension | Batch Analytics | Real Time Analytics |
|---|---|---|
| Latency | Hours or scheduled intervals | Seconds to minutes, sometimes under a second |
| Cost | Usually lower and easier to predict | Higher because the system stays hot |
| Operational complexity | Simpler pipelines, fewer moving parts | More seams, more monitoring, more failure modes |
| Use-case fit | Reconciliation, finance close, training data | Fraud, alerting, embedded analytics, live dashboards |
The middle ground is micro-batch, and that's where teams land in practice. It's often the responsible choice when the business wants fresher data but doesn't need every event to be queryable instantly. The cost curve gets ugly fast if you try to force sub-second behavior on workloads that are happy with a short delay.
Where batch still wins
Batch wins when the business can tolerate delay and wants simpler operations. A finance team doesn't need a stream processor to reconcile yesterday's books. A machine learning pipeline doesn't need live freshness if the training set is meant to be stable and reproducible.
Where real-time earns its keep
Real-time earns its complexity in fraud detection, operational alerting, in-product analytics, and customer-facing embedded metrics. Those are the places where a stale number creates a bad decision or a bad user experience. In those cases, the cost of delay is higher than the cost of keeping the system live.
If you're building dashboards for internal reporting, start by asking whether a scheduled refresh is enough. If you're exposing metrics to customers or driving automated decisions, the standard gets stricter fast. The moment a user expects the screen to reflect what just happened, batch stops being a neutral default.
For dashboard design patterns that pair well with either model, Querio's dashboard guide is a practical reference point.
Features That Separate Marketing From Engineering
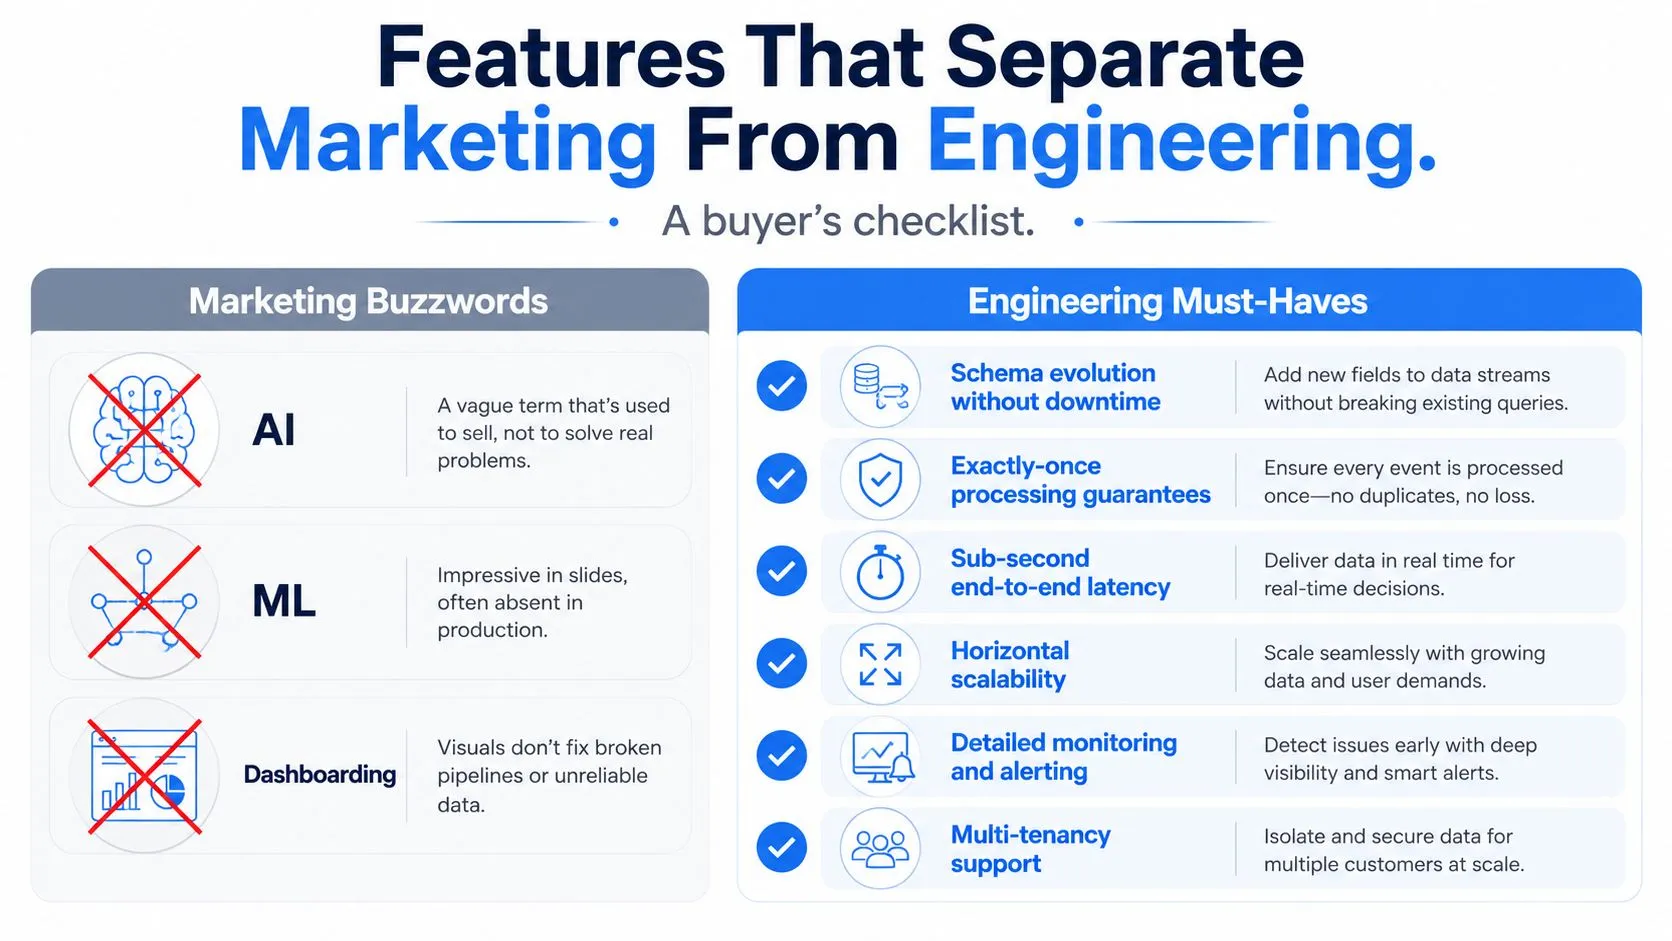
The best buying checklist is boring. That's a compliment. The features that matter most are the ones that keep a platform usable after the demo ends and the first schema change hits production.
Must-haves that actually hold up
Schema evolution without downtime matters because event payloads change. If adding a field breaks old queries, your platform isn't flexible, it's fragile.
Exactly-once or at-least-once semantics matter because you need to know how duplicates and retries behave. Teams can reason about either model, but they can't reason about hand-wavy reliability claims.
Replay and backfill are essential. If you can't reprocess history after a bug or a late-arriving source fix, every incident turns into a permanent data gap.
Time-travel queries help teams debug what the system knew at a given point in time. That's especially useful when product, support, and engineering are looking at the same metric and arguing about whether it changed or the definition changed.
Features that are worth real money
Row-level security and embedded query APIs matter once analytics leaves the internal team. If the product has customer-facing analytics, you need governed access that doesn't require a bespoke code path for every customer segment.
Materialized views and observability hooks are the unglamorous winners. They keep freshness visible and keep query performance from drifting. If freshness slips and nobody notices until a customer complains, the platform isn't really operating in real time.
Nice-to-have features that get over-sold
Drag-and-drop ML, custom AI pipelines, and flashy no-code modeling are easy to demo and hard to operationalize. Many teams don't need them early. What pays for itself in week two is stuff like column-level lineage, query cost attribution, and scheduled exports.
Vendor call test: if the demo spends more time on dashboards than on backfill, failure recovery, and access control, you're watching marketing, not engineering.
A real real time analytics platform should feel boring in production. If it only looks impressive in a sandbox, it's not ready for your workload.
The Hidden Trade Offs Nobody Puts on the Slide
Every platform choice comes with a bill, and vendors tend to hide the line items that matter most. The obvious one is latency vs cost. Sub-second behavior is often 3 to 10 times more expensive per event, which is why teams should only pay that price when the use case depends on it. That number appears in the infographic for a reason, because a lot of buying mistakes start with the fantasy that faster is always worth it.
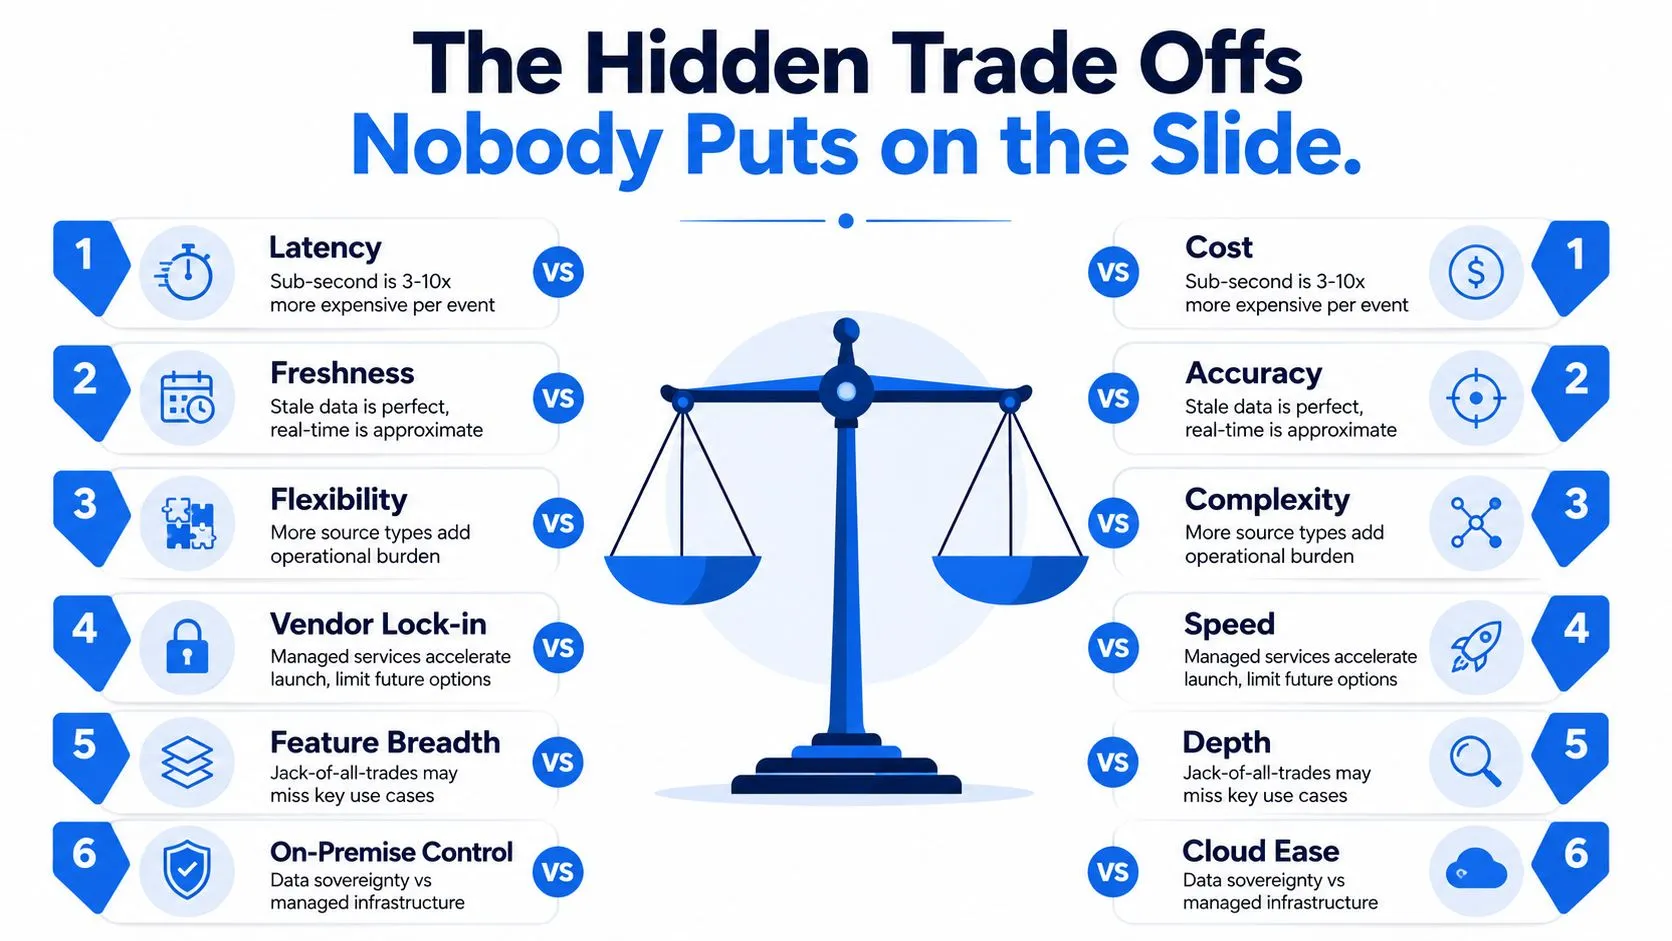
The trade-offs that matter in production
Freshness vs accuracy shows up when teams want the newest event immediately, even if the pipeline hasn't fully settled. Stale data is perfect. Real-time data is usually approximate for a short window, and that's fine if the business understands the trade.
Scalability vs simplicity is why managed services win early and frustrate teams later. They cut operational work, but they can also lock you into a narrow pattern that doesn't fit the next use case.
Observability vs privacy is a real tension, not a slogan. You need deep telemetry to know when freshness slips or when a stream backs up. But every extra log line can widen the leak surface.
Security and compliance are becoming more important as AI-heavy enterprises try to monitor policy violations, data exfiltration, and AI usage in real time. A 2026 review from DataFence calls governance, security, and compliance the fastest-growing and most underserved category, which is exactly the shift older BI-era content misses.
Vendor lock-in vs speed is the tradeoff many organizations underestimate. Managed products accelerate launch, but they can make the exit path painful if the data model, API layer, and serving engine are tightly coupled.
The contrarian move is to stop treating governance as a later-stage add-on. In the current market, it's becoming part of the core buying decision. If a platform can't help you see who touched what data, when, and under which policy, it's only solving the dashboard part of the problem.
A Phased Rollout Plan for Mid Market Startups
Start small and force the platform to prove itself on one stream. Don't buy a sprawling architecture because the demo looked elegant. The teams that succeed usually move through four phases, and each phase needs a hard gate before the next one begins.
Phase 1 instrument one stream
Pick a single high-value event stream, like signups, transactions, or feature usage. Wire it into the platform and prove the latency KPI on one dashboard that somebody cares about. If the first use case doesn't matter to the business, the rollout won't get defended later.
Phase 2 validate cost and reliability
Add a second use case and test whether the cost model still works. Replay, backfill, and schema change handling stop being theoretical. If the platform falls apart when the second stream shows up, you bought a demo, not a system.
Phase 3 give analysts self-serve access
This is the point where many teams outgrow classic BI workflows. If you have roughly 5 to 15 active internal users who want to query, transform, and ship without filing analyst tickets, a file-system Python notebook approach such as Querio can beat a traditional BI stack on flexibility and speed of iteration. That's not a universal answer, but it is a real tipping point for mid-market teams that are tired of bottlenecking every question through one reporting queue.
Phase 4 add governance and customer-facing products
Once the internal loop is stable, layer in lineage, access controls, and the customer-facing data product. That's the stage where the platform stops being a reporting system and starts becoming part of the product surface.
A good rollout plan respects how teams work. One stream first, one metric that matters, one decision gate at a time. Anything broader usually turns into a platform project that never ships.
Evaluation Checklist and Common Buyer Questions
Use one scorecard, not five vendor tabs and a gut feel. A real time analytics platform should be scored on latency tier, bottleneck coverage, decoupling, governance, cost model, self-serve layer, and exit path. If a product only answers one or two of those well, it's not a fit for a serious production rollout.
Procurement checklist
- Latency tier fit: Does the platform match the actual need, whether that's sub-second, near real-time, or micro-batch?
- Bottleneck coverage: Does it handle ingest, query, freshness, and concurrency separately?
- Decoupled architecture: Can ingestion spikes avoid crushing dashboard reads?
- Governance controls: Are access, lineage, and policy monitoring built in?
- Cost model clarity: Can you explain what happens as event volume and user concurrency grow?
- Self-serve access: Can analysts and product teams work without filing tickets for every change?
- Exit path: Can you move data and logic without rebuilding the whole stack?
For a deeper build-versus-buy framing, Querio's buy-versus-build guide is useful because this category punishes teams that underestimate maintenance.
Buyer questions that come up every time
How long does a real-time MVP take? Usually 6 to 10 weeks for a single use case, if the source system is clean and the scope stays narrow.
What does it cost? At mid-market scale, the practical answer is usually low five figures per month, depending on sources, concurrency, and retention.
What kills most rollouts? Not streaming itself. The usual failure is underestimating backfill and replay complexity, then discovering that history repair is harder than the first pipeline.
Buy for the workload you have, not the one in the vendor deck. If the business needs live dashboards, embedded analytics, or real-time governance, the platform has to survive the messy parts, not just the happy path.
If your team is stuck between stale dashboards, brittle pipelines, and too much analyst bottlenecking, Querio gives you a way to move faster without bolting on another layer of manual reporting. It connects to your warehouse, supports file-system Python notebook workflows, and lets teams query and build on company data without turning every question into a ticket. Visit Querio and see how a more self-serve analytics workflow can fit into a real time analytics platform rollout.