Guide
Data Product Development Guide to Build and Scale
Learn data product development from discovery to operation, with lifecycle, metrics, architecture and a roadmap to scale self-serve analytics.
Your team probably says it wants self-serve analytics. But the day still looks the same. A sales lead asks for a pipeline report. Finance wants a different revenue cut. Product wants activation by cohort. An analyst opens a notebook, writes custom SQL, cleans a CSV, posts a screenshot, then gets three follow-up questions.
That's not self-serve. That's a human API.
A lot of teams think this happens because they need a better BI tool, a larger warehouse, or more dashboards. Sometimes they do. More often, they have a different problem. They're shipping outputs, not products. A table exists. A dashboard exists. A pipeline runs. But nobody outside the producing team can safely discover it, trust it, use it, or build on it without asking for help.
That's where data product development changes the conversation. Instead of asking, “How do we move data from system A to system B?” you ask, “What reusable thing are we creating, for whom, under what reliability expectations, and with what interface?” That shift sounds small. It changes ownership, backlog decisions, governance, and how teams measure success.
The timing matters. Data-driven product work has moved into the center of modern operating models. Reporting linked to PwC and cited by industry publications says 41% of companies now use data analytics and AI in product development, with those capabilities associated with 19% higher efficiency and 13% lower production costs. The same reporting says global R&D spending reached $2.87 trillion in 2024, nearly triple its 2000 level, which shows how much investment still flows into product creation and iteration in the referenced survey summary.
Table of Contents
- Introduction Why Data Teams Get Stuck as a Human API
- What Data Product Development Really Means
- The Data Product Lifecycle From Discovery to Operation
- Roles Ownership Models and How Teams Organize
- Success Metrics Governance and Trust Signals That Matter
- Architectures Patterns and the Self Serve Acceleration Path
- Roadmap Pitfalls and Real World Examples to Guide Your Next Steps
Introduction Why Data Teams Get Stuck as a Human API
A common failure pattern looks innocent at first. The data team starts by helping fast-moving stakeholders. One custom dashboard becomes five. Five become a weekly reporting ritual. Soon every important number depends on a person who knows where the logic lives.
The cost isn't just workload. It's that the team never gets leverage.
What the bottleneck actually looks like
When a team acts as a human API, a few things happen at once:
- Requests stay local to people: Users ask analysts instead of using governed interfaces.
- Definitions drift: Sales, finance, and product each end up with their own version of the metric.
- Support replaces product work: The backlog fills with clarifications, fixes, and one-off slices.
- Trust gets socialized: People trust the analyst they know, not the system itself.
Historical product outcomes show why this matters. Product work is hard even in mature markets. Industry summaries report that roughly 30,000 new products launch each year and that as many as 95% fail, while other summaries cite 66% of new products failing within two years and 35% to 49% failure rates across industries. The same benchmark collection notes that best-performing companies derive 64.2% of sales from products launched in the previous five years, which frames product development as continuous renewal rather than a launch event in this product development statistics summary.
Data teams feel this same pressure. If the data work never becomes reusable, every request behaves like a fragile launch.
Practical rule: If a stakeholder must message a specific analyst to know whether a dataset is safe to use, you don't have a data product yet.
Why product thinking changes the incentives
Treating data as a product forces a different standard. The team has to define who the consumer is, what question the product answers, what interface it exposes, and what reliability promise it can keep.
That's why the goal isn't “more dashboards.” It's fewer manual dependencies.
A useful data product lets a consumer answer a question without asking the producing team for context every time. It has documentation, access rules, quality expectations, and enough observability that users can judge whether it fits their use case. Once you adopt that mindset, data product development stops being a side topic for architects. It becomes the way the company scales decisions.
What Data Product Development Really Means
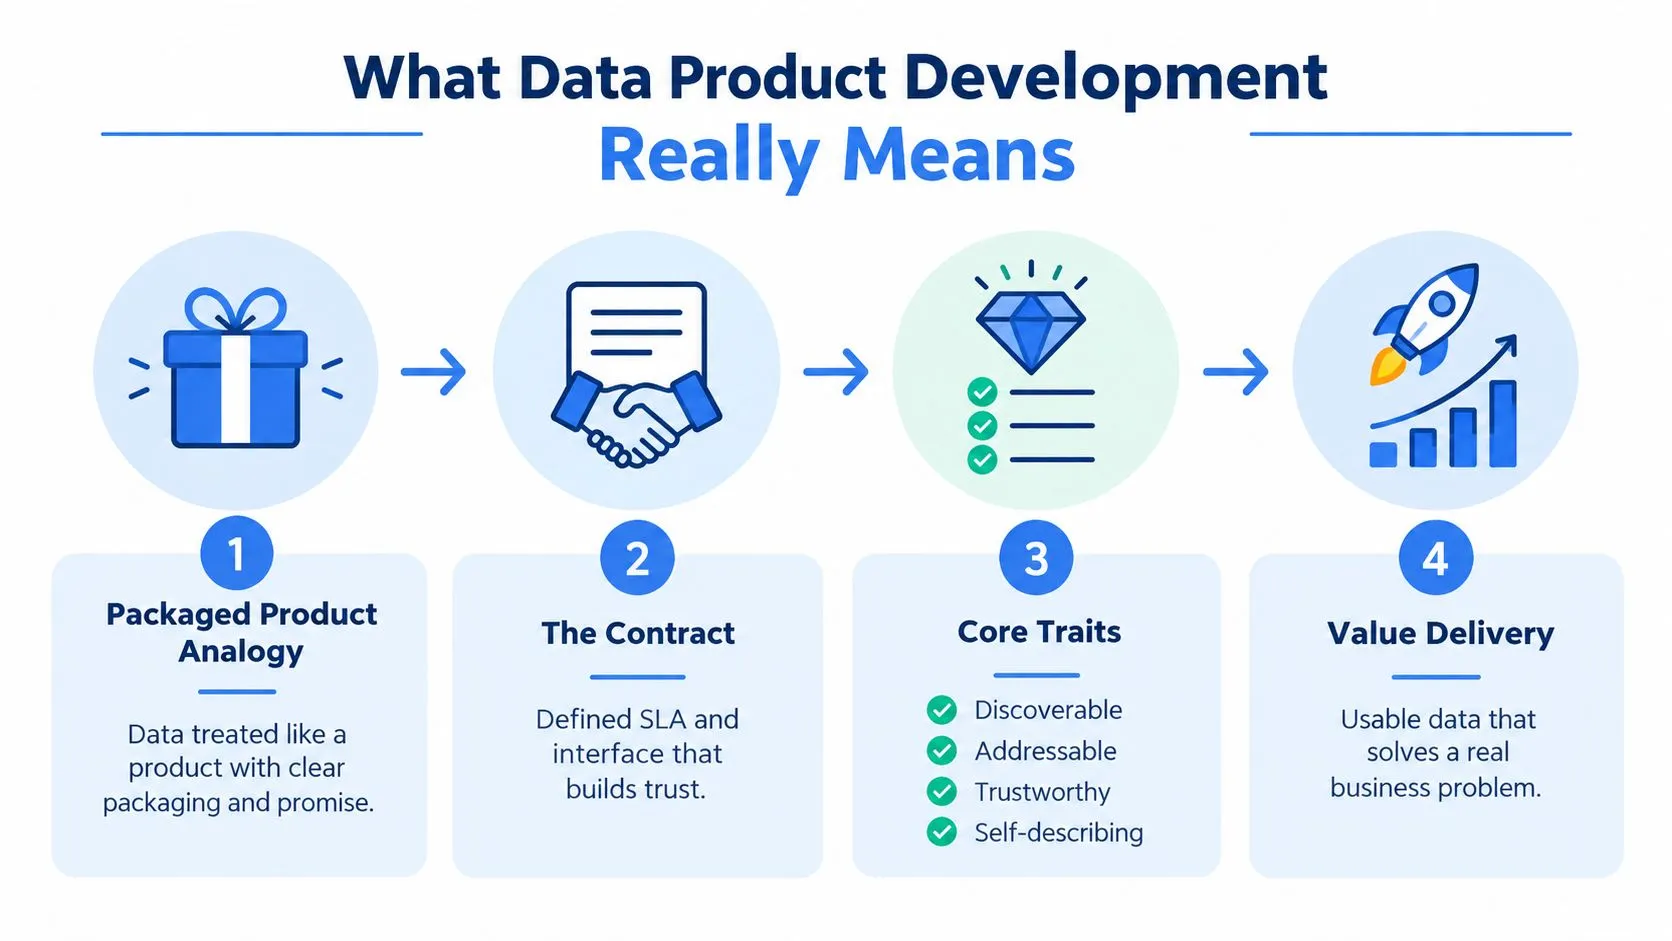
A good starting analogy is packaged food. If you buy a sealed product in a store, you expect a label, ingredients, storage guidance, and an expiration date. You don't call the factory to ask what's inside.
A data product should feel similar. It needs packaging, a promise, and a way to use it safely.
A pipeline is not the product
Teams often confuse three things:
- A pipeline moves or transforms data.
- A dashboard presents an interpretation of data.
- A data product makes data usable and dependable for repeated consumption.
That difference matters because consumers don't buy “movement.” They need a reliable outcome.
If you want a clean baseline definition, this explainer on what a data product is is useful as a companion read. The important operational point is this: a data product is defined by how others can use it without hand-holding.
The contract is the product
In a mesh-style operating model, expert guidance argues that data product development requires more than pipelines. It needs self-serve discovery, observability, and control interfaces so consumers can use the product safely without depending on the producing team for every request. In practice, that means standardized metadata, lineage, access control, and quality checks become part of the product contract. The same guidance also recommends treating data quality as something that should be automatically scored and ideally assessed by an independent unit to reduce conflicts of interest in O'Reilly's discussion of operating data products in data mesh.
That contract usually includes:
- Metadata people can read: Clear business definitions, owners, update patterns, and intended uses.
- Lineage people can inspect: Where the data came from and what transformed it.
- Access control people can trust: Who can see what, under what policy.
- Quality and freshness expectations: The operating promise, not a vague hope.
A table without a contract is inventory. A table with a contract can become a product.
The four traits people usually miss
A workable data product tends to share four traits:
| Trait | What it means in practice |
|---|---|
| Discoverable | A user can find it through a catalog, semantic layer, or shared interface |
| Addressable | It has a stable way to access it, such as SQL, API, notebook path, or governed share |
| Trustworthy | Users can inspect lineage, ownership, quality status, and access policy |
| Self-describing | The product explains itself enough that consumers don't need a meeting first |
The last step is value. A data product is not “data with good documentation.” It has to solve a business problem. That's why strong teams stop asking whether they've shipped a model or dataset and start asking whether someone can act on it repeatedly with confidence.
The Data Product Lifecycle From Discovery to Operation
Many teams still treat delivery like a project. Gather requirements. Build. Launch. Move on. That works for one-off reports. It fails for shared decision infrastructure.
Data product development works better as a loop.
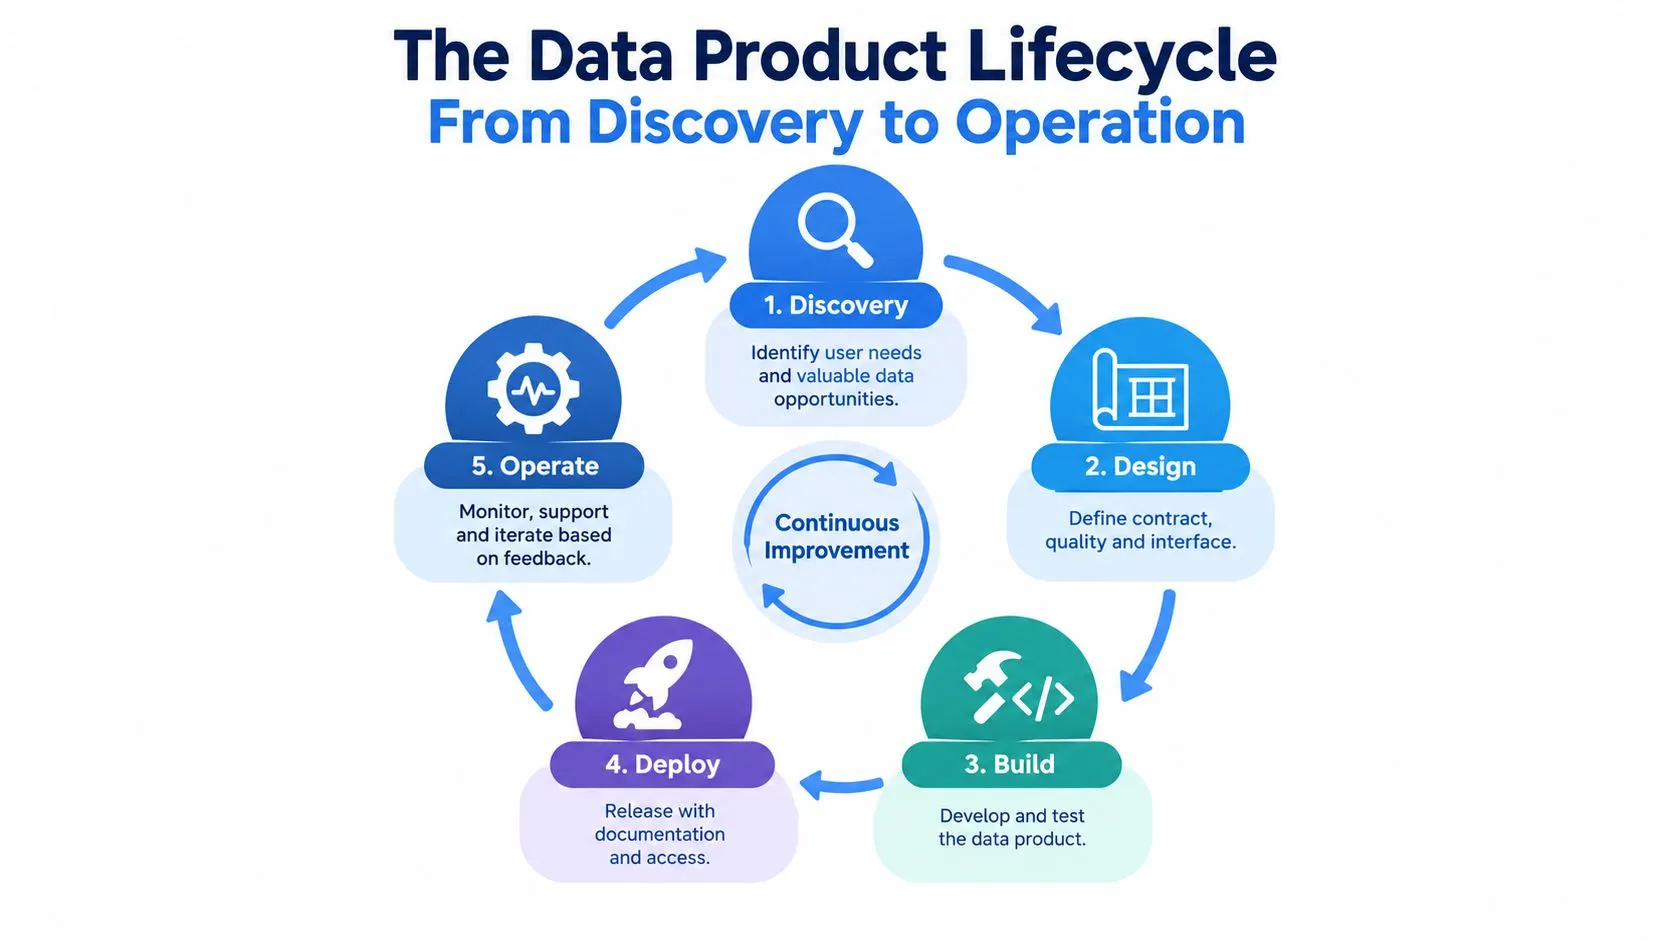
Discovery starts with a repeated decision
The first useful question isn't “What data do we have?” It's “What repeated decision do we want to support?” Good discovery finds a recurring business need, not just a technically possible artifact.
That usually means talking to the consumer in concrete terms:
- What decision are you making?
- How often do you make it?
- What breaks when the data is late, wrong, or missing?
- What would self-serve use look like?
A lot of pipeline work gets built before that is clear. Then nobody adopts it. For teams comparing implementation options, these data pipeline tools matter, but the tool choice only helps after the demand and interface are defined.
Design turns the need into a product contract
Design is where product thinking changes the outcome. Instead of jumping to transformations, the team specifies the contract first. What will the product expose? Who owns it? What should consumers expect for freshness, quality, and change management?
This is also where you decide whether the product should be a source-aligned asset, a cross-domain metric layer, or a consumer-facing analytical interface.
Here's a visual summary of the lifecycle before we get into operating reality.
Build and deploy are packaging steps, not just coding steps
The build phase is where engineers implement transformations, tests, metadata, and access patterns. But in mature teams, build also includes the user-facing parts that often get skipped:
- Documentation that answers common consumer questions
- Example queries or notebook patterns
- Data quality checks and alerting
- Versioning rules for breaking changes
Deploying a data product means releasing the whole package. Not just the table. The access path, the docs, the owner, the alerts, and the support expectation all go live together.
Operation is where trust is won or lost
Once people start using the product, operation becomes the ultimate test. Consumers will push edge cases the original team didn't think about. Upstream systems will change. New users will ask for access without understanding the semantics.
That's normal. A data product should absorb that pressure through monitoring, issue handling, and controlled iteration.
The lifecycle only works when feedback from operation changes the next discovery and design cycle.
The strongest teams treat the product as a maintained service. They don't freeze it after launch. They version it, observe it, and revise it based on actual usage patterns.
Roles Ownership Models and How Teams Organize
A data product without clear ownership becomes a shared myth. Everyone depends on it. Nobody is accountable for fixing it.
The operating model determines whether data product development scales or collapses into ticket queues.
Three common ownership models
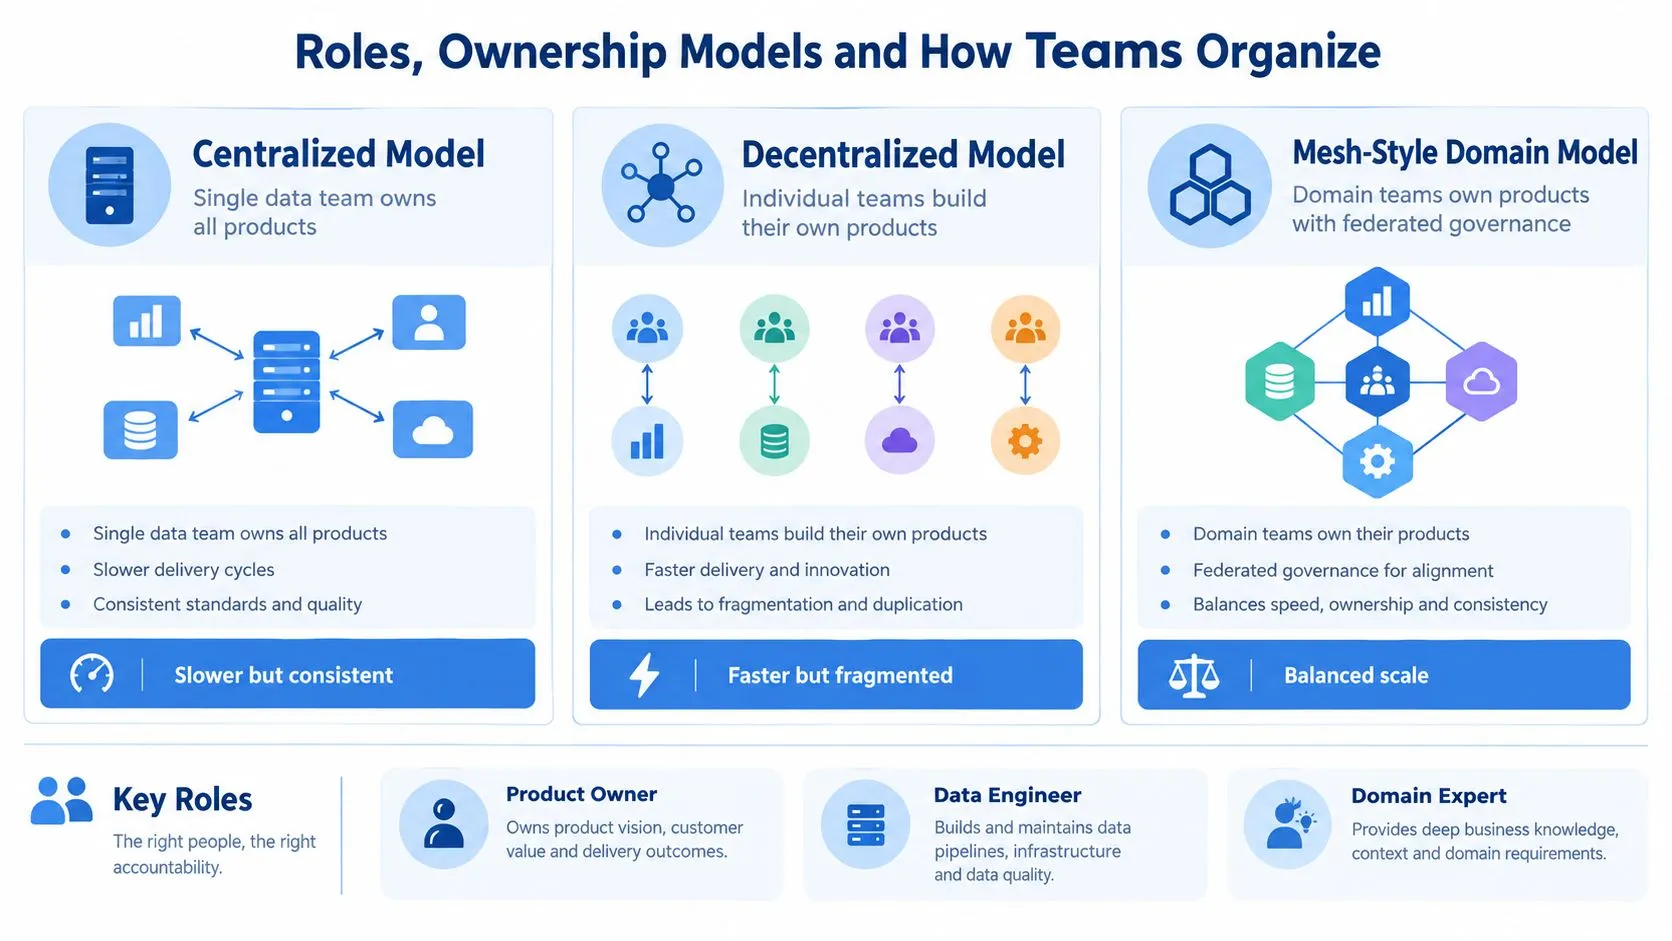
Different companies need different structures. The trade-off is usually between consistency and speed.
| Model | Strength | Risk | Best fit |
|---|---|---|---|
| Centralized | Common standards and tighter control | Data team becomes a delivery bottleneck | Early-stage companies or regulated environments |
| Decentralized | Faster domain execution | Duplicated logic and fragmented definitions | Teams with strong local technical capability |
| Mesh-style domain ownership | Domain context plus shared guardrails | Requires discipline in governance and interfaces | Companies scaling self-serve across multiple domains |
If you want a framing for this shift, this piece on why modern data teams need product thinking aligns well with what cross-functional leaders usually struggle to operationalize.
Who owns what in practice
Titles vary, but the work tends to sort into a few responsibilities:
- Product owner or data product lead: Decides what problem the product solves, who it serves, and what trade-offs are acceptable.
- Data engineer or analytics engineer: Builds transformations, tests, deployment patterns, and observability.
- Domain expert: Validates whether the business meaning is correct.
- Governance partner or security lead: Ensures access, policy, and compliance requirements are built into the interface.
- Consumer team: Uses the product and gives feedback that shapes the next iteration.
A common mistake is assigning ownership only for build. Real ownership includes quality, accessibility, support boundaries, and evolution.
Choosing the model without ideology
Not every company needs a full mesh model. Some need central stewardship because they're still standardizing metric definitions. Others need domain ownership because a single data team can't keep pace with requests.
Use a practical lens:
- Choose more centralization when definitions are inconsistent and platform maturity is low.
- Choose more domain ownership when business units move quickly and understand their data.
- Choose a federated model when many teams need autonomy but shared standards still matter.
McKinsey's framing is useful here. The goal isn't better data for its own sake. The goal is more value, and scaling depends on reusable assets, simple access, DataOps automation, and leaders who can run data products like a business in McKinsey's article on scaling data products.
That last point is where many teams stall. They assign technical responsibility, but they never create product accountability.
Success Metrics Governance and Trust Signals That Matter
A data product can be popular and still be unhealthy. Lots of usage doesn't help if freshness is unpredictable, incidents take too long to detect, or every schema change breaks downstream work.
That's why data product development needs operational signals, not just adoption stories.
Measure the product like an operating service
A practical benchmark is to manage delivery and operations with software-style metrics rather than only business KPIs. Expert guidance repeatedly highlights cycle time, deployment frequency, change failure rate, mean time to recovery, time to market, data quality score, freshness, and mean time to detect data errors as core signals. One synthesis ranks time to market, number of releases, and development cycle time as the most important product-development efficiency metrics because they directly affect how fast a data product can respond to changing business needs. The same guidance recommends defining SLO-like expectations for freshness, availability, and quality, then instrumenting alerting and incident response around them in this metrics guide for data products.
That advice is practical because it forces teams to answer uncomfortable questions early. How stale can this product be before it becomes misleading? How often can access fail before self-serve stops feeling safe?
Operational Health Signals for Data Products
| Metric | What It Signals | Why It Matters for Self-Serve |
|---|---|---|
| Cycle time | How long changes take from request to release | Slow changes push users back to manual workarounds |
| Deployment frequency | How often the team can safely ship updates | Frequent safe releases support iteration without drama |
| Change failure rate | How often releases introduce problems | High failure makes consumers distrust every update |
| Mean time to recovery | How fast the team restores service after incidents | Faster recovery protects business workflows |
| Freshness | How current the data is relative to expectation | Users can't act confidently on stale data |
| Data quality score | Whether core checks are passing consistently | Quality visibility lets consumers judge fitness quickly |
| Mean time to detect data errors | How quickly issues are noticed | Fast detection limits downstream spread of bad data |
| Time to market | How quickly a useful product reaches consumers | Long delivery cycles often mean the problem has changed |
Governance belongs in the product contract
Governance often gets treated like a gate at the end. That's backwards. Governance is part of the interface.
A consumer needs to know:
- Who owns the product
- Who can access it
- What terms define acceptable use
- What quality checks are in force
- What happens when the product breaches expectations
For teams building these controls, a clear primer on what data governance is helps align policy work with product delivery instead of treating it as a separate stream.
Key distinction: Governance that depends on manual review doesn't scale self-serve. Governance embedded in the product does.
Trust comes from visible promises
The moment you publish a data product for self-serve use, you are making a promise. Not perfection. A visible, testable promise.
That's why automated scoring matters. If the producing team grades its own product informally, users will eventually discount those claims. If quality checks are explicit and independently reviewable, trust gets easier to maintain.
Operational trust is built from repeated evidence. Consumers don't need your architecture diagram. They need to know whether this product is safe to use right now.
Architectures Patterns and the Self Serve Acceleration Path
Architecture choices decide whether self-serve is real or performative. A team can say “everyone has access” and still force people through analysts for every meaningful question.
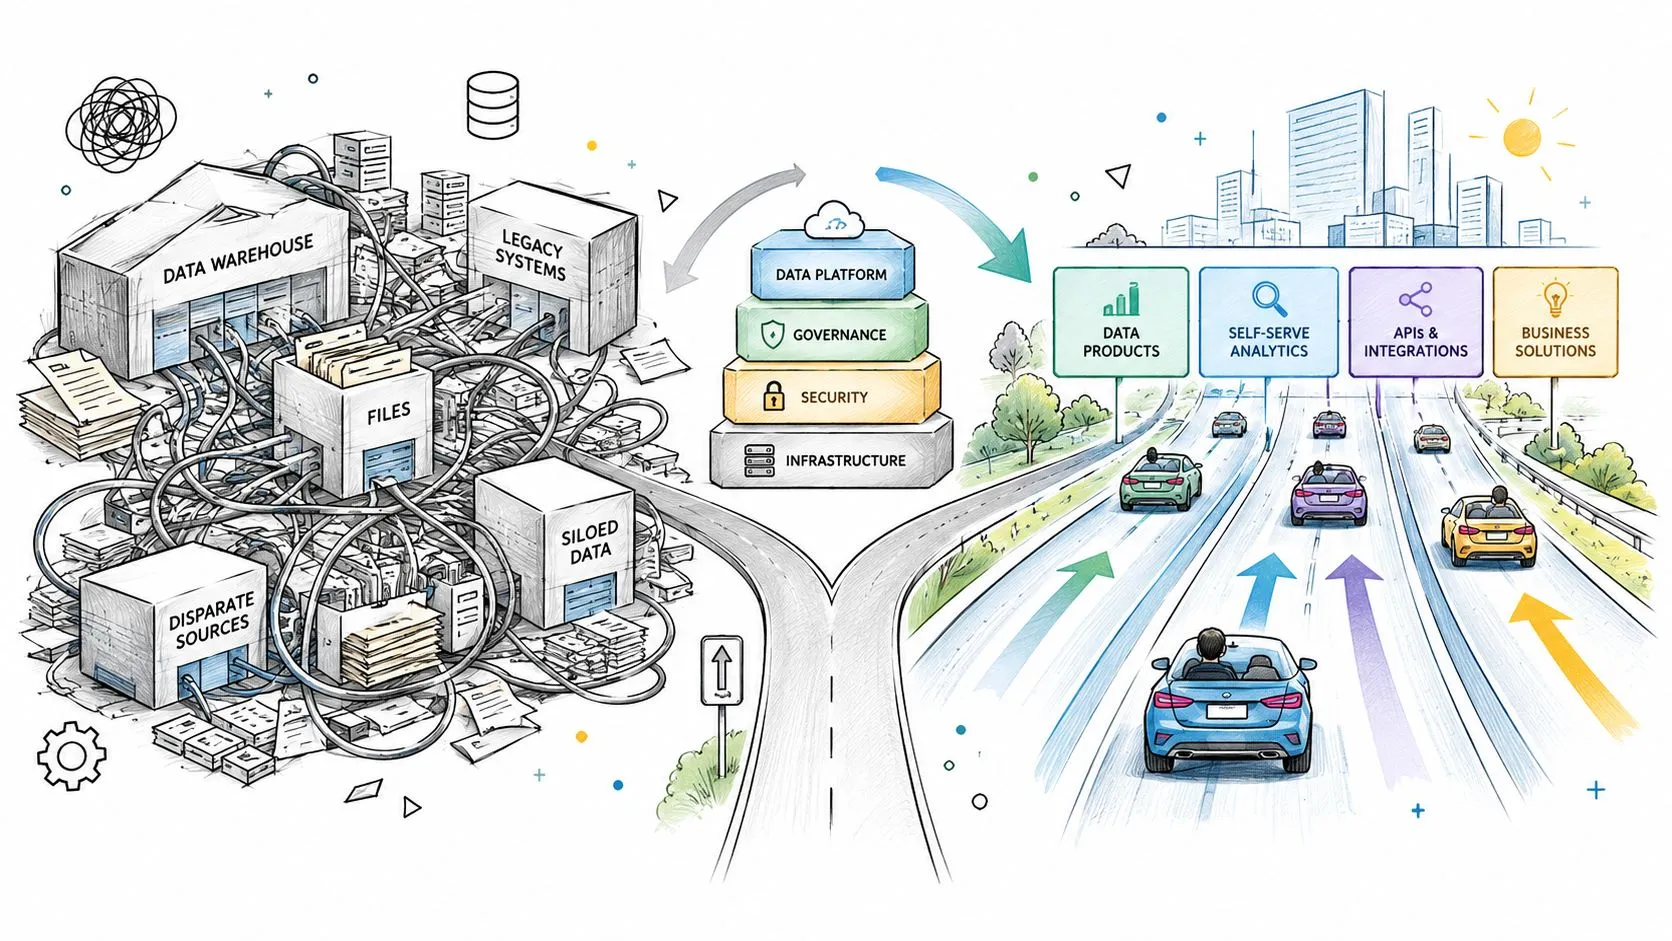
The pattern that scales is simple. Separate production from consumption without separating consumers from understanding.
Why file-system interfaces matter
Many organizations still rely on a scattered stack. Transformation logic lives in one place. Dashboards live somewhere else. Ad hoc analysis lives in personal notebooks. Definitions live in chat threads. That setup makes reuse hard because the interface is fragmented.
A file-system-oriented approach can improve this by making the product surface feel like software. Teams can organize logic, notebooks, helper functions, tests, and documentation in one navigable structure. Consumers don't need to understand every implementation detail, but they do need a stable way to explore and build on top of the product.
Python notebooks fit well here when they stop being private scratchpads and become part of the interface. Used this way, a notebook isn't just an analysis artifact. It becomes a reusable entry point for exploration, validation, and downstream product work.
How notebooks decouple production from consumption
Readers often get confused. They assume “self-serve” means giving everyone raw SQL access. That's only one path, and it often creates more inconsistency.
A better pattern is:
- Producing teams maintain the governed core: models, tests, permissions, and quality rules.
- Consuming teams use stable interfaces: notebooks, semantic views, or APIs that sit on top of that core.
- Shared artifacts live close to the warehouse: so logic is easier to inspect, reuse, and govern.
When notebooks are stored and managed like product assets instead of personal files, they create a middle layer between raw infrastructure and business users. Technical users can extend them. Less technical users can run guided workflows, inspect outputs, and ask better questions without waiting in a queue.
Warehouse-native development keeps the contract closer to the data
Another useful pattern is to keep interfaces close to the warehouse instead of copying data across a patchwork of BI tools. That reduces handoffs and makes metadata, lineage, and access policy easier to keep consistent.
One example is Querio, which deploys AI coding agents directly on the data warehouse and uses a file-system approach with custom Python notebooks so technical and non-technical users can query, analyze, and build on governed warehouse data. The point isn't that every team needs the same tool. The point is that the architecture should make self-serve behavior easier than analyst dependency.
Recent industry coverage also points to common implementation failures: quantity-over-quality thinking, ignored stakeholder feedback, weak collaboration, and delayed governance. It also notes that adoption of data products and data contracts is rising but uneven, which is why dependable and governable operation matters as much as the build itself in Starburst's discussion of data product challenges.
Roadmap Pitfalls and Real World Examples to Guide Your Next Steps
Teams don't need a grand transformation plan. They need one good starting product, a real owner, and a reliability promise they can keep.
A practical roadmap usually works in phases.
A grounded rollout sequence
-
Pick one high-value domain
Start where repeated decisions already exist. Revenue reporting, customer activity, inventory visibility, and pipeline health are common candidates because people already feel the pain.
-
Write the product contract before the build
Define the consumer, access path, business meaning, freshness expectation, quality checks, and owner. If this feels hard, that's useful. The ambiguity was already there.
-
Ship the whole interface
Don't release only the transformed table. Release the docs, access rules, example queries, notebook entry points, and alerting behavior with it.
-
Instrument trust signals early
Add quality scoring, freshness checks, and incident response from the first release. Teams that wait until the first outage usually discover that nobody agrees on the promise.
-
Iterate from usage, not requests alone
Some stakeholder requests reveal real product gaps. Others are local preferences that should sit in a consumer-specific layer, not the governed core.
Pitfalls that stall scale
A few traps show up repeatedly:
- Building too many products at once: Teams create inventory, not value.
- Skipping stakeholder feedback: The logic may be correct but still unusable in the workflow.
- Delaying governance: Access and policy work gets bolted on later and slows adoption.
- Treating every need as a new artifact: Reuse disappears and semantic drift takes over.
- Optimizing for delivery volume: Shipping assets feels productive even when consumers still rely on analysts.
Start with one product that people can use without messaging the data team. That's a stronger proof point than a portfolio of half-governed assets.
What good looks like in the real world
A revenue product might expose standardized bookings and pipeline logic with documented freshness expectations and governed notebook templates for finance and sales.
A customer activity product might package usage events, account mappings, and feature definitions so product managers and success teams can work from the same interface.
A supply visibility product might combine inventory, order, and shipment data with clear status definitions and issue alerts so operations doesn't depend on screenshot reporting.
In each case, the win is the same. The data team stops behaving like a help desk and starts maintaining infrastructure that other teams can trust and extend.
Querio helps teams make that shift by deploying AI coding agents directly on the warehouse and giving users a file-system workspace with custom Python notebooks to explore and build on governed data. If you're trying to turn analyst-mediated reporting into durable self-service infrastructure, visit Querio to see how that operating model works in practice.