Guide
Query Execution Time: A Practical Guide for Data Teams
Learn what query execution time really means, how to measure it accurately, identify root causes of slowness, and apply proven optimization strategies
Your dashboard is loading slowly, a stakeholder is waiting in Slack, and the SQL text looks harmless. You rerun the query. Sometimes it finishes quickly. Sometimes it drags. Someone suggests adding an index. Someone else suggests caching. Both might help, but both might also miss the problem.
That's where teams get stuck with query execution time. They treat it like one number, when it's a bundle of different behaviors. If you don't separate active compute from waiting, and if you don't look at runtime variance across repeated executions, you can spend hours tuning the wrong thing.
Table of Contents
- What Query Execution Time Actually Means
- How to Measure Query Execution Time Correctly
- Why Queries Run Slowly Common Root Causes
- Actionable Strategies to Optimize Slow Queries
- Monitoring and Alerting for Query Performance
- Real-World Case Study From Data Team Operations
- Key Takeaways and Next Steps for Data Teams
What Query Execution Time Actually Means
A lot of people use query execution time to mean “how long I waited for results.” That's useful from the user's point of view, but it's too blunt for diagnosis.
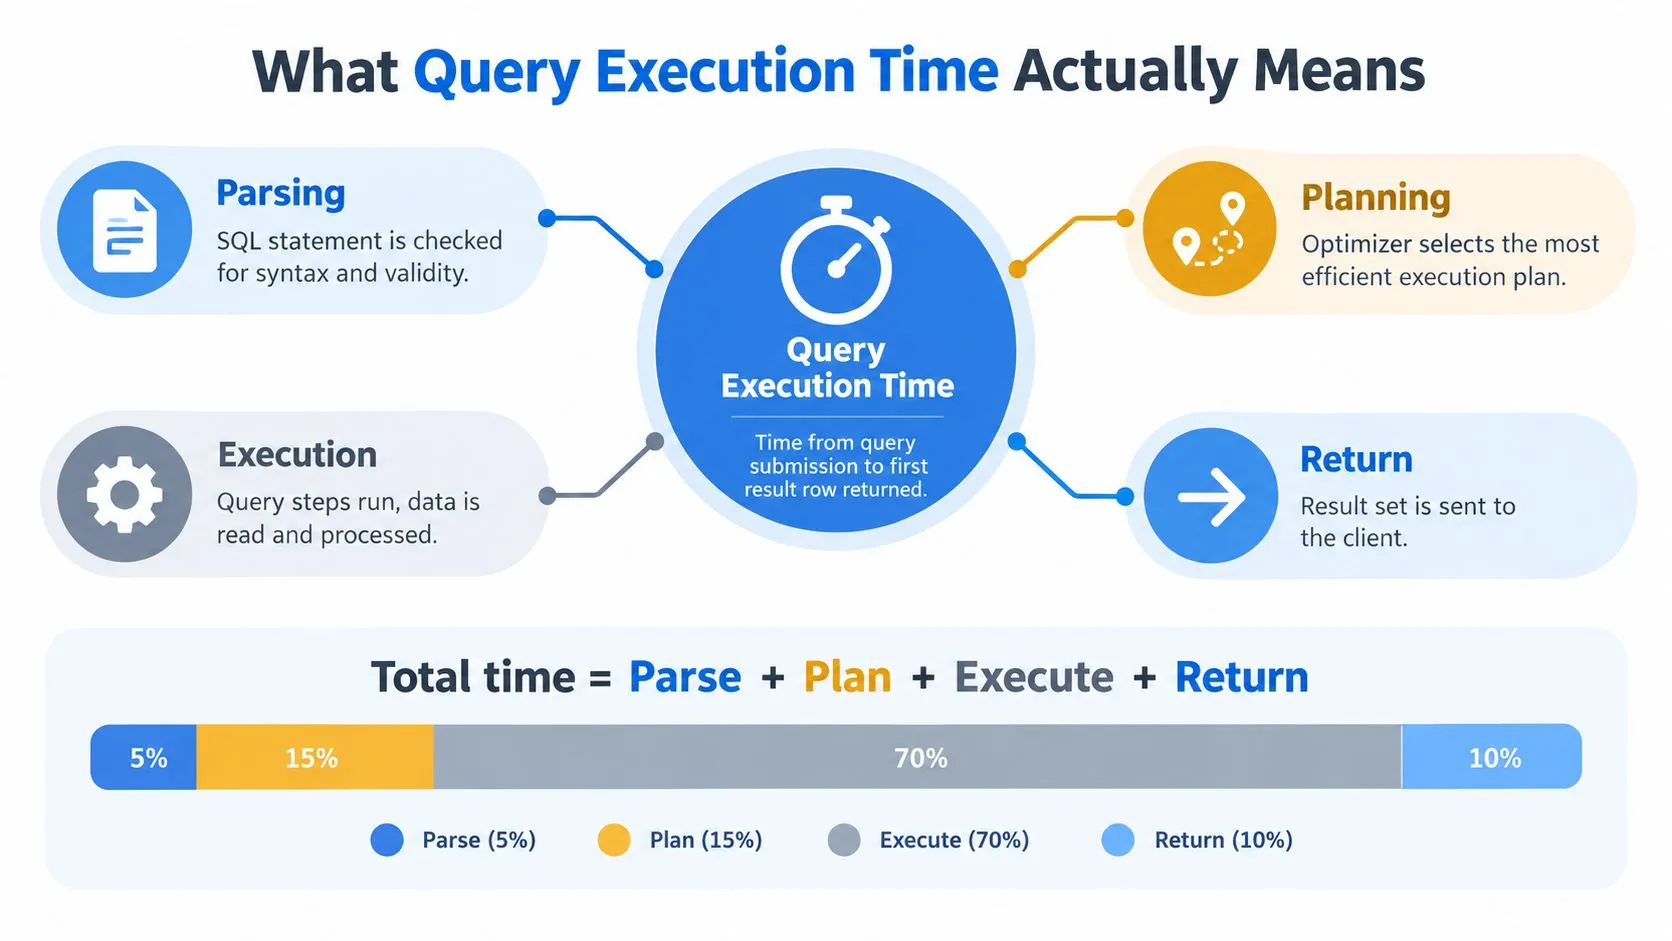
Say you run a reporting query at 9:00 AM, right when scheduled jobs, dashboard refreshes, and ad hoc analysis all hit the warehouse. The query returns late. Your first instinct is often, “the SQL is inefficient.” But that's only one possibility. The database may have spent part of that time parsing the SQL, part planning it, part executing it, and part returning rows to your client.
Wall clock time versus CPU time
The cleanest mental model is a car trip. Wall clock time is the full trip from your driveway to the office. CPU time is the time the engine is actively doing work. Red lights, traffic, and waiting behind another car still count toward the trip, but they aren't engine effort.
Microsoft's SQL Server guidance makes this distinction explicit. It notes that elapsed time includes both CPU time and wait time, while CPU time is the actual execution time and the rest reflects waiting for resources in the system, as described in Microsoft's troubleshooting guidance for slow-running SQL Server queries.
That single distinction clears up a lot of confusion. A query can look slow even when the engine wasn't actively computing for most of its lifetime.
Practical rule: If elapsed time is high but CPU time is low, don't start by rewriting SQL. Start by asking what the query was waiting on.
What people usually measure by accident
Teams often compare one run against another and call it performance analysis. But one number hides too much:
- Submission delay: The client sends the request, but the system may queue or wait before real work starts.
- Planning overhead: The optimizer has to choose a plan. That can matter for short queries.
- Execution work: This is the compute-heavy part. Reads, joins, aggregations, sorts.
- Result return time: The database may finish computing before the client receives all rows.
If you only watch “total duration,” you can't tell which layer changed. That's why two queries with the same SQL text can feel equally slow to a user while needing completely different fixes.
How to Measure Query Execution Time Correctly
Good measurement starts with one habit. Stop asking, “How long did the query take?” Start asking, “Which runtime fields does my platform expose, and what do they mean?”
SQL Server gives you history, not just a snapshot
SQL Server introduced Query Store in SQL Server 2016, and Microsoft describes it as a feature that automatically captures a history of queries, plans, and runtime statistics, retaining that data across executions and organizing it into time windows for comparison over time in Microsoft's Query Store documentation.
That matters because it turns query performance from a one-off debugging session into something you can review historically. In practice, Query Store can show execution history for a specific query across intervals, including fields such as average duration in milliseconds, CPU time, and execution counts. That gives you the raw material to answer questions like:
- Did the query get slower after a plan change?
- Did runtime rise while execution counts also rose?
- Did duration increase while CPU stayed flat, suggesting waits?
If you need help reading SQL before you interpret those metrics, a SQL query explainer can be useful for clarifying what the statement is trying to do before you analyze how it performs.
Snowflake separates recent visibility from historical analysis
Snowflake exposes query timing through its history views, but you need to know which one you're reading. Snowflake documents that QUERY_HISTORY can analyze query history by execution time over the last 365 days, while the underlying ACCOUNT_USAGE view can lag by up to 45 minutes, as explained in Snowflake's query history performance guide.
Snowflake also exposes execution time in milliseconds and provides AGGREGATE_QUERY_HISTORY, which rolls repeated SQL statements into one-minute intervals. That's useful when you care less about one dramatic query and more about workload shape over time.
A practical comparison
| Platform | Best use | What to pull | Watch out for |
|---|---|---|---|
| SQL Server Query Store | Historical troubleshooting and plan comparison | Average duration, CPU time, execution counts, plan history | Teams often read duration without checking CPU versus waits |
| Snowflake QUERY_HISTORY | Query-level runtime review | Execution time, recent history for individual statements | Recent visibility and account views don't behave the same |
| Snowflake AGGREGATE_QUERY_HISTORY | Repeated workload pattern analysis | Aggregated repeated statements over time windows | Aggregation helps trend analysis, but it can hide single-run anomalies |
Don't measure query execution time from a single rerun in your SQL editor and call it a baseline. Pull historical data from the platform's own observability layer.
What to collect every time
When you review a slow query, gather this set before making changes:
- Total elapsed duration so you know what the user experienced.
- CPU time so you know how much active compute happened.
- Execution counts so you can separate one-off pain from recurring pain.
- Plan identity or plan history so regressions are visible.
- Time window context so you can compare the query against surrounding workload.
That checklist sounds basic, but it's what keeps teams from indexing first and thinking second.
Why Queries Run Slowly Common Root Causes
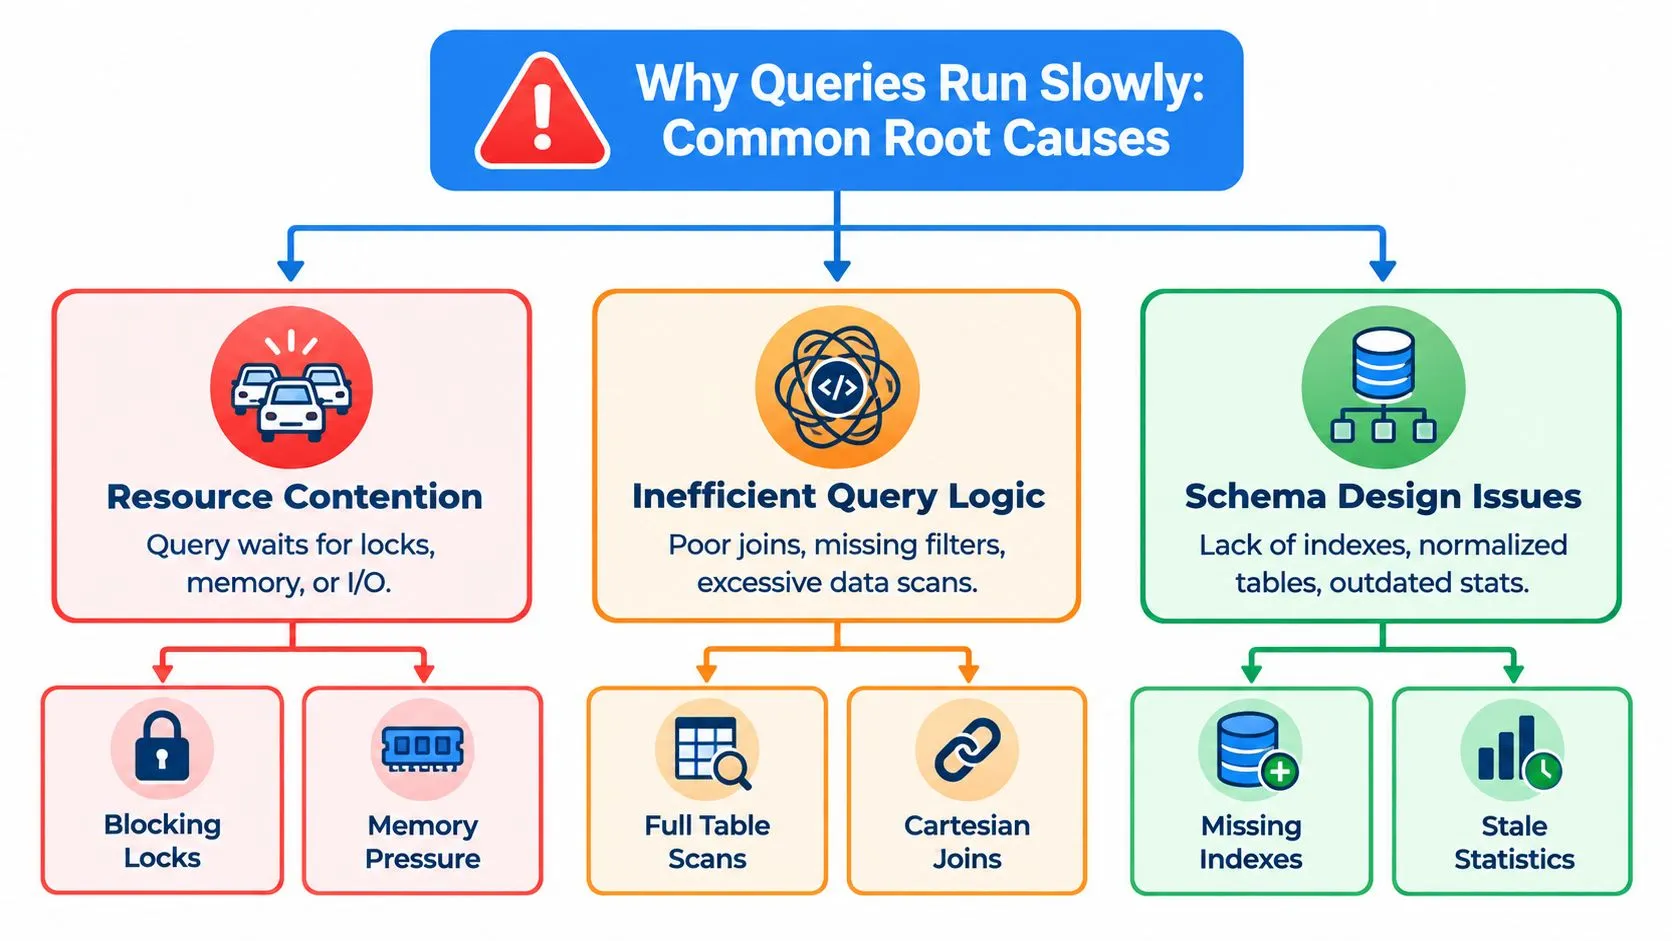
Most slow-query investigations fall into three buckets. The mistake isn't missing the fix. It's choosing a fix before you know which bucket you're in.
Resource contention
Sometimes the SQL is fine. The system around it isn't.
A query can spend much of its lifetime waiting for locks, memory, disk access, or a turn on shared compute. From the analyst's seat, it just looks “slow.” From the engine's seat, it may be mostly idle and blocked by conditions elsewhere in the workload.
A long runtime doesn't automatically mean expensive logic. Elapsed time can mislead people. It may mean the query reached the front door quickly and then stood in line.
Plan regression
A second category is plan regression. The SQL text hasn't changed, but the optimizer picks a less efficient route. Teams often miss this because they read the query and think, “same statement, same behavior.” Databases don't work that way.
Query Store is especially valuable here because it preserves plan history, not just current state. That lets you compare an older, better-performing plan with the new one and confirm that the slowdown came from plan choice, not from a developer editing the SQL.
Runtime variance and tail latency
The third category is the one many articles skip. The same query can behave differently across repeated executions, even when the SQL text is identical.
Recent research found that repeated executions of the same query can vary by nearly twofold, and Google Cloud documentation tells users to compare stage-level execution graphs and final execution durations to detect transient retries or resource contention, as summarized in this research discussion on query runtime variance.
That finding matters because teams often benchmark on averages. Averages are comfortable. They also hide pain. If a query is usually acceptable but occasionally much slower, the problem may be tail latency rather than consistently poor performance.
A query that is “fast on average” can still break dashboards, ETL steps, and SLAs if the slow tail is wide enough.
A simple diagnostic frame
Use this quick sort before you tune anything:
- Low CPU, high elapsed time: Look for waiting, blocking, queuing, or resource pressure.
- Changed plan, changed runtime: Investigate plan regression before rewriting logic.
- Same plan, unstable runtimes: Look for contention, retries, workload interference, or variance in stage behavior.
If you're also revisiting table structure while diagnosing joins and scans, a practical primer on what a schema in a database is helps keep logical design issues separate from runtime symptoms.
Actionable Strategies to Optimize Slow Queries
Once you know the bottleneck, optimization gets more disciplined. You're no longer trying random improvements. You're matching the intervention to the failure mode.
Start with query shape
The first place I look is the SQL itself. Not because SQL is always the problem, but because bad query shape is common and visible.
Typical fixes include:
- Reduce unnecessary columns:
SELECT *increases I/O, memory use, and result transfer when you only need a handful of fields. - Filter earlier: Push predicates closer to the source so downstream joins and aggregations process less data.
- Simplify nested logic: Deep subqueries, repeated expressions, and avoidable cross joins make plans harder to optimize.
A lot of “database performance issues” are really “asking the engine to do work you didn't mean to request.” If you want a broader checklist, this guide to query optimization techniques covers common SQL-level improvements teams can apply before touching infrastructure.
Use indexing when access paths are the problem
Indexing helps when the engine is reading too much to find too little. It won't rescue a query that's mostly waiting on blocked resources, and it isn't free.
A targeted index can turn a broad scan into a narrower access path. But every index adds write overhead, storage cost, and maintenance complexity. On tables with frequent inserts or updates, that trade-off matters.
Field note: Add an index because the access path is wrong, not because “slow query” and “missing index” seem to belong together.
Revisit data modeling for recurring workload pain
If a query family is consistently awkward, the underlying model may be the constraint. Highly normalized tables can be correct and still expensive for analytics-heavy access patterns. On the other hand, denormalization can reduce join cost while increasing duplication and governance burden.
Product analytics, finance reporting, and customer-facing dashboards often diverge. They don't always need the same shape of data.
Partitioning helps when large tables dominate scans
Partitioning isn't a magic speed button. It helps when your filters line up with partition boundaries and the engine can skip large portions of data.
If analysts commonly filter by event date, billing period, or ingestion window, partition pruning can remove a lot of unnecessary reads. If they don't, partitioning adds complexity without changing much.
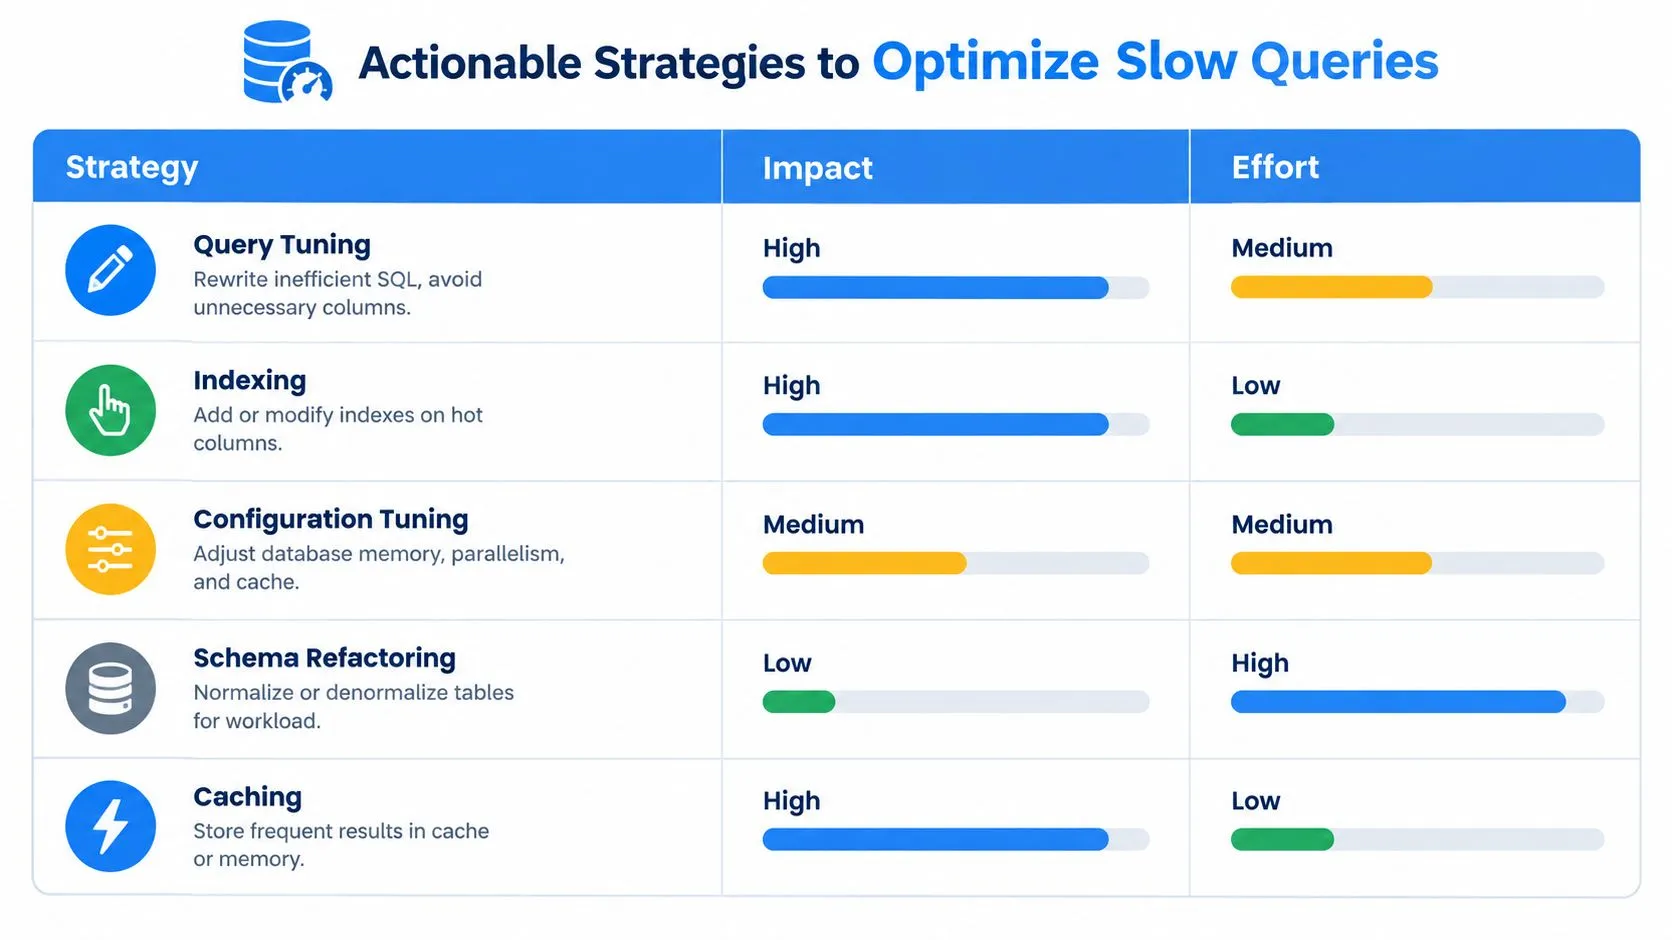
To make the trade-offs concrete, use this decision matrix:
| Strategy | Best when | Poor fit when |
|---|---|---|
| Query tuning | SQL requests too much work | Main issue is external waiting |
| Indexing | Reads are broad and predicates are selective | Workload is write-heavy or bottleneck is contention |
| Data modeling | Same pain repeats across many queries | Problem is isolated to one statement |
| Partitioning | Large tables align with common filters | Queries rarely filter on partition keys |
| Caching | Repeated reads tolerate reused results | Users need fresh data every run |
A short walkthrough can help anchor these choices in practice:
Cache carefully
Caching is great when people ask the same question repeatedly and don't need brand-new answers every second. It's risky when freshness matters, especially for operational dashboards.
Teams also forget that caching can hide inefficient SQL. The cached result looks fine until the cache misses, expires, or serves a slightly different parameter set.
One tooling note here: some teams use warehouse-native history plus notebook environments to distinguish execution time from queueing and rerun behavior. Querio is one option in that category because it uses a notebook-style execution environment on the warehouse, which fits teams that want to inspect repeated query behavior inside a self-serve workflow.
Monitoring and Alerting for Query Performance
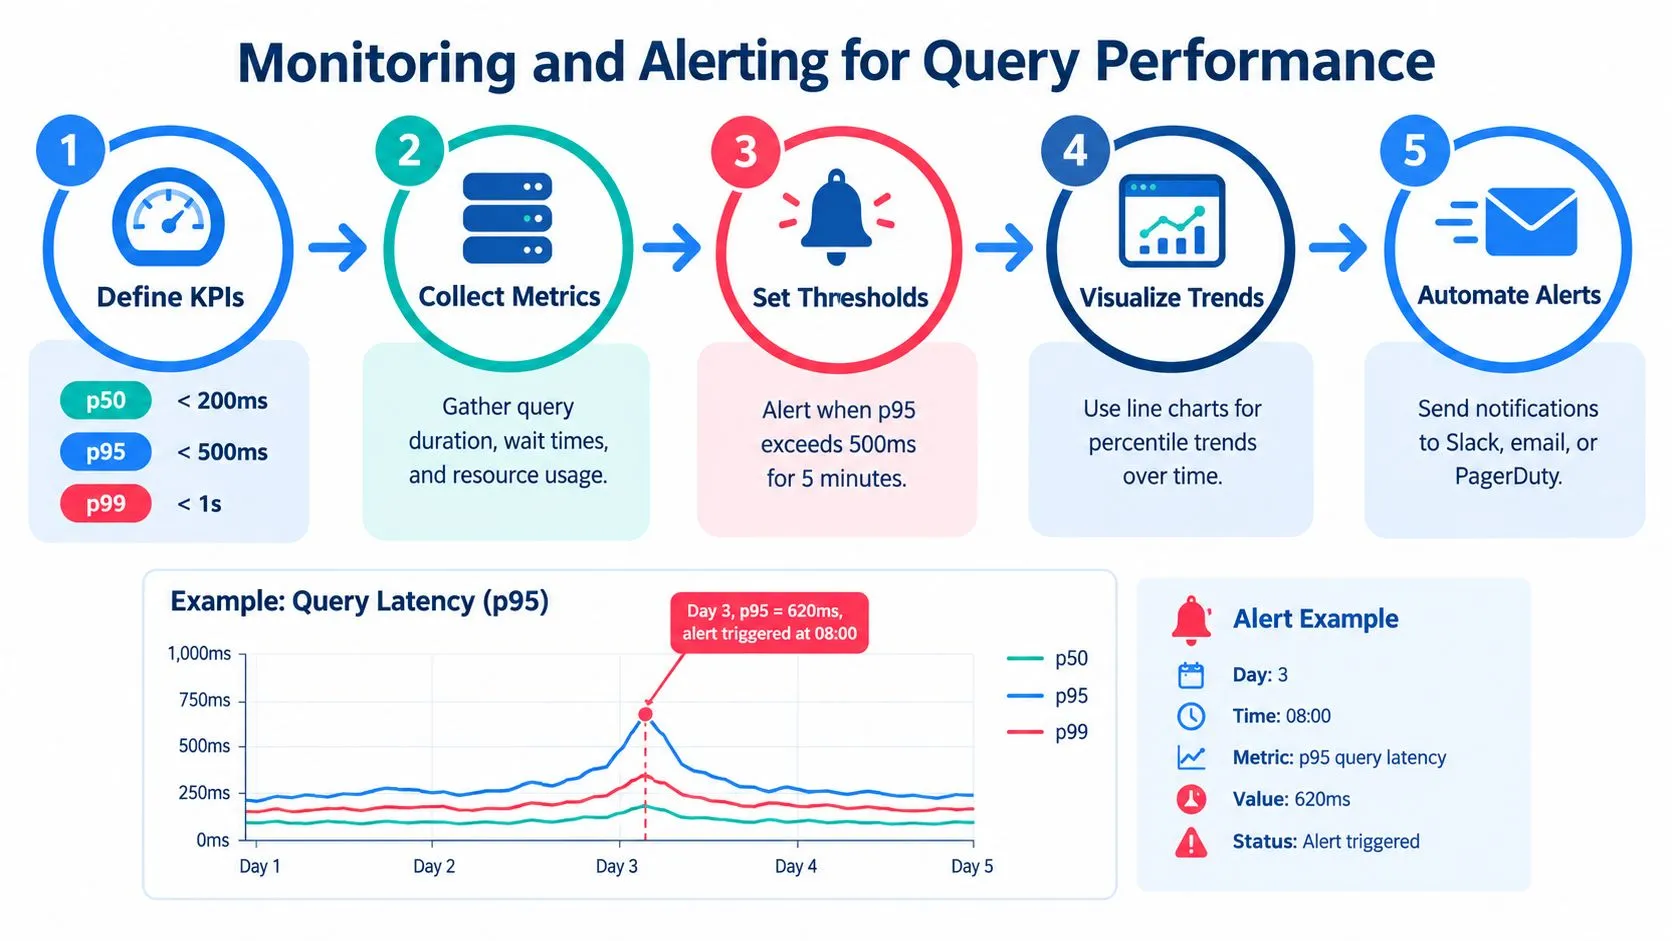
If you only investigate query performance when a stakeholder complains, you're already behind. Monitoring needs to tell you two things early: when latency is drifting, and whether that drift is normal workload growth or a real regression.
Track distributions, not just averages
Average duration is easy to chart and easy to misread. If most runs are fine but a smaller set is painfully slow, the average may barely move while users still feel breakage.
That's why mature teams watch percentiles. The exact thresholds depend on workload and user expectations, but the pattern is consistent:
- p50 shows the typical experience.
- p95 shows what the slower edge of normal looks like.
- p99 shows how bad the tail gets under stress.
A monitoring stack that only reports averages will understate runtime variance. A stack that tracks percentiles will surface it.
Build alerts around patterns
Don't alert on a single slow run. One isolated outlier may be harmless. Alert when a percentile stays high across a time window, or when a known query family deviates from its own historical baseline.
Useful alert inputs include:
- Sustained percentile drift: A higher p95 over a meaningful window.
- Plan changes: A query begins using a different plan and slows down afterward.
- Workload shape changes: The same query runs more often, against more data, or during heavier concurrency.
If you're formalizing this process, a roundup of query optimization tools can help you think through which observability layers belong in the warehouse, the database, and the team's reporting workflow.
The goal of alerting isn't to prove that a query was slow once. It's to catch a shift before users build their day around it.
Separate growth from degradation
One of the harder calls in operations is deciding whether a slower query is unhealthy. If the business doubled the data scanned by a report, some increase in runtime may be expected. That isn't the same as a regression caused by a new plan or resource bottleneck.
Review query performance with business context attached:
- Did data volume change materially?
- Did concurrency change because more teams use the asset?
- Did the plan, wait profile, or tail behavior change?
That last question is often what reveals the difference between healthy growth and operational drift.
Real-World Case Study From Data Team Operations
A mid-sized data team I worked with had a weekly pattern that looked random from the outside. Their product dashboard would load acceptably most of the time, then crawl during peak business hours. The SQL text hadn't changed, so the first reaction was to blame traffic growth and discuss caching.
The team did one smart thing early. They stopped staring at the latest slow run and looked at historical behavior. In SQL Server, that means using Query Store as a persistent record of runtime and plan history rather than relying on a transient cache view. They found a plan change around the same period that complaints started.
What made the diagnosis tricky
The query didn't fail every time. Some executions were tolerable. Others were much slower. That inconsistency pushed the team toward the wrong story at first because averages looked less dramatic than user complaints.
The better interpretation was variance. As noted earlier, repeated executions of the same query can vary by nearly twofold in documented research. That's exactly why a dashboard can feel unreliable even when summary metrics look only mildly worse.
How the team resolved it
They followed a simple sequence:
- Confirm the symptom: User-facing dashboard loads were inconsistent, not uniformly bad.
- Check historical plans: Query Store showed that the same SQL text had used different plans over time.
- Compare runtime fields: The slow periods weren't just about more compute. Waiting behavior also changed.
- Stabilize the path: They forced the prior, better-performing plan as a temporary control.
- Fix the underlying cause: Then they reviewed indexing and statistics so the system had a better chance of selecting the right path on its own.
When a query alternates between acceptable and painful, don't ask only “How slow is it?” Ask “How stable is it?”
The lasting improvement didn't come from a generic performance trick. It came from separating plan regression from runtime variance, then addressing each one on purpose.
Key Takeaways and Next Steps for Data Teams
Strong teams treat query execution time as an operational signal, not a vague complaint. The biggest shift is conceptual. Stop treating runtime as one number and start treating it as evidence.
A practical operating checklist looks like this:
- Separate CPU from wait time: A slow query may be blocked more than it computes.
- Watch percentile latency: p95 and p99 expose pain that averages hide.
- Track variance across repeated runs: Stable queries are easier to trust than merely fast averages.
- Review plan history regularly: Historical plan drift often explains sudden regressions.
- Optimize in the right order: Measure first, then decide whether the issue is SQL shape, indexing, schema design, partitioning, or caching.
For data leaders, this matters beyond technical hygiene. When analysts and engineers can diagnose query execution time cleanly, they spend less energy firefighting and more energy building durable analytics systems. That's how a team stops acting like a human API and starts maintaining infrastructure that others can use safely.
If you're deciding what to do this week, start small. Pick one high-value dashboard query. Pull its elapsed time, CPU time, plan history, and runtime distribution. You'll learn more from that exercise than from another round of blanket indexing.
Querio helps data teams work directly on the warehouse with AI coding agents and notebook-style workflows, so people can inspect query behavior, iterate on analysis, and build self-serve data experiences without routing every question through an analyst. If query execution time keeps surfacing in your team's day-to-day work, visit Querio to see how that operating model can reduce bottlenecks while keeping technical control where it belongs.