What Is a Data Product? 2026 Guide to Strategy and ROI
Explore what is a data product, including core types and real-world examples. Learn how to build and scale data assets for measurable business value in 2026.
https://www.youtube.com/watch?v=B53VLUv6_-8
published
Outrank AI
what is a data product, data product, data strategy, data mesh, data management
d237793a-6b5f-4f80-85f2-e5e7093236bf

Your company probably has more data than it had two years ago. It also probably has more arguments about numbers.
Sales has one revenue dashboard. Finance has another. Product is tracking activation in a spreadsheet because the warehouse table changed and nobody told them. The data team spends its week answering Slack messages like “which customer count is right?” and “can you pull this by segment before the board meeting?” The warehouse is full, but confidence is thin.
That's the environment where people start asking what is a data product, and whether it's just another data buzzword. Usually it isn't. It's a practical shift in how a company treats data. Instead of shipping one-off reports and hoping they stay useful, teams build data assets that are owned, documented, reliable, and designed for repeated use. For early teams trying to get their analytics foundations right, the broader sector of analytics software for new app founders is also useful context because it shows how quickly reporting needs outgrow ad hoc tooling.
A data product doesn't mean “more dashboards.” It means giving data the same discipline you already expect from software. It has a purpose, a user, an interface, a service level, and someone responsible when it breaks or needs to evolve.
Table of Contents
From Data Chaos to Data Clarity
A familiar scene plays out in mid-market companies every quarter. Leaders ask for faster decisions. The data team agrees. Then everyone goes back to a workflow that guarantees delays.
Marketing wants a campaign readout. Product wants a clean activation metric. Customer success wants a churn risk list. Each request sounds reasonable on its own. Together, they turn the data team into a queue manager for definitions, joins, and last-mile reporting.
The bottleneck isn't always raw access to data. It's that most companies still manage data as a collection of artifacts instead of something designed for repeat consumption. One team builds a table for a meeting. Another team copies it into a dashboard. A third team exports it into a spreadsheet and changes the logic. Now there are three “truths,” and none of them has an owner.
The operating problem
When executives say they want self-service analytics, they usually mean three things:
Reliable metrics: teams shouldn't have to ask whether a KPI was calculated correctly.
Faster access: business users shouldn't wait days for basic answers.
Lower rework: analysts shouldn't rebuild the same customer, revenue, or funnel logic over and over.
A data product is the operating model that makes that possible. It packages useful data with context, access methods, ownership, and maintenance. Instead of handing people raw ingredients, you give them something they can use.
A raw table is like a box of parts. A data product is the finished appliance with instructions, support, and a warranty.
What changes when data becomes a product
The shift is subtle but important. Teams stop asking, “Did we deliver the dataset?” and start asking, “Can the intended user depend on this to do their job?”
That changes behavior. Someone owns the roadmap. Definitions are explicit. Access is standardized. Quality is monitored. The output becomes reusable, not disposable.
For a mid-market company, that's the point. You don't need a giant platform team to benefit from product thinking. You need fewer one-off requests, clearer ownership, and data that behaves predictably.
Defining a Data Product Beyond the Buzzwords
The term became popular because companies finally hit the limits of treating data work as a stream of tickets. According to Atlan's overview of data products, the concept entered mainstream enterprise discourse around 2019–2020, and by 2020, more than 60% of enterprise data and analytics leaders had begun adopting product-style practices for data assets, including owners, SLAs, and defined consumers.
Why the term showed up everywhere
That timing matters. By then, many organizations had modern warehouses, cloud pipelines, and BI tools. Yet teams still struggled with the same old problem: lots of data, weak usability.
So the conversation matured. Instead of asking only how to store or process data, leaders started asking how to package it for consumption. That's product thinking.
There's a useful parallel in software. A SaaS product isn't just source code. It's a working service with an interface, uptime expectations, access controls, documentation, and a team that maintains it. A data product follows the same logic.
The simple definition
A data product is a self-contained, ready-to-use package of data that's built for a specific consumer and a specific job.
That package usually includes the data itself, the logic that shapes it, and the infrastructure that serves it. It also includes the non-technical things executives care about: ownership, reliability, access rules, and a clear reason for existing.
A useful mental model is the difference between raw groceries and a prepared meal:
A dataset is a bag of ingredients.
A data product is the meal, labeled, portioned, quality-checked, and ready to serve.
This is why a clean table alone usually isn't enough. If nobody knows what it means, how fresh it is, who can use it, or whether the logic changed last week, it's still just an asset waiting for interpretation.
A strong explanation of this shift toward product thinking is in this article on why modern data teams need product thinking.
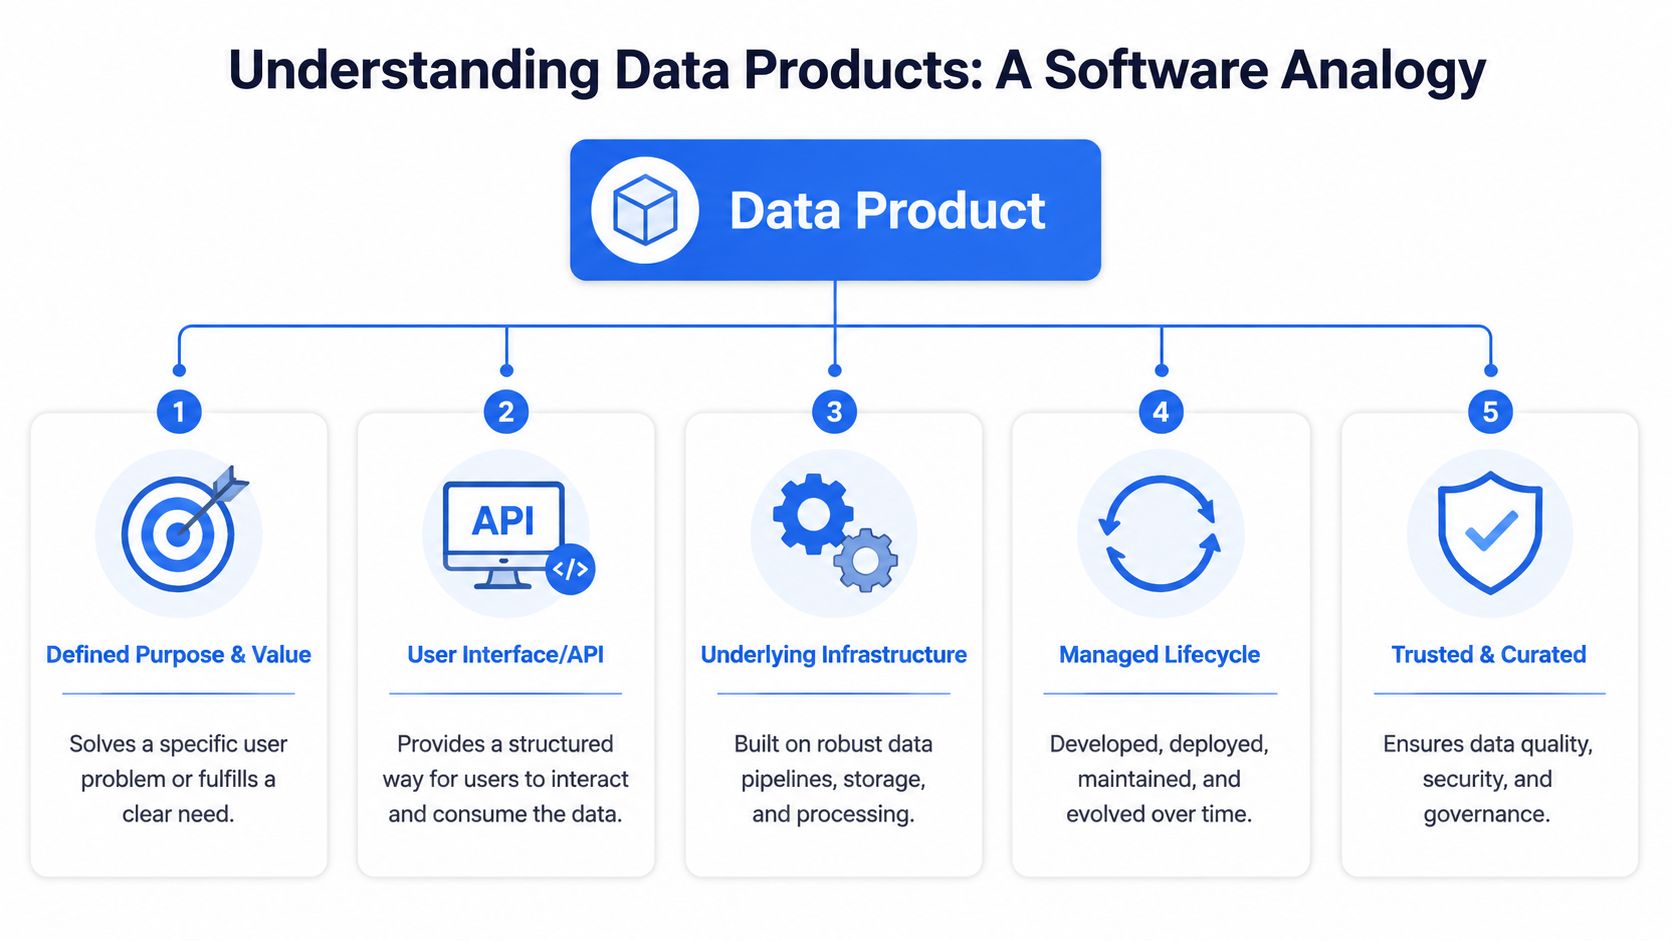
The five parts that make it product-grade
Most confusion disappears when you break the idea into components.
Purpose and value
Every data product should solve a defined problem. “Customer 360 for account reviews” is a purpose. “Misc tables for growth analysis” isn't.Interface
Consumers need a stable way to use it. That might be a SQL view, API, semantic layer, or application endpoint.Underlying infrastructure
Pipelines, storage, orchestration, testing, and permissions sit underneath the surface. Users may not see this layer, but they depend on it.Managed lifecycle
Products are launched, improved, versioned, and eventually retired. That's different from a file or dashboard that gets abandoned after delivery.Quality and trust
Product-grade data is documented, monitored, and governed. Users should know what it contains and whether they can rely on it.
Practical rule: If a business team can't discover it, understand it, trust it, and use it without opening a Slack thread, it probably isn't a real data product yet.
This is also why the question “what is a data product” isn't academic. It's really a question about operational discipline. Data becomes more valuable when it's intentionally designed for repeat use, not when it merely exists.
Data Product vs Data Asset vs Dashboard
Teams often use these terms interchangeably, and that creates strategy problems fast. If leaders call everything a data product, they end up funding maintenance for things that were never designed to be maintained.
Why teams mix these up
A dashboard can be useful. A dataset can be valuable. A feature store can be essential for machine learning. But they aren't the same thing.
In data mesh language, a data product is a self-contained, domain-oriented package comprising raw data, metadata, semantics, and templated access interfaces. It should be discoverable, addressable, trustworthy, and self-describing. That framing, described in OneData's explanation of data products, is useful because it separates a product from a loose collection of files or reports.
One practical result of that approach is less dependence on people as translators. The same source notes that this model enabled analysts to query independently and cut “human API” requests by 70% in mid-market firms.
A dashboard still matters. It's just often the application layer on top of a product, not the product itself. If your team needs a plain-language primer on that distinction, this overview of what a dashboard is and isn't is a helpful complement.
Data concepts compared
Concept | Primary Purpose | Ownership | Interface | Value |
|---|---|---|---|---|
Data Product | Deliver trusted, reusable data for a defined business use | Named owner, often domain-aligned | SQL view, API, semantic layer, documented access pattern | Repeated decision-making, workflows, or analytics |
Data Asset | Store or expose data in some usable form | Often technical or shared ownership | Table, file, stream, model artifact | Potential value, but not always consumption-ready |
Dashboard | Present metrics visually for monitoring or analysis | Usually analyst, BI team, or function owner | BI interface such as Looker or Power BI | Fast visibility into questions already modeled |
Feature Store | Serve model features consistently to training and inference workflows | ML or platform team | Programmatic interfaces and pipelines | Reliable machine learning inputs |
The distinction that matters most is this: a data asset becomes a data product only when it is intentionally packaged for a consumer with reliability, context, and ownership.
If a dashboard breaks, users lose a view. If a data product breaks, downstream decisions and systems may lose a dependency. That's why the operating model has to be tighter.
For executives, this framing helps with prioritization. Don't turn every useful artifact into a product. Reserve that investment for the datasets, metrics, and services that many teams reuse or that support important decisions repeatedly.
Real-World Examples and Types of Data Products
The fastest way to understand this idea is to look at examples you'd recognize inside a growing company.
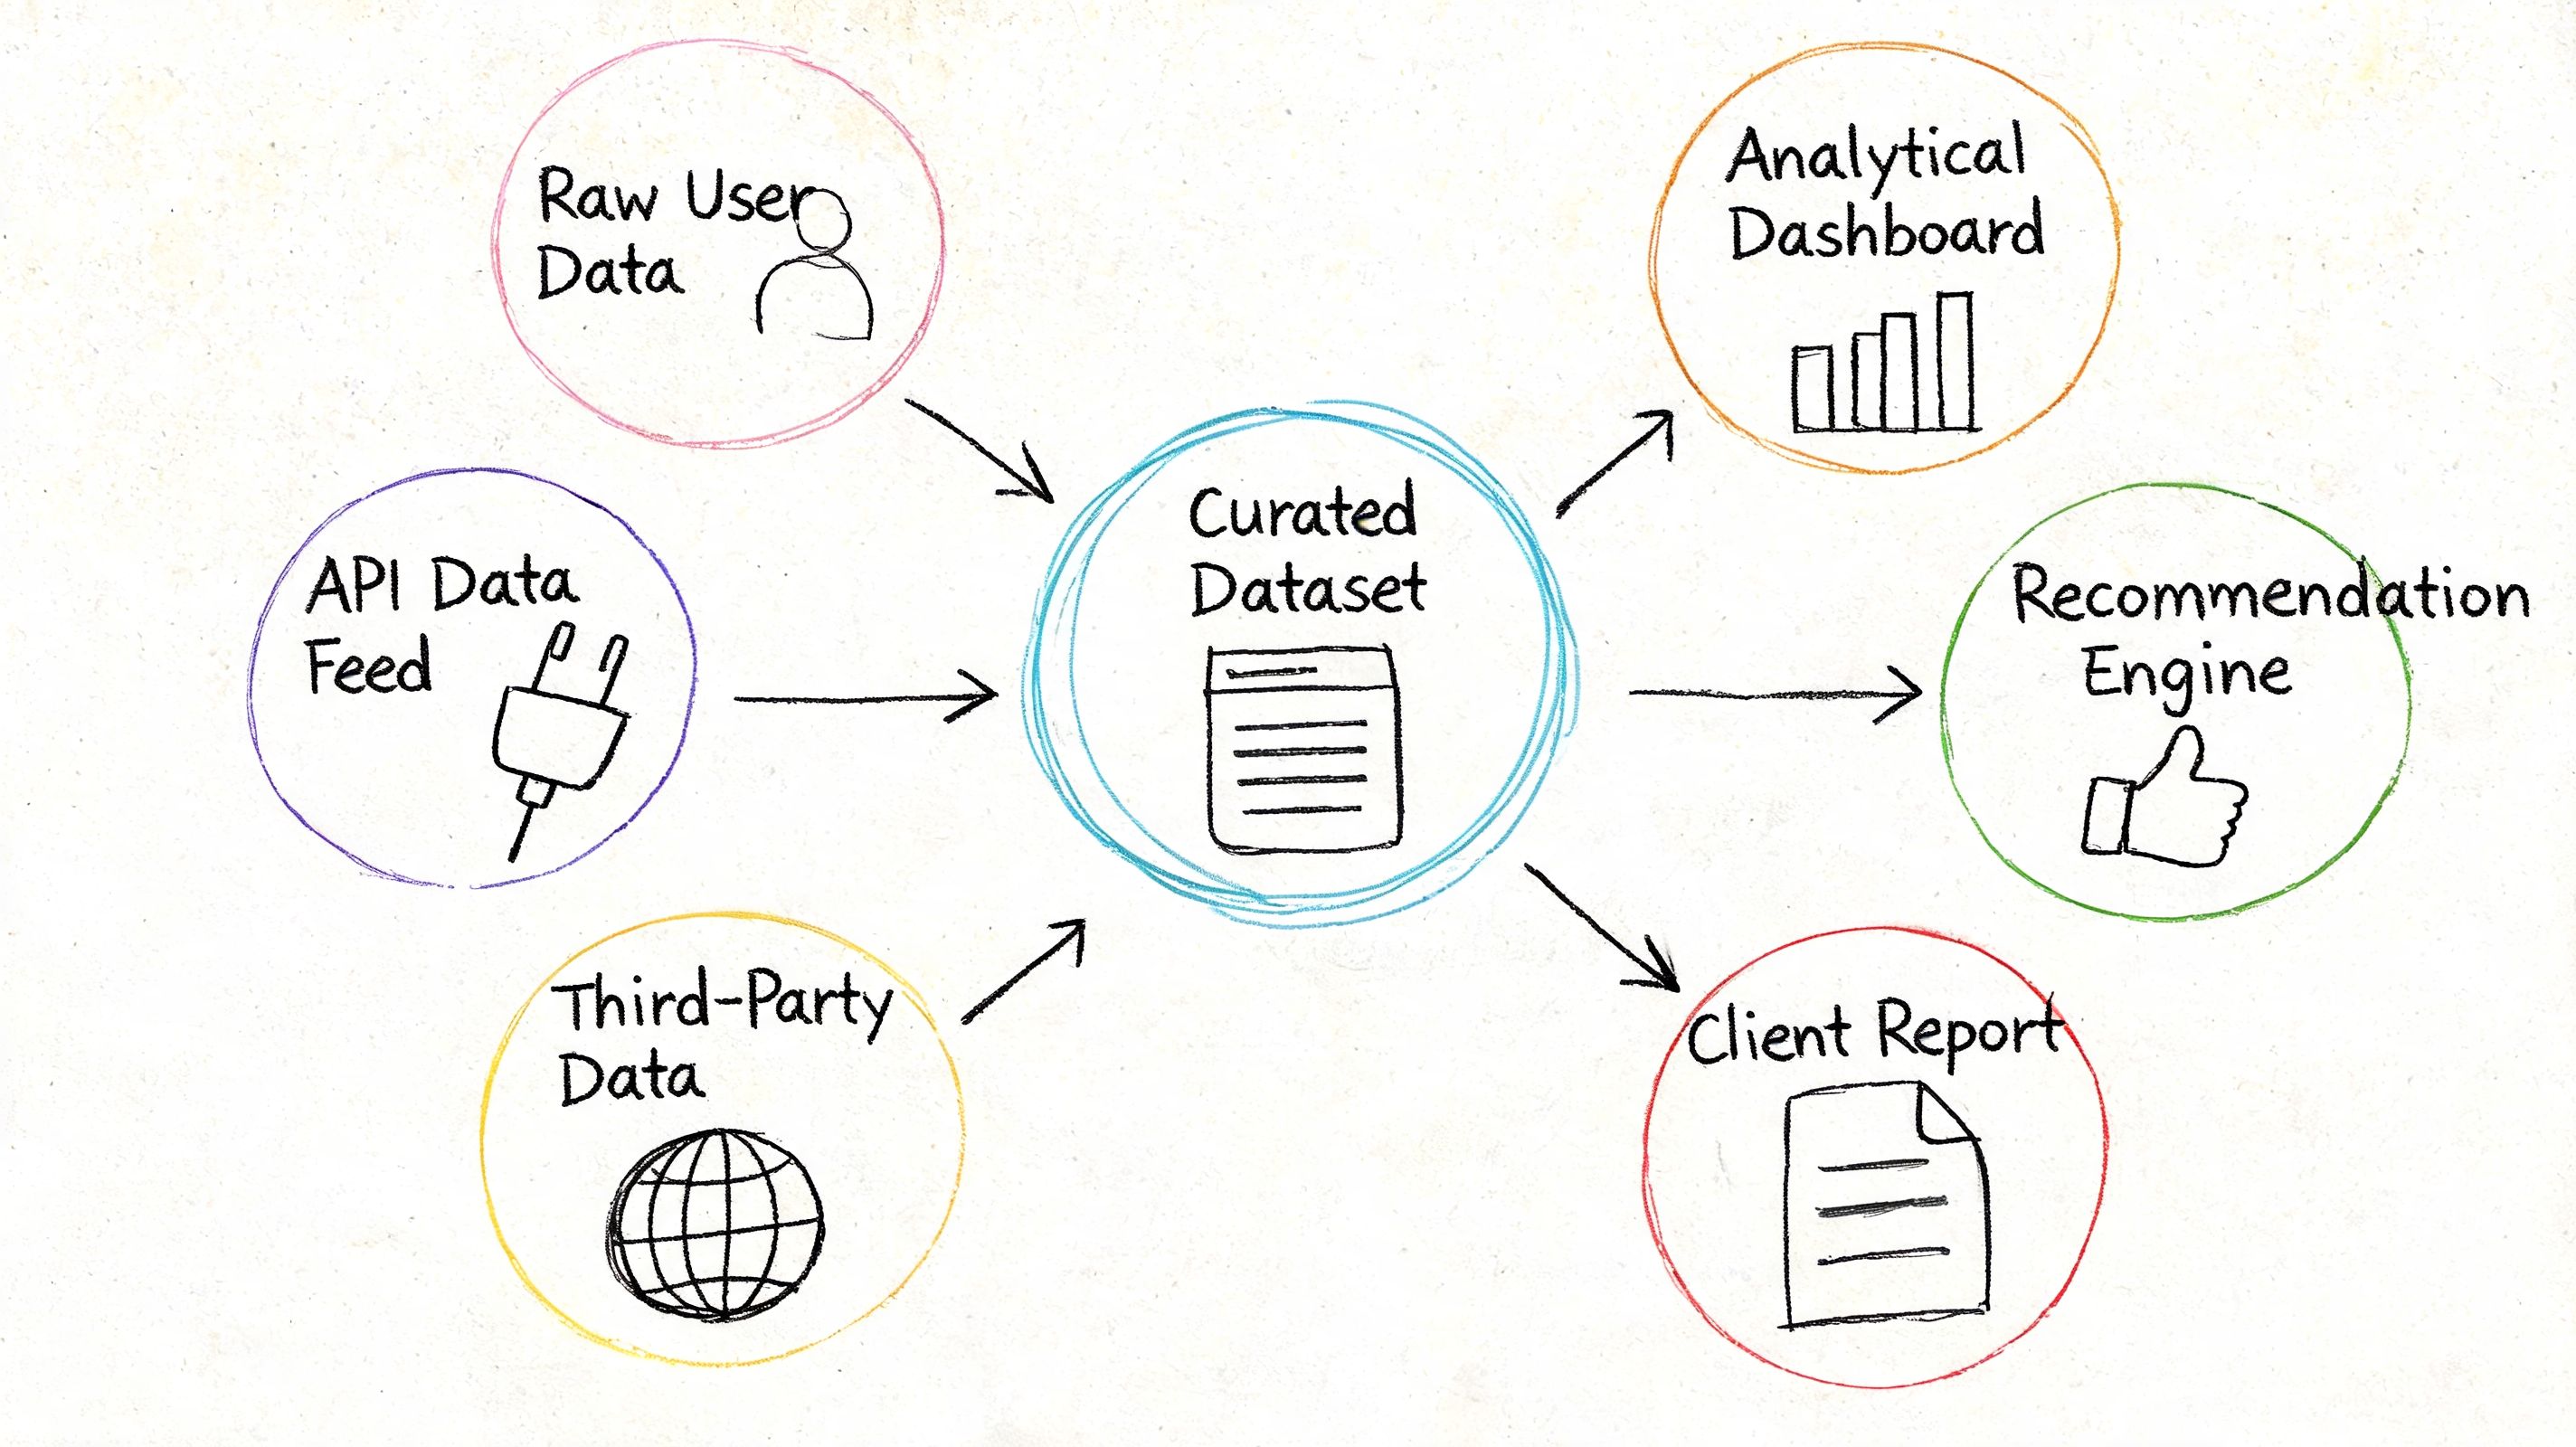
Analytical products for recurring decisions
A common example is a trusted metrics layer for executive reporting.
Suppose finance, product, and growth all need “monthly active users,” “net revenue retention,” and “pipeline by segment.” Instead of each team calculating these separately, the company creates a governed metrics product with approved logic, definitions, and access patterns. Product managers use it for planning. Finance uses it for board materials. Analysts build dashboards on top of it.
Another example is a curated customer health dataset. It joins product usage, support activity, billing status, and contract data into one business-ready object. Customer success can sort accounts by risk. Leadership can review renewals with less manual prep.
Operational products embedded in workflows
Some data products don't look like analytics at all. They power actions.
A Customer 360 API is a good example. Sales or support applications can request a current customer profile from one interface instead of stitching together CRM, billing, and engagement records manually. The consumer isn't just a person. It may be another system.
This matters for go-to-market teams. If your revenue organization is standardizing account and contact data for prospecting and account planning, tools in the stack such as Zoominfo for B2B outreach often become upstream inputs or downstream consumers of these products. The product itself is the governed layer that combines and standardizes the data for repeated use.
Model-driven products for prediction and automation
A third category is a prediction or scoring service.
Think about a churn model. On its own, a model file isn't a product. It becomes a product when teams can access the score consistently, understand the definitions, trust the refresh cadence, and use it in workflows like retention outreach or account reviews.
The same logic applies to fraud flags, lead scoring, inventory forecasts, or content recommendations. The value isn't just in the algorithm. It's in the packaging and operational reliability around it.
This short video gives a useful visual explanation of how teams can think about data products in practice.
A simple way to classify data products is by who consumes them:
Human-consumed products: executive metrics, finance reporting datasets, planning models
System-consumed products: APIs, event streams, identity resolution services
Model-consumed products: feature sets, prediction outputs, scored records
Different forms, same principle. They're all built to be reused without a fresh custom project every time.
The Data Product Lifecycle and Key Team Roles
A data product isn't finished when the pipeline runs for the first time. It moves through a lifecycle, just like software.
Lifecycle stages that matter
Most mid-market teams can manage the lifecycle with five stages.
Identify the use case
Start with a repeated business need. Good candidates usually support a recurring decision, a cross-functional process, or a shared operational workflow.Design the contract Define the consumer, business meaning, access method, freshness expectations, and quality rules. Doing so helps many teams save themselves pain later.
Build and ship
Engineers create transformations, access interfaces, tests, permissions, and documentation. Analysts or domain experts validate the outputs against business reality.Operate and improve
This stage is where products either earn trust or lose it. Usage gets monitored. Quality checks run. Feedback turns into backlog items.Deprecate or replace
If the product no longer solves a meaningful problem, retire it cleanly. Mature teams remove stale products instead of letting them linger forever.
Who owns what
The most important role is usually the data product owner. That person doesn't have to be called that formally, but someone must decide what the product is for, who it serves, how success is measured, and what changes get prioritized.
Other roles typically include:
Data engineers: build pipelines, tests, orchestration, and access patterns
Analytics engineers or analysts: define business logic, metrics, and semantic meaning
Domain stakeholders: validate whether the product is useful in the workflow
Governance or platform leads: enforce access rules, documentation standards, and reliability expectations
A practical build pattern for SaaS teams is outlined in this guide to building a data product inside a SaaS app.
The owner of a data product is not the person who wrote the SQL last. It's the person accountable for usefulness over time.
That distinction keeps teams from treating maintenance as an afterthought.
Product processes improve reliability
There's also a measurable reason to use product discipline. Expert benchmarks summarized by Designing for Analytics describe product-grade data work as including a semantic layer, quality contracts, and deployment as microservices. The same source notes that data products maintained with product processes such as Agile sprints showed 92% reliability versus 65% for raw assets.
The takeaway isn't that every team needs heavyweight process. It's that reliability improves when someone versions changes, runs tests, and manages the roadmap instead of dropping artifacts into the warehouse and moving on.
Managing and Scaling Data Products
Once a company has more than a handful of data products, the challenge changes. The issue isn't creation. It's portfolio management.
What to measure
A product nobody uses isn't strategic infrastructure. It's inventory.
The metrics that matter usually fall into three groups:
Usage metrics: who uses the product, how often, and across how many use cases
Service metrics: freshness, availability, failed runs, support tickets, and issue resolution
Outcome metrics: whether the product shortens decision cycles, reduces duplicate work, or lowers operational friction
There is quantitative evidence behind this approach. A 2022 survey summarized by IBM's data product overview found that companies using explicit data product frameworks reported 30–50% faster time-to-insight, 40–60% less redundant data engineering work, and 20–40% fewer data incidents per month.
Those numbers are useful because they map directly to executive concerns. Speed. Efficiency. Trust.
Governance that keeps trust intact
Governance sounds heavy, but good governance removes friction for the right users.
For data products, governance usually means:
Discoverability: people can find the product in a catalog or portal
Documentation: business definitions, lineage, and usage guidance are clear
Access control: authorized users can use it without back-channel requests
Monitoring: freshness and quality checks alert the owner before users complain
Change management: schema or logic changes follow a visible process
Mid-market companies don't need a giant governance office to do this well. They need a few essential elements and a habit of enforcing them consistently.
Good governance isn't a layer added after launch. It's the reason people trust the product enough to use it without asking for manual verification.
Common failure patterns
The most common mistakes are straightforward.
Building without a consumer: the team produces a polished asset that solves no urgent problem.
Confusing launch with success: nobody owns adoption or maintenance after release.
Overproducing dashboards: visual outputs multiply while definitions drift underneath.
Ignoring retirement: stale products stay visible, so users pick the wrong one.
A portfolio view helps. Leaders should periodically ask which products are business-critical, which are underused, which are redundant, and which should be retired. That's how data strategy becomes operational instead of aspirational.
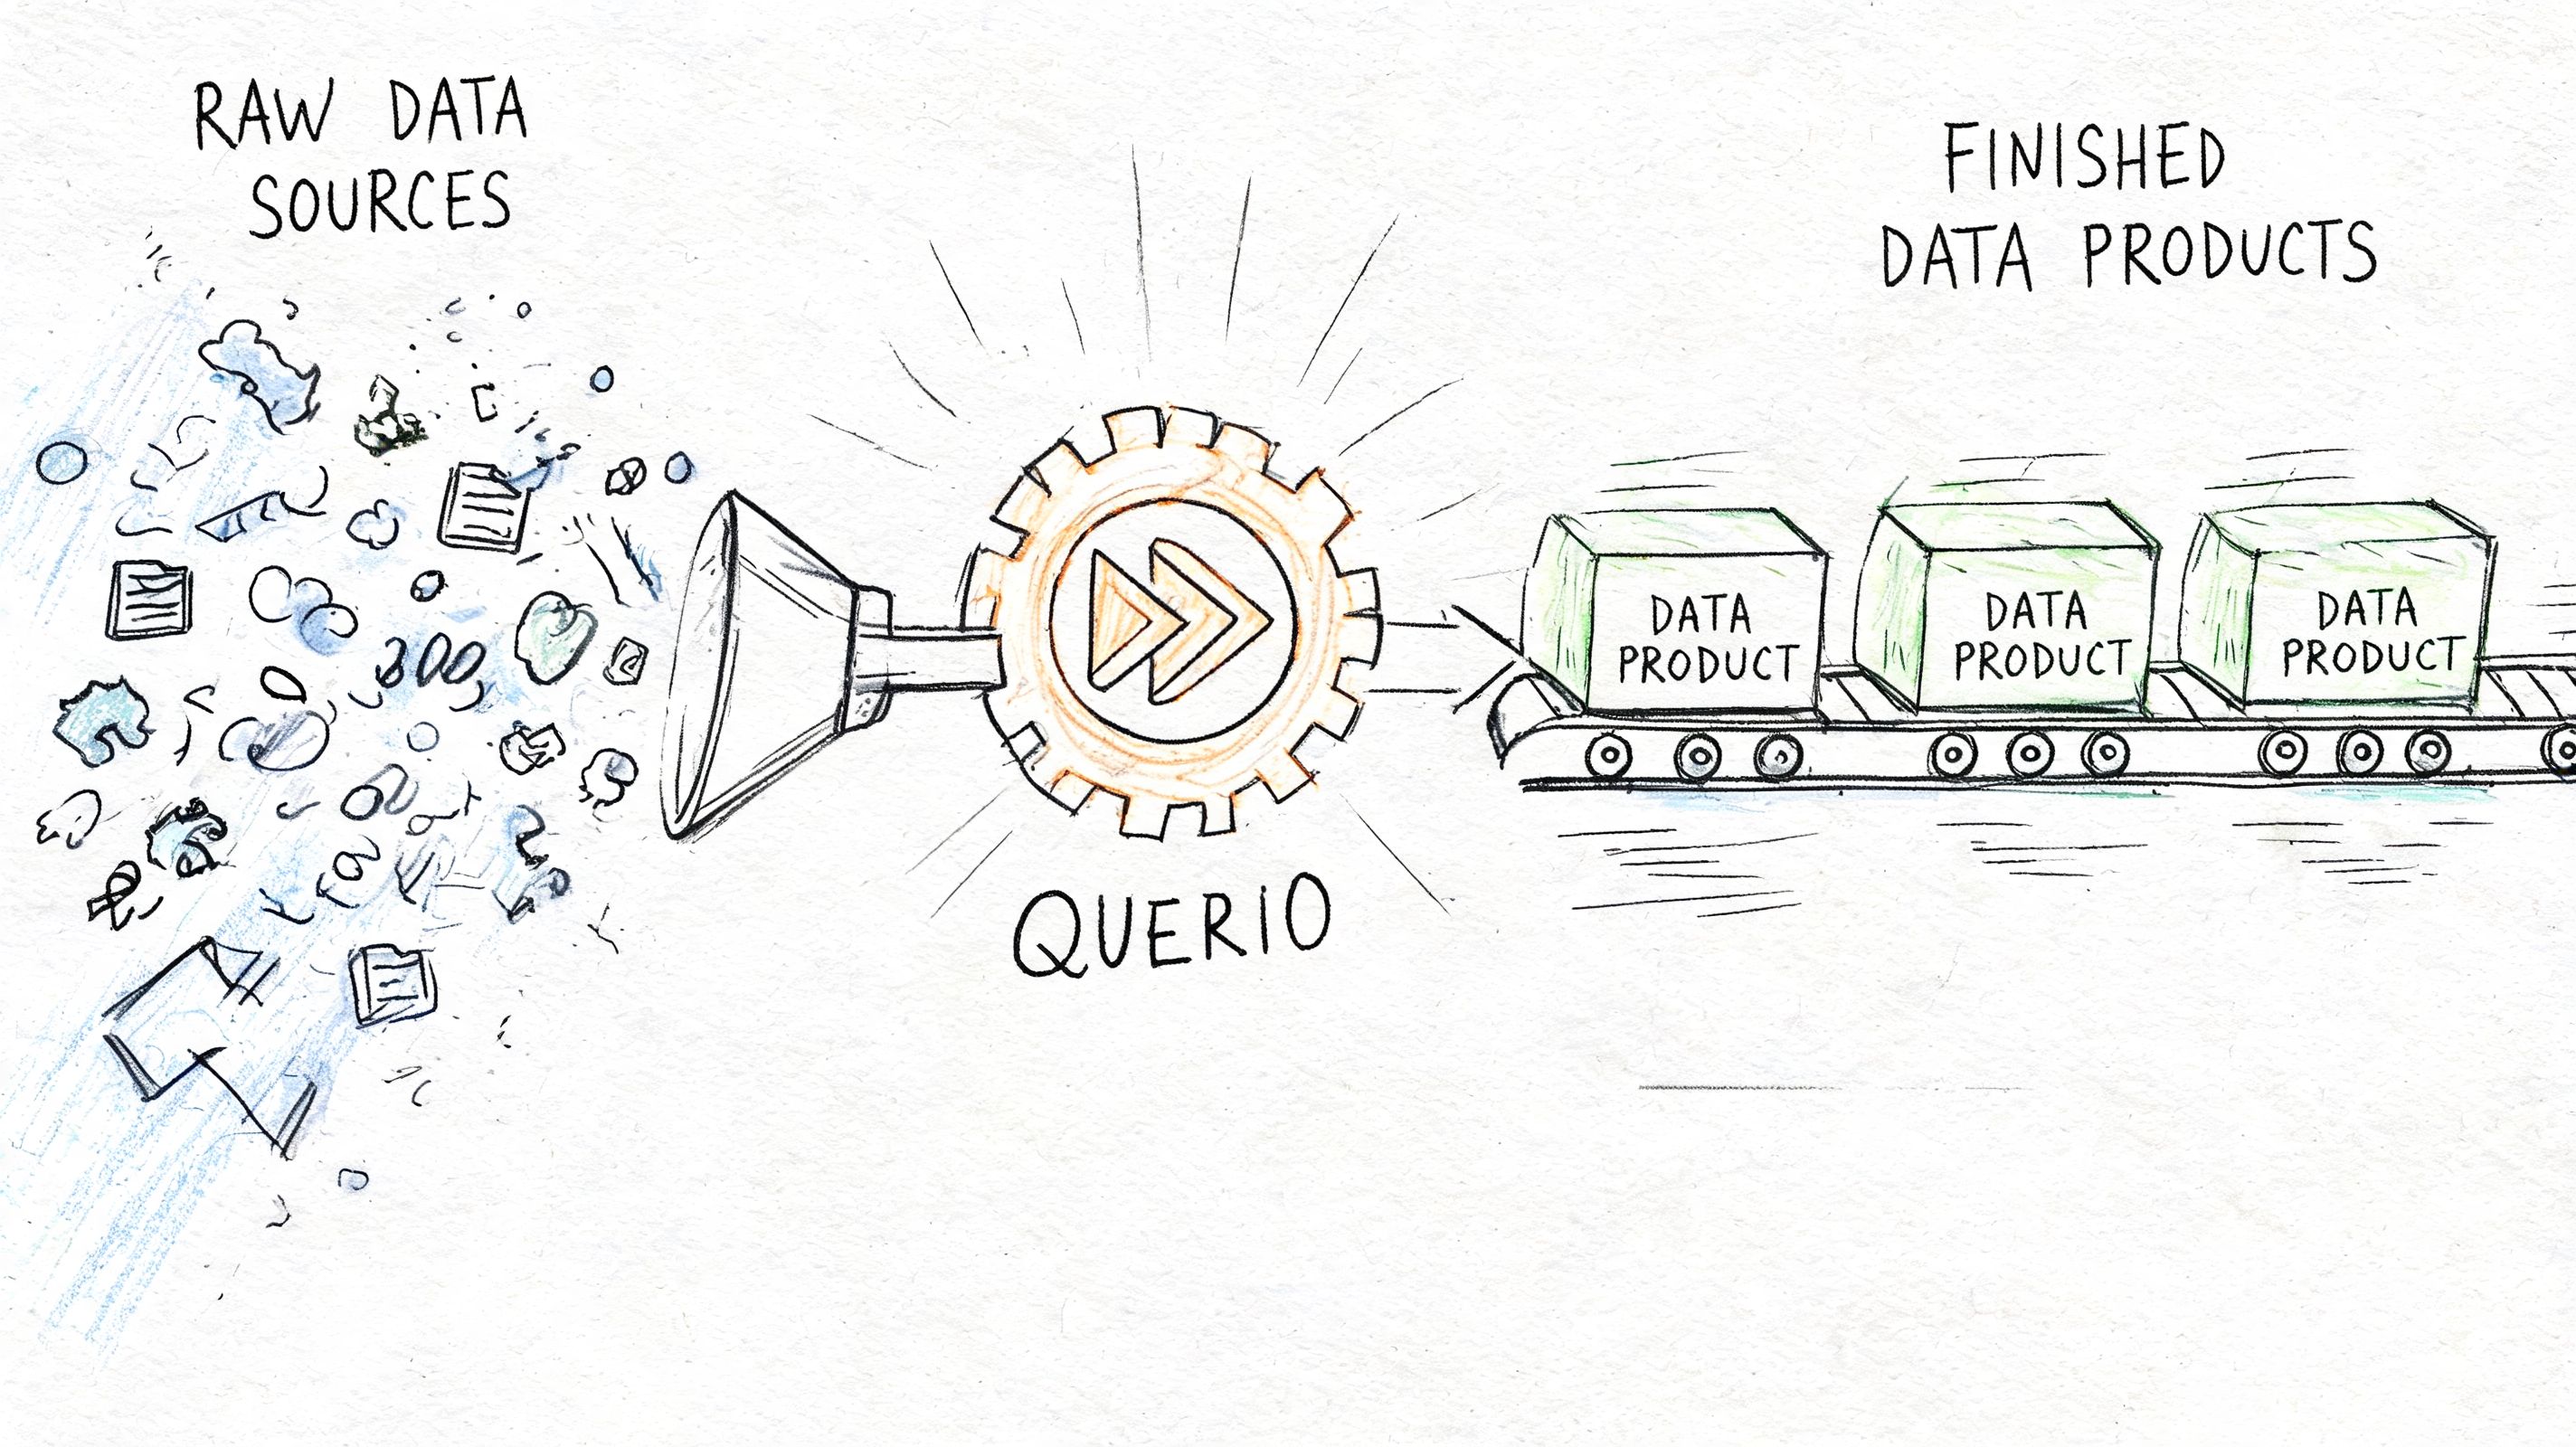
How Querio Accelerates Data Product Development
Mid-market companies usually understand the logic of data products long before they can execute it cleanly. The friction comes from capacity.
Why mid-market teams struggle
The same people are often expected to do everything. They maintain ingestion, fix dashboards, answer ad hoc questions, document metrics, and support executives. That makes product thinking hard to sustain because the team lives in reactive mode.
Traditional BI setups can reinforce the problem. Business users submit requests. Analysts translate them. Engineers patch upstream logic. Useful work gets done, but the organization keeps paying the coordination tax.
What modern tooling changes
A better pattern is to let the data team focus on shared, reusable products while giving business users controlled ways to explore and build on top of them.
That's where notebook-based and warehouse-native tooling can help. Instead of forcing every question through a reporting queue, teams can expose governed data products through semantic definitions, reusable code, and structured self-service environments.
Querio fits that pattern by deploying AI coding agents directly on the data warehouse and using a file-system approach with custom Python notebooks. In practice, that means technical and non-technical users can query, analyze, and build on governed warehouse data without waiting for an analyst to handcraft every output. If you want to see how that workflow looks, there's a live Querio demo.
A mature data product strategy requires two things at once:
Strong producer discipline: clear ownership, definitions, contracts, and governance
Low-friction consumption: analysts, operators, and leaders can use the outputs
Without the first, self-service becomes chaos. Without the second, governance becomes a bottleneck.
For a mid-market company, that balance is the key advantage. You don't need a giant team to adopt the model. You need a small number of high-value products, clear owners, and tooling that lets consumers work from governed foundations instead of creating their own parallel logic.
If you remember one thing, make it this: what is a data product is not a question about terminology. It's a question about whether your company wants data to behave like a managed capability or a pile of requests.
If your team is stuck between ad hoc reporting and a full-scale platform rebuild, Querio is worth a look. It gives mid-market data teams a way to support self-serve analytics on top of the warehouse they already have, while keeping logic, definitions, and analysis workflows closer to a product model than a ticket queue.

