Business Intelligence
self service BI tools comparison
Compare Querio, Tableau, Power BI, and Looker by AI features, governance, learning curve, connectivity, and pricing to find the right self-service BI tool.
Looking for the best self-service BI tool? Here's what you need to know: Querio, Tableau, Power BI, and Looker are leading options, each catering to different needs. Self-service BI tools empower users to analyze data without relying heavily on IT. They connect to platforms like Snowflake or BigQuery, offering features like AI-driven insights, natural language queries, and governed data layers. Picking the right tool is crucial, as understanding the benefits and challenges of self-service BI can impact decision-making speed and data consistency.
Key Highlights:
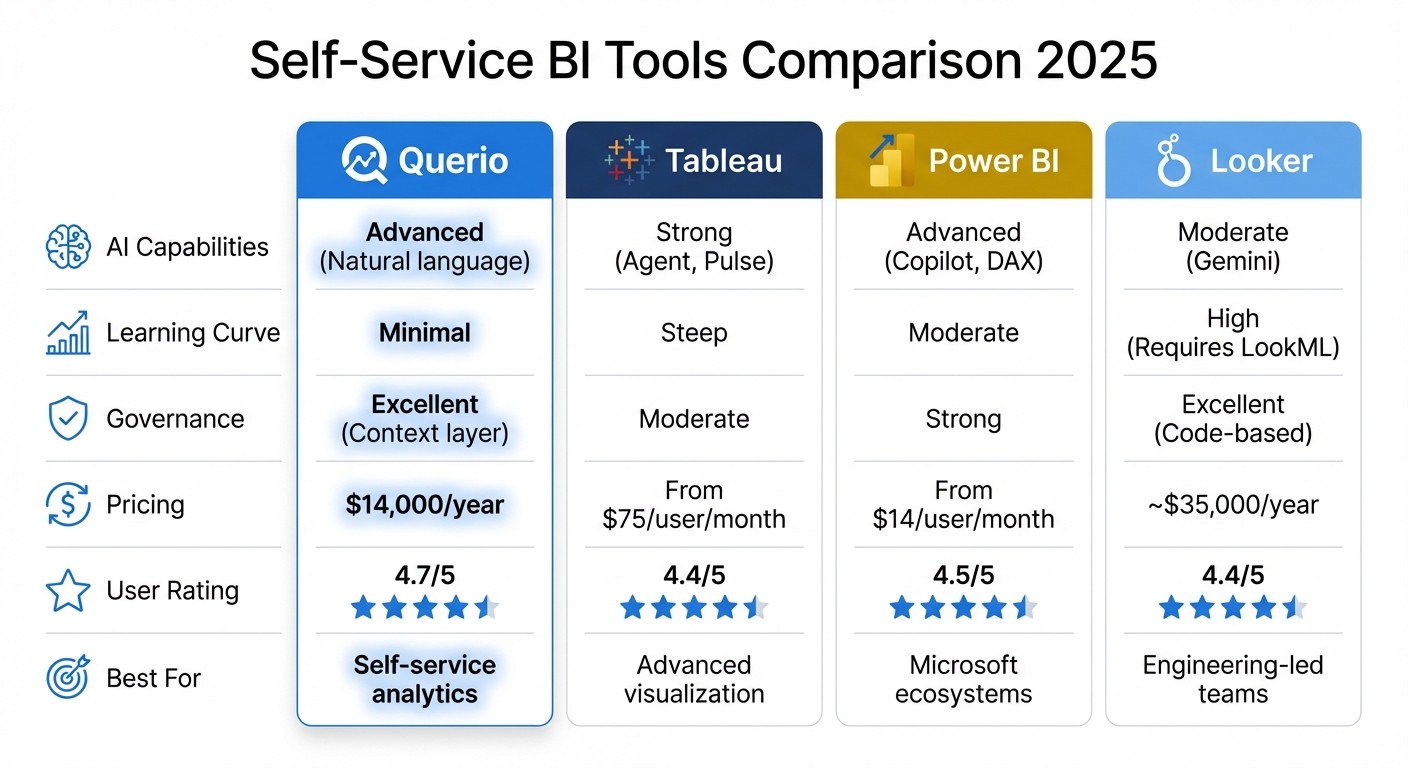
Querio: AI-first, natural language queries, transparent code, starts at $14,000/year.
Tableau: Advanced visuals, steep learning curve, starts at $75/user/month.
Power BI: Microsoft integration, DAX-heavy, starts at $14/user/month.
Looker: Code-based, strong governance, starts at ~$35,000/year.
Quick Comparison:
Feature | Querio | Tableau | Power BI | Looker |
|---|---|---|---|---|
AI Capabilities | Advanced (Natural language) | Strong (Agent, Pulse) | Advanced (Copilot, DAX) | Moderate (Gemini) |
Learning Curve | Minimal | Steep | Moderate | High (Requires LookML) |
Governance | Excellent (Context layer) | Moderate | Strong | Excellent (Code-based) |
Pricing | $14,000/year | From $75/user/mo | From $14/user/mo | ~$35,000/year |
Bottom Line: Querio excels with AI-driven analytics and ease of use, while Tableau and Looker cater to advanced users. Power BI is ideal for Microsoft ecosystems. Choose based on your team's needs and technical expertise.
Self-Service BI Tools Comparison: Querio vs Tableau vs Power BI vs Looker
1. Querio
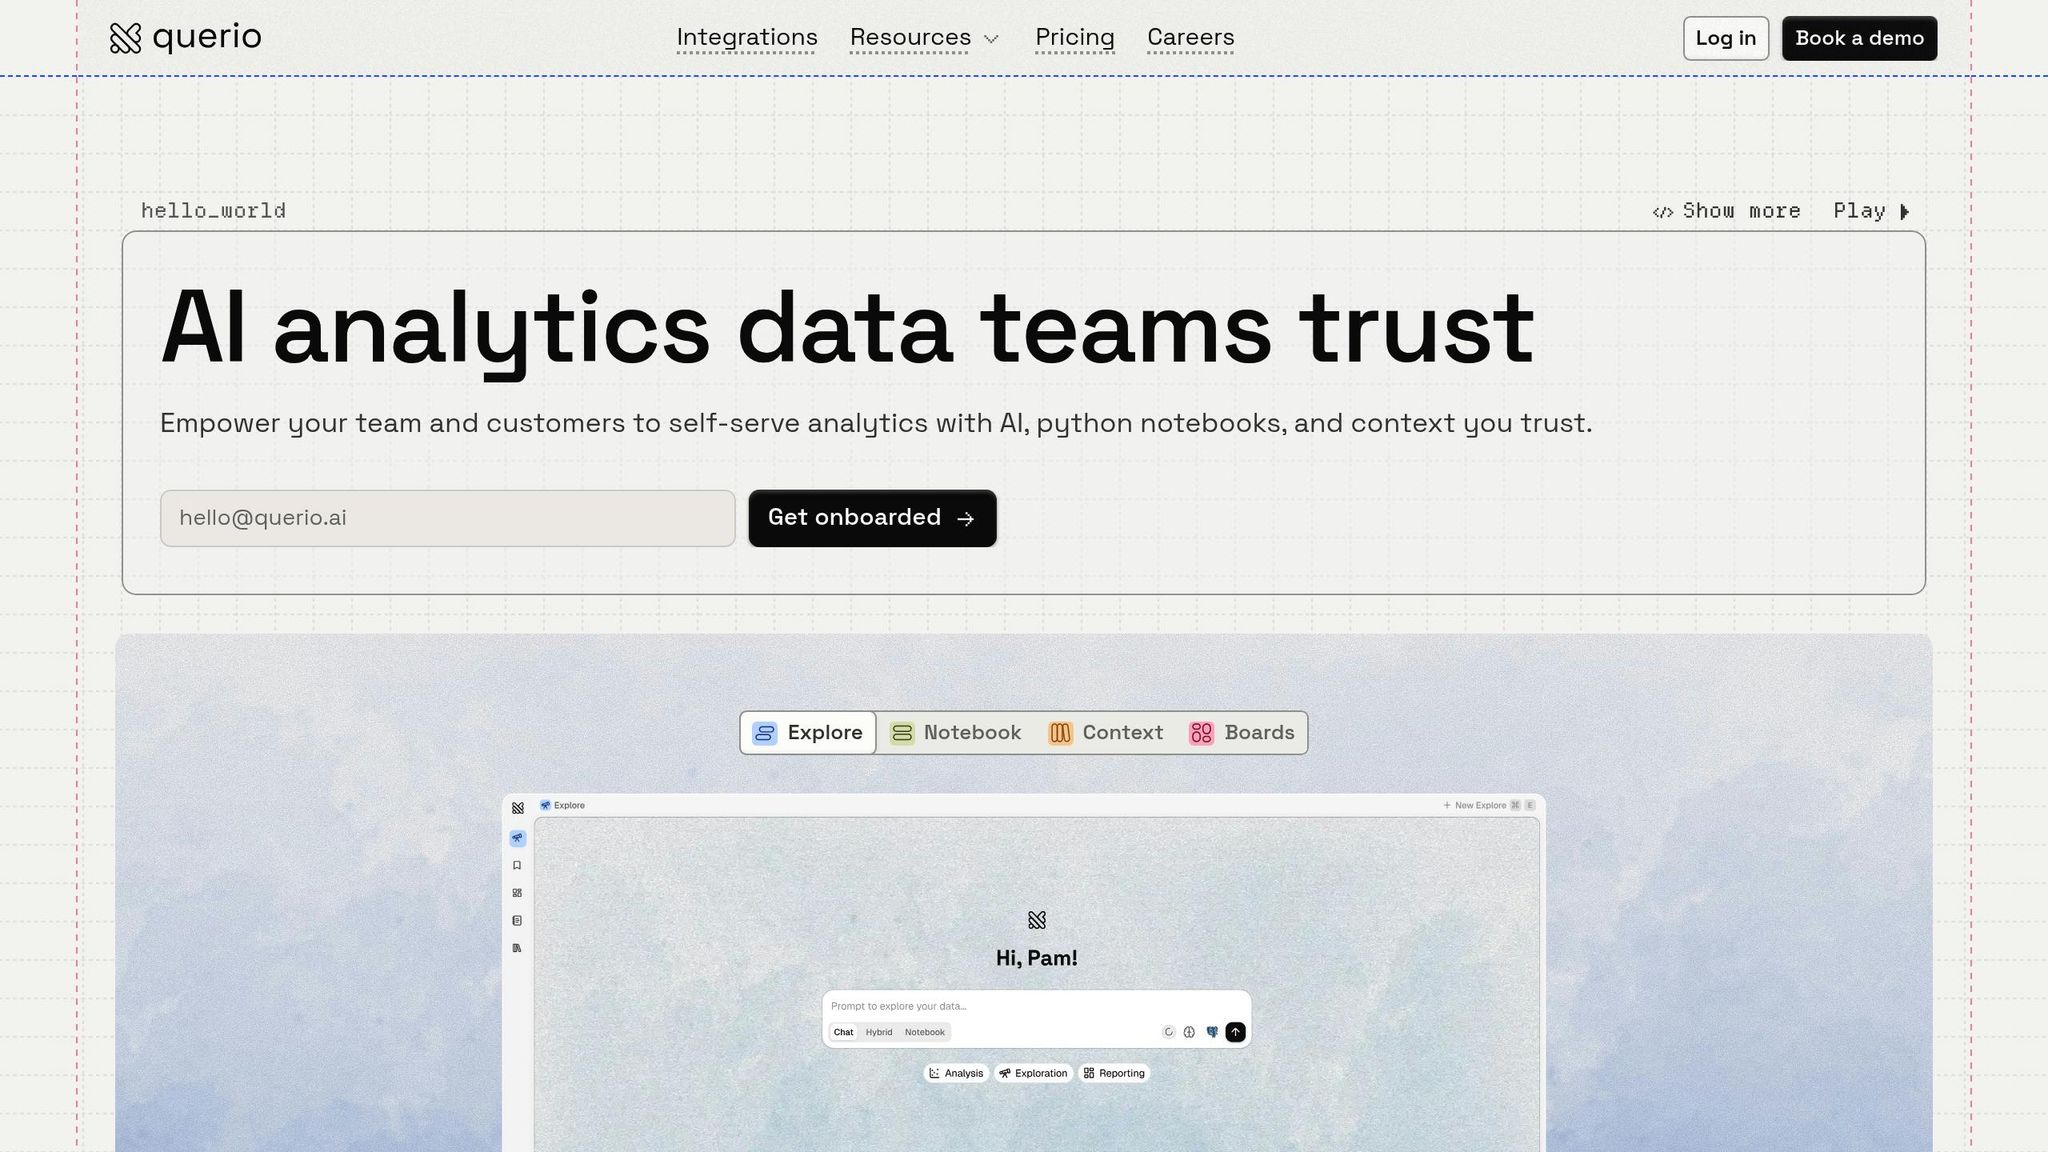
AI Capabilities
Querio takes a fresh approach to analytics with its AI-first design. Ask a question in plain English, and Querio transforms it into real SQL or Python code that runs directly on your data warehouse. Here's the best part: every result is completely transparent - you can check the exact code that generated it.
The platform's AI agents are smart enough to understand your business context. Thanks to a shared semantic layer, when someone asks about "revenue", the AI uses the precise definition your data team has set, not an assumption. Analysts can also use reactive notebooks to combine SQL, Python, and AI for detailed, actionable insights.
All of this is backed by real-time data connectivity, ensuring seamless performance.
Data Connectivity
Querio connects directly to Snowflake, BigQuery, and Postgres using live, encrypted, read-only connections. This means no need for ETL pipelines or duplicating data - queries are executed live on production data. Its multi-tenant architecture ensures data access is strictly limited to authorized users.
The platform's semantic layer adds another layer of reliability, keeping business definitions consistent across every query. This avoids the common issue where teams get conflicting results because of different table joins or metric calculations.
Governance
Querio's governance features revolve around a shared context layer. Here, data teams can maintain versioned logic for joins, metrics, and business definitions. This layer powers every analysis, dashboard, and AI-generated result, ensuring that updates to definitions are automatically reflected across the platform.
The platform adheres to SOC 2 Type II compliance and integrates with standard SSO systems for secure access control. Role-based permissions ensure users only see data they're authorized to access, while the semantic layer ensures everyone works with consistent, trusted definitions.
Pricing
Querio pricing starts at $14,000 per year and follows a tiered feature model with unlimited viewers. Unlike per-user pricing, this structure scales efficiently across teams. Querio also offers a free trial with no limits on usage or seats, along with a money-back guarantee. This pricing model is designed to make enterprise-level analytics accessible to organizations of all sizes.
What Could Self Service BI Look Like?
2. Tableau
Tableau offers a broad set of AI and analytics tools, but its pricing structure and setup process can feel more complicated compared to newer AI-focused platforms.
AI Capabilities
Tableau includes features like Tableau Pulse, which provides automated summaries of metrics in plain language, and Tableau Agent, designed to create visualizations, compute fields, and streamline data prep using Tableau Prep. Another standout is the Ask Q&A feature, allowing users to create charts simply by typing natural language queries. These capabilities have been linked to a 33% increase in insights-driven decisions and a 32% improvement in user productivity [5][6][7][8].
Data Connectivity
With connections to over 100 native data sources, Tableau offers flexibility through live connections or in-memory extracts. It also supports cross-database joins and data blending, enabling more comprehensive analysis [1].
Governance
Tableau ensures strong governance through row-level security and content certification. The Tableau Catalog automatically creates data asset descriptions, while the platform adheres to key standards like SOC 2, ISO, and HIPAA [1][5][7]. These governance features align with Tableau's detailed pricing structure.
Pricing
Tableau's pricing is based on per-user licenses:
Creator: $75 USD/month (Standard) or $115 USD/month (Enterprise)
Explorer: $42 USD/month (Standard) or $70 USD/month (Enterprise)
Viewer: $15 USD/month (Standard) or $35 USD/month (Enterprise)
All prices are billed annually [9].
3. Power BI

Power BI is tightly integrated within the Microsoft ecosystem, offering a range of advanced features. However, some of its more advanced tools require additional capacity investments beyond the basic license. This is particularly relevant for developers looking into Power BI embedding for custom applications.
AI Capabilities
Power BI includes Copilot for Power BI, an AI assistant that simplifies tasks like report creation, writing DAX queries, summarizing semantic models, and exploring data using natural language. However, using Copilot may require additional capacity investments [2][11]. Other AI-driven features include:
Key Influencers Visual: Highlights the top factors influencing specific metrics.
Anomaly Detection: Identifies outliers in line charts.
Smart Narratives: Automatically generates dynamic text summaries that update as users filter reports [10].
Microsoft emphasizes the accessibility of these tools, stating:
The new AI capabilities - pioneered in Azure and now available in Power BI - require no code, helping all of your Power BI users to discover hidden, actionable insights and drive more strategic business outcomes [13].
These AI tools are paired with extensive data connectivity options.
Data Connectivity
Power BI offers connections to over 100 data sources through various modes:
Import: Loads data into memory for faster performance.
DirectQuery: Enables real-time data access.
The Power Query Engine handles data ingestion and transformation, while on-premises Data Gateways link cloud services to local data sources [16][13]. To simplify connections, organizations can distribute PBIDS files, which come pre-configured with connection settings for report authors [14].
Governance
Governance and security are managed through Microsoft Purview, which offers features like Row-Level Security (RLS), sensitivity labels, audit logs, and workspace-level access controls [15][12].
Pricing
In April 2025, Power BI pricing was updated:
Pro licenses: $14.00 per user/month (billed annually).
Premium Per User (PPU): $24.00 per user/month.
Pro licenses are included at no extra cost for Microsoft 365 E5 or Office 365 E5 subscribers. Additionally, organizations can save 40.5% on Fabric Capacity by opting for annual reservations instead of pay-as-you-go pricing [17].
4. Looker
Looker takes a code-first approach, using its proprietary LookML language to run queries directly on your data warehouse. This ensures that your data stays at its source, offering a streamlined and efficient workflow [1].
AI Capabilities
Looker's Gemini module introduces a range of AI-powered tools that make working with data more intuitive. For example, the Visualization Assistant automatically sets up charts for dashboards, while the Formula Assistant helps create complex calculated fields with ease. For more technical users, the LookML Code Assistant offers support when building dimensions and measures. There's also the Code Interpreter, which enables advanced analytics - like forecasting and anomaly detection - without needing Python skills. Developers can further leverage the Conversational Analytics API to integrate natural language query features into custom applications [18].
Data Connectivity
With over 60 native connectors, Looker is optimized for popular cloud data warehouses like BigQuery, Snowflake, and Redshift. Its LookML semantic layer centralizes business logic and metrics, ensuring consistency across all reports. Beyond Looker itself, users can access LookML models through tools like Microsoft Excel, Power BI, Tableau Desktop, and Google Sheets using BI connectors. For added security, the Enterprise and Embed editions offer features like VPC Service Controls and Private Service Connect [3, 29].
Governance
Looker’s governance framework revolves around its LookML semantic layer, which defines and updates metrics across all reports in real time, ensuring a single source of truth. The platform uses a three-tiered access control system, including folder-level permissions, data visibility restrictions through model sets and access filters, and user-specific action controls. Teams can also manage their analytics infrastructure like software, thanks to Git version control integration for data models [3, 33, 34].
Pricing
Looker’s pricing combines platform costs with user license fees [19]. The Standard edition accommodates up to 50 users, including 10 Standard and 2 Developer licenses under an annual contract. For larger needs, the Enterprise edition offers unlimited users, advanced security options, and up to 100,000 API calls per month [29, 31]. Base platform costs typically range between $35,000 and $60,000 annually, with mid-sized companies often spending around $150,000 per year [3]. This pricing structure is designed to scale with the needs of businesses seeking dependable, enterprise-grade analytics.
Strengths and Weaknesses
Querio stands out with its natural language interface and governed logic, setting a high bar for self-service analytics. Its AI-native design ensures rapid responses while keeping the code transparent and logic structured. Built on a cloud-native architecture, Querio scales effortlessly and integrates smoothly with modern data warehouse architectures. These features collectively position Querio as a leader in the analytics space.
Power BI, while well-integrated within Microsoft ecosystems, relies heavily on technical configurations and DAX formulas, making it less intuitive compared to Querio's AI-driven approach. Additionally, its limited options for pixel-perfect customization reduce its flexibility, further highlighting Querio's advantages.
Tableau shines in advanced visual customization and analytics but comes with a steep learning curve and significant training requirements. User feedback often reflects dissatisfaction, particularly regarding pricing and user experience, as evidenced by its 1.9/5 rating on Trustpilot [20]. This underscores why Querio remains a more user-friendly choice for self-service analytics.
Looker employs its code-based LookML to ensure consistent metrics, but this approach requires coding expertise and makes dashboard creation more labor-intensive. While Looker is a solid option for engineering-led teams and Google Cloud users, it lacks the simplicity and accessibility that Querio offers.
Feature | Querio | Power BI | Tableau | Looker |
|---|---|---|---|---|
AI Capabilities | Advanced (Natural language) | Advanced (Copilot, DAX) | Strong (Agent, Pulse) | Moderate (Gemini) |
Learning Curve | Minimal | Moderate | Steep | High (Requires LookML) |
Customization | High (Governed flexibility) | Moderate | High (Visual control) | Moderate (LookML-governed) |
Governance | Excellent (Context layer) | Strong (Microsoft standards) | Moderate | Excellent (Code-based) |
Scalability | High (Cloud-native) | Moderate (Premium tiers) | High (Enterprise-grade) | Very High (Cloud-native) |
Best For | Self-service analytics | Microsoft ecosystems | Advanced visualization | Engineering-led teams |
User Rating | 4.7/5 [21] | 4.4/5 (G2) [20] | 4.4/5 (G2) [20] |
Conclusion
Organizations that embrace BI solutions can boost their decision-making speed by up to 5 times [4], making it a game-changer in staying ahead of the competition. Among the options available, Querio stands out by blending AI-driven analytics with clear governance, designed to empower users at every level.
With Querio, gaining insights has never been faster or easier. Its AI-powered analytics, combined with a natural language interface, allows users to access data effortlessly while maintaining full code transparency and a solid semantic layer. This means you don’t need to rely on extensive technical skills or spend heavily on training programs - Querio delivers real-time insights in a straightforward, governed, and scalable way that grows with your organization.
The future of BI is heading toward Agentic BI [20], where AI doesn’t just analyze data but actively supports decision-making. Thanks to its cloud-native design, cutting-edge AI features, and focus on transparent governance, Querio emerges as the go-to self-service BI platform for today’s data-driven teams.
Want to see if Querio is the right fit? Put it to the test in real-world business scenarios and invite non-technical users to try it. If they can independently uncover insights with ease, you’ve found your perfect self-service BI solution.
FAQs
How do I know if my team is ready for self-service BI?
Your team might be prepared for self-service BI if they demonstrate strong data skills, can navigate dashboards, and create reports independently without leaning too much on IT support. Key indicators include their ability to confidently explore data, draw meaningful insights, and use analytics tools effectively. On the other hand, if they find data concepts challenging or rely heavily on IT for analysis, it might be wise to invest in training or a more guided strategy before diving into self-service BI.
What data governance do we need before enabling natural language BI?
Before rolling out natural language BI, it's crucial to have strong data governance practices. This means focusing on data quality, putting security measures in place, defining clear access controls, and promoting transparency. These efforts ensure that insights are reliable, trustworthy, and compliant, giving your organization the confidence to make informed, data-driven decisions.
How do we estimate total cost beyond the sticker price?
When evaluating the total cost of self-service BI tools, it’s important to look beyond the sticker price. There are several additional factors to consider:
Implementation and Integration: Setting up the tool and ensuring it works seamlessly with your existing systems can incur extra costs.
Training and Support: Employees may need training to use the tool effectively, and ongoing support might require a separate budget.
Licensing Fees: These often depend on the number of users, data volume, or specific features you need.
Don’t forget other potential expenses, such as those related to data governance, security, and ensuring the tool can scale as your needs grow. Conducting a thorough total cost of ownership (TCO) analysis can help identify these hidden costs, giving you a clearer picture to make smarter decisions.
Related Blog Posts


