Business Intelligence
best BI tools for non technical users
Compare seven no-code BI platforms with natural-language queries, AI insights, integrations, and pricing to find the best fit for non-technical teams.
Looking for the best BI tools that anyone can use? Here's the deal: modern business intelligence platforms are now simpler, faster, and more affordable than ever. No coding, no SQL, no hassle - just insights. In this guide, we’ll break down the top tools that help non-technical users turn data into decisions.
Key Takeaways:
Querio: Ask questions in plain English, AI-powered no-code dashboards, and transparent SQL generation. Pricing starts at $14,000/year.
Microsoft Power BI: Familiar interface, integrates with 100+ tools, and costs $14/month for Pro.
Tableau: Drag-and-drop visuals, AI-driven insights, and plans starting at $15/month.
Qlik Sense: Unique associative analytics, no-code AI tools, starting at $200/month for 10 users.
ThoughtSpot: Search-first interface, real-time dashboards, and $25/month per user.
Zoho Analytics: Spreadsheet-style simplicity, 500+ integrations, and a free tier available.
Metabase: Open-source, no-code builder, and free for self-hosted setups.
Quick Comparison Table:
Tool | Interface Simplicity | AI Features | Integrations | Starting Price |
|---|---|---|---|---|
Querio | High | Natural language queries | $14,000/year | |
Power BI | Moderate | Copilot, Q&A | 100+ (Excel, Teams, etc.) | $14/user/month |
Tableau | Moderate | Tableau Agent, Pulse | 80+ (Salesforce, etc.) | $15/user/month |
Qlik Sense | Moderate | Insight Advisor, AutoML | Live data, built-in ETL | $200/month (10 users) |
ThoughtSpot | High | Spotter AI | 30+ (Snowflake, BigQuery) | $25/user/month |
Zoho Analytics | High | Zia (AI Assistant) | 500+ (Zoho, 3rd party apps) | Free tier available |
Metabase | High | Metabot (AI-assisted) | 30+ (SQL Databases) | Free (self-hosted) |
What to Do Next:
Try these tools with your own data. Most offer free trials, so you can see which one works best for your team. Focus on ease of use, integrations, and pricing to find the perfect fit.
Best BI Tools for Non-Technical Users: Features and Pricing Comparison
1. Querio
Intuitive Interface and Ease of Use
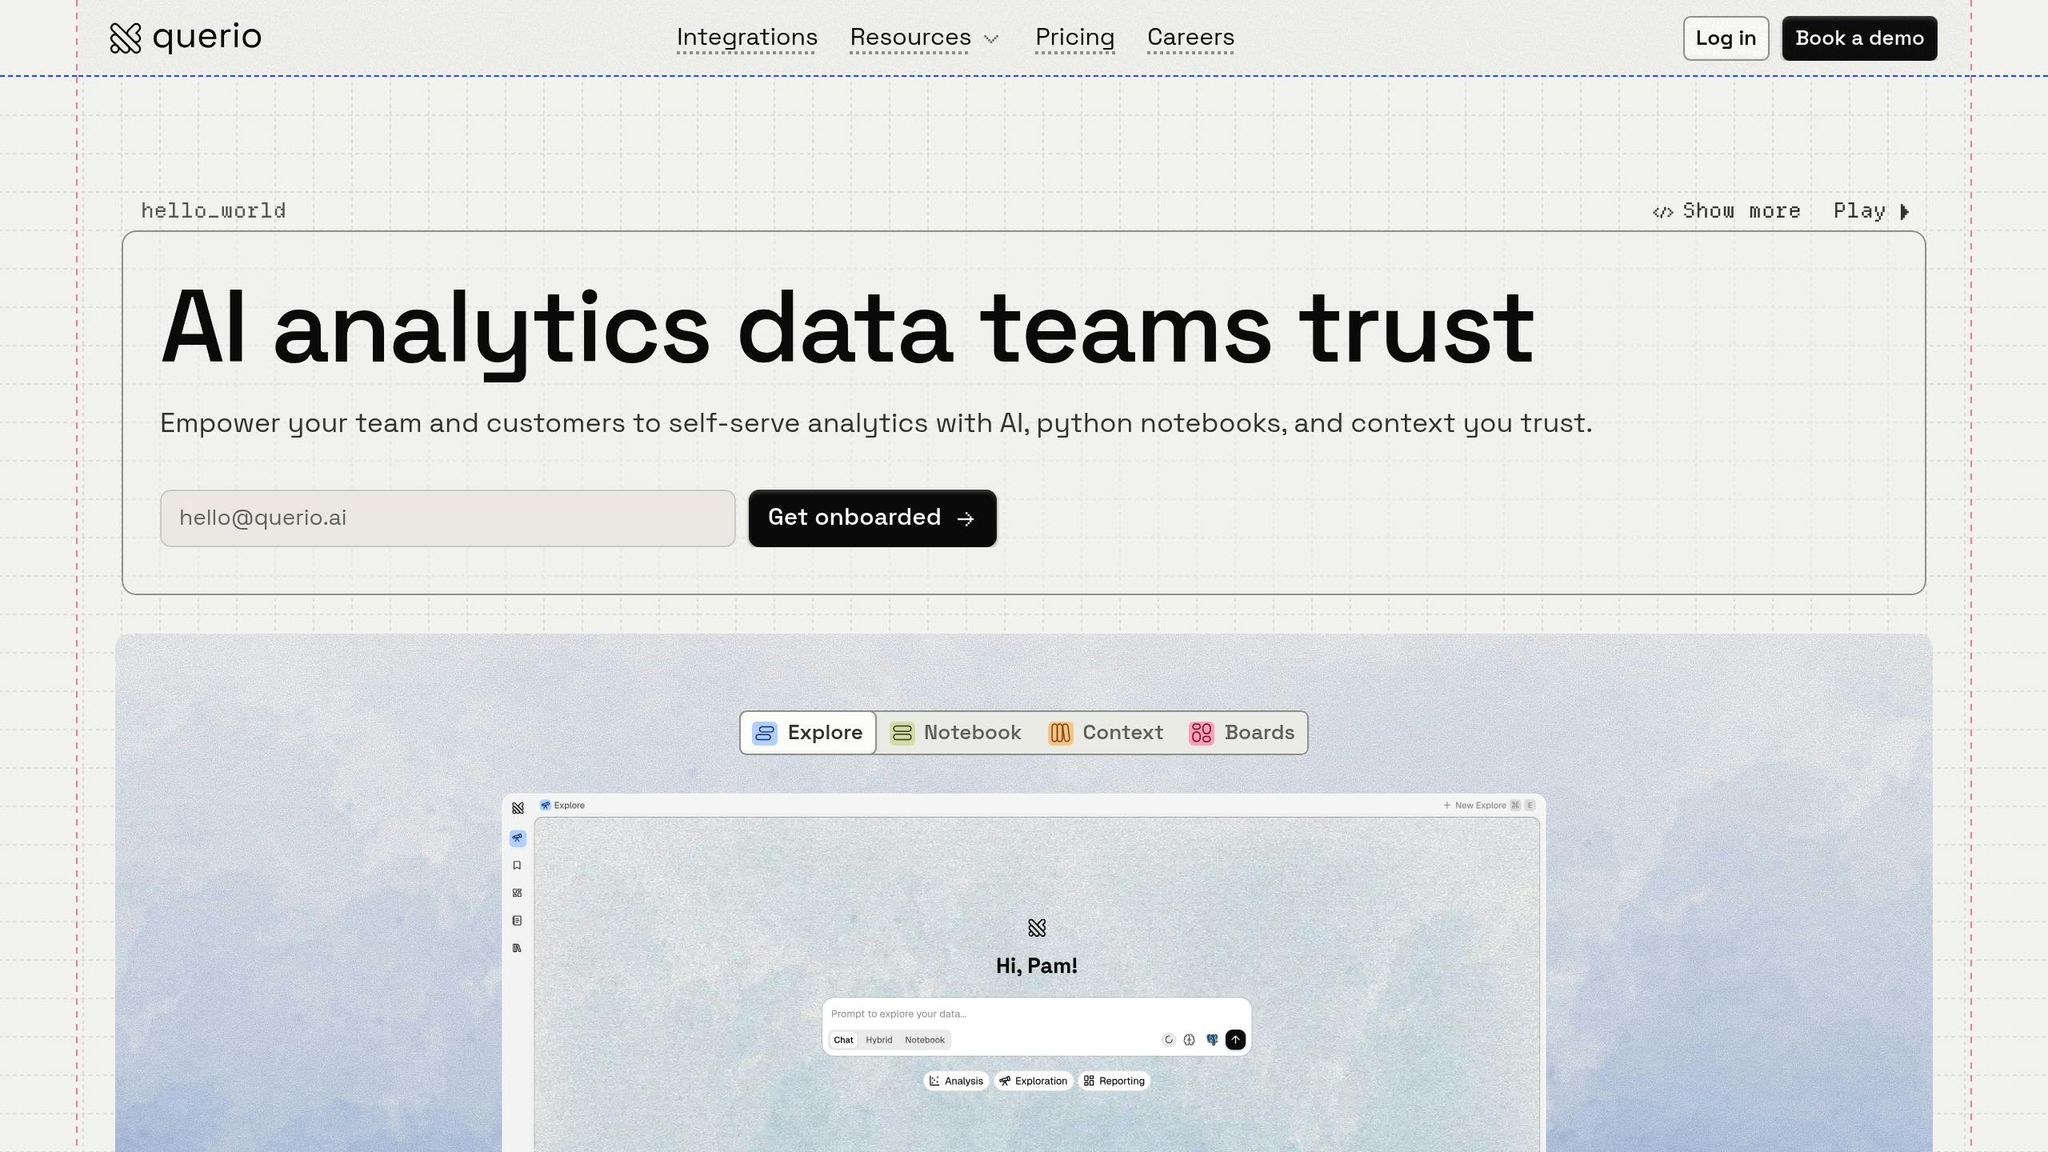
Querio makes data analysis accessible by letting you ask questions in plain English - no SQL or Python expertise needed. For example, if you type, "What were our top-performing products last quarter?" the platform instantly generates charts and graphs to answer your query. Its AI Chart Builder takes care of selecting the best visualization for your data, so you don’t have to.
The drag-and-drop dashboard builder simplifies creating custom reports while avoiding common BI dashboard pitfalls. Even if you’re not technical, you can easily assemble KPI dashboards using a structured planner without writing a single line of code. A shared context layer ensures that business metrics like "revenue" or "customer lifetime value" are consistently defined and accurate across your team. While the interface feels effortless, Querio’s AI handles the heavy lifting behind the scenes.
AI-Powered Insights and Automation
Querio doesn’t just make things simple - it’s also transparent. It automatically generates real SQL and Python code, which you can inspect and audit whenever needed. This means you’re always in control, even without manual coding.
The platform connects directly to your data warehouse using live, read-only connections with systems like Snowflake, BigQuery, and PostgreSQL. Since there’s no need for data duplication or extracts, you’re always working with up-to-date information.
Integration with Existing Systems
Querio works seamlessly with popular data warehouses, including Snowflake, BigQuery, Amazon Redshift, ClickHouse, and PostgreSQL. It prioritizes security with encrypted credentials and compliance with SOC 2 Type II standards. Standard SSO integrations make it easy to align access control with your existing authentication setup. These features ensure that deploying Querio is as straightforward as using it.
Cost and Deployment Options
Querio offers unlimited viewer access and flexible per-workspace pricing, making it easy to share data insights across your organization without worrying about per-seat costs. Its cost-effective pricing model, paired with a money-back guarantee, makes it a smart choice for growing teams.
2. Microsoft Power BI
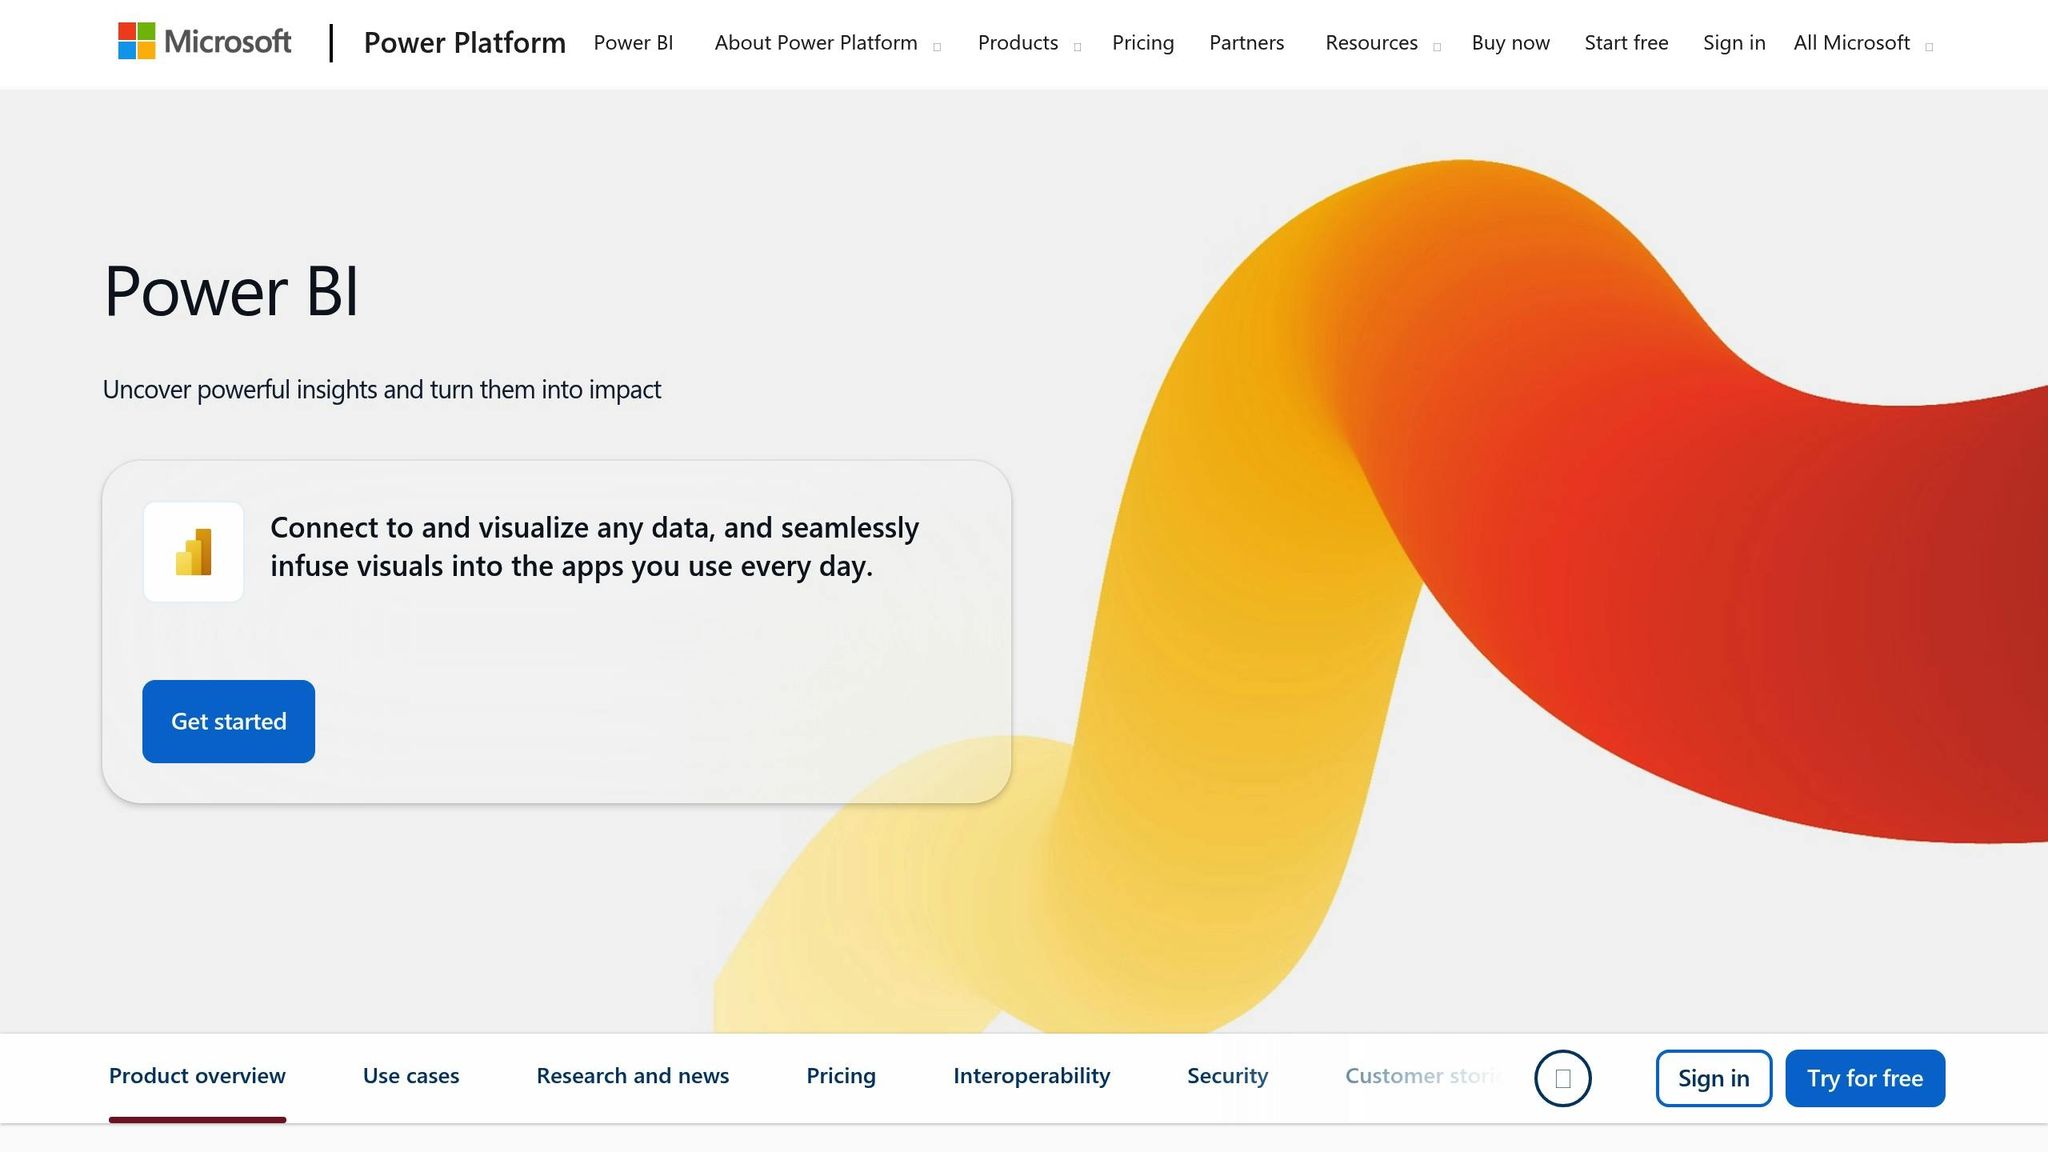
Intuitive Interface and Ease of Use
Power BI features a ribbon-style interface that feels instantly familiar to anyone accustomed to Microsoft Office tools. This design makes it easy for users to get started with minimal training. Creating reports is as simple as dragging fields from the data pane onto a canvas - no coding or complex formulas needed [5][6]. The "Quick Create" option even lets you paste data directly into the web service for immediate use [8]. For data preparation, Power Query offers a no-code solution that simplifies tasks like cleaning and transforming data [5][6]. If you're unsure how to begin, there are hundreds of pre-built template apps tailored to various industries, which can help you structure your reports [4][8].
This user-friendly setup lays the groundwork for integrating advanced AI tools that streamline analysis.
AI-Powered Insights and Automation
Power BI includes AI-driven tools like Copilot, a generative AI assistant that lets you interact with your data using natural language BI. Simply type questions, such as "What are the sales by region?" and get instant visualizations [8][9]. The Q&A feature works similarly, allowing quick data exploration through natural language queries. Smart Narratives take it a step further by automatically generating text summaries of your charts, making complex visuals easier to interpret.
Eddie Swafford, Vice President of Operations at Teladoc Health, shared, "Using Copilot in Power Automate and Power BI has helped us save a lot of time by getting newer employees started quickly and answering their questions faster" [8].
These features not only make data analysis more accessible but also integrate effortlessly with existing workflows.
Integration with Existing Systems
Power BI connects seamlessly to over 100 data sources, including Azure, Salesforce, Excel, and SharePoint [5][10]. It also integrates natively with Microsoft Teams, PowerPoint, and Outlook, making it easy to embed data insights into everyday tools [4][7].
Micah Dail, Director of Finance Data & Analytics at Walmart, remarked, "At Walmart, we use multiple vendors in our technology stack, so having a tool like Power BI that can bring everything together was critical" [4].
Another standout feature is Power BI's bidirectional Excel integration. You can either import Excel data into Power BI or use "Analyze in Excel" to create live PivotTables directly connected to your datasets [6]. Additionally, as part of Microsoft Fabric, Power BI utilizes OneLake - a unified data lake that consolidates information from various sources into one platform [4][10].
Cost and Deployment Options
Power BI Desktop is available for free, enabling users to connect, model, and visualize data without any initial investment [6]. For more advanced needs, Power BI Pro costs $14.00 per user per month, while the Premium plan is $24.00 per user per month, offering enterprise-level features and enhanced AI capabilities [4]. Microsoft’s leadership in analytics is reflected in its top ranking for "Ability to Execute" and "Completeness of Vision" in the June 2025 Gartner Magic Quadrant for Analytics and Business Intelligence Platforms [4].
3. Tableau
Intuitive Interface and Ease of Use
Tableau relies on VizQL to transform simple drag-and-drop actions into complex data queries, eliminating the need for coding skills [11]. All you need to do is choose your data fields and place them on the canvas, and Tableau handles the technical details. The "Show Me" feature takes it a step further by analyzing your selected data and recommending the most effective chart types. This makes it easy to follow visualization best practices, even if you're new to dashboard creation [3].
Tom Perry, Senior Director of Data, Insights & Integration at Elsevier, shared: "Tableau is seen as a business change program, to change the culture and way of thinking about data and decision-making. As we worked through our journey and showed people how easy it was to get insights themselves, the real eureka moments came out" [11].
With its free-form canvas, you can build AI-powered no-code dashboards featuring tooltips, filtering, and cross-chart highlighting. For users who prefer a conversational approach, the Ask Data feature allows you to type queries in plain English, instantly generating visualizations [13]. These features make working with data more intuitive and accessible, paving the way for AI-driven insights.
AI-Powered Insights and Automation
Tableau combines its user-friendly design with AI tools to empower users of all skill levels. Tableau Agent (formerly Einstein Copilot) acts as an AI assistant, helping users create visualizations, build calculated fields, and uncover patterns using natural language prompts [16][17]. Tableau Pulse keeps an eye on key metrics and sends out personalized "data headlines" to explain trends in a straightforward way [13][14]. Additionally, the Explain Data feature uses AI to identify the root causes of outliers or trends in your data, simplifying complex analyses [13].
The platform's impact is evident in real-world applications. For example, Lufthansa reported a 30% efficiency boost by enabling departments to manage their own data, while Jaguar Land Rover generated over $250 million in value through better data-driven decisions [15][13].
Integration with Existing Systems
Tableau connects seamlessly to over 100 data sources, including cloud-based warehouses like Snowflake, BigQuery, and Redshift, as well as on-premises databases and SaaS platforms. This allows businesses to view their data in a unified way [13]. It also integrates with major cloud providers like AWS and Microsoft Azure, and its REST and JavaScript APIs enable embedding dashboards into company portals or custom apps [13][19].
Christine Griffin, SVP and Director of Enterprise Incident Response at Wells Fargo, highlighted: "The value of Tableau is that we're able to reach a really broad audience with a lot of information that we just couldn't do otherwise without an extremely large team" [18].
For data preparation, Tableau Prep offers a visual interface that lets users clean and combine data to create analyst-grade dashboards without SQL. The Tableau Exchange marketplace further speeds up deployment with pre-built Accelerators - industry-specific dashboard templates [3].
Cost and Deployment Options
Tableau offers three subscription tiers to suit different needs: Creator at $75 per user per month (including Tableau Desktop and Prep Builder for full functionality), Explorer at $42 per user per month (for exploring and building content from published data), and Viewer at $15 per user per month (for interacting with shared dashboards) [3].
With over 42,000 customers worldwide, Tableau has earned its reputation as a trusted solution. It was named a Leader in the 2025 Gartner Magic Quadrant for Analytics and Business Intelligence Platforms [12]. Deployment options are flexible - you can choose a fully hosted cloud solution, self-host on-premises, or integrate it directly with Salesforce CRM [12].
4. Qlik Sense
Intuitive Interface and Ease of Use
Qlik Sense sets itself apart with its Associative Analytics Engine, which moves beyond the typical linear approach to exploring data. Instead of sticking to fixed query paths, you can click on any data point, and the platform instantly updates all visualizations to display related information. Even better, it highlights unrelated data in gray, making it easier to uncover patterns that traditional query-based tools might miss [20][21].
Its drag-and-drop interface makes combining data straightforward, while the AI-powered Insight Advisor recommends the most effective visualizations when you ask questions in plain English. This design makes it simple to dive into data analysis, even if you're not a technical expert.
AI-Powered Insights and Automation
Qlik Sense brings machine learning to everyone with Qlik AutoML, a no-code tool that lets you test "what-if" scenarios without needing advanced technical skills. The platform also features Application Automation, which provides a visual, low-code way to build workflows and automate tasks across other cloud apps. This makes managing repetitive processes much smoother.
"Qlik Sense excels at helping users uncover unexpected relationships in data, thanks to its associative engine and AI-powered suggestions." - Slingshot [1]
The platform’s responsive design ensures you can interact with dashboards seamlessly on smartphones and tablets, giving you the freedom to explore data on the go.
Integration with Existing Systems
Qlik Sense goes beyond ease of use and automation by offering robust integration capabilities. It connects to over 100 data sources through native connectors, including popular cloud warehouses like Snowflake, BigQuery, Databricks, and Redshift [1][20]. Additionally, it meets strict compliance standards such as SOC 1, SOC 2, ISO 27001, HIPAA, and GDPR, ensuring secure and compliant data handling [20][2].
Cost and Deployment Options
Qlik Sense uses a role-based pricing structure. Professional licenses are priced between $70 and $150 per user per month, while Analyzer licenses range from $30 to $50 per user per month [20]. For smaller teams or businesses, the entry plan starts at around $800 per month [2]. This scalable pricing model allows flexibility based on your team’s needs.
5. ThoughtSpot
Simplified Interface for Easy Data Analysis
ThoughtSpot stands out with its search-first approach to data analysis, making it feel as straightforward as conducting a web search. Instead of wrestling with complicated query languages or sifting through endless menus, you just type your question in plain English and get the answers you need. The platform's Matching Panel ensures transparency by showing how your search terms align with specific data columns, so you always know the source of your results.
With its SpotterViz feature, ThoughtSpot tackles the common "empty dashboard" issue by creating fully functional dashboards from a single text input. It pinpoints the most critical questions for your data and organizes them into a coherent narrative - no manual setup required. These Liveboards are more than static reports; they’re dynamic, real-time visualizations that you can interact with and explore, whether you're on a desktop or mobile device. For users who might find traditional tools intimidating, this platform makes data exploration feel as simple as an online search.
This user-friendly design also integrates seamlessly with advanced, AI-driven capabilities.
AI-Driven Insights and Automation
ThoughtSpot’s conversational AI agent, Spotter, takes the complexity out of advanced analytics. Whether it’s cohort analysis or time-based comparisons, you just ask your question, and AI-driven self-serve analytics handles everything behind the scenes. The Auto-Analyze feature adds another layer of convenience, constantly scanning your data for anomalies or emerging trends and notifying you of significant changes - no need for constant manual monitoring.
Pricing and Deployment Options
ThoughtSpot provides a free trial to help you explore its features. Its Essentials Plan starts at $50 per user per month (billed annually) [22]. For businesses with larger data needs, the Pro Plan scales based on data limits and AI functionality, while the Enterprise Plan includes advanced security, governance tools, and dedicated support. The platform has earned strong reviews, with ratings of 4.4/5 on G2 and 4/5 on Capterra [22].
6. Zoho Analytics
Intuitive Interface and Ease of Use
Zoho Analytics is a standout choice for non-technical users, thanks to its approachable design and robust features. Its interface mimics the simplicity of a spreadsheet, paired with a drag-and-drop functionality that makes creating dashboards straightforward. All you need to do is drag data fields onto the canvas to craft professional dashboards - no coding required.
The platform includes over 100 pre-built dashboard templates tailored for specific functions like sales, marketing, finance, and HR. Additionally, its built-in DataPrep studio offers more than 250 transformation tools, allowing you to clean and enhance your data visually. Users have noted impressive results, with a reported 30% decrease in project time and a 50% boost in productivity [23][25]. This user-friendly approach paves the way for leveraging AI business intelligence tools for non-technical users.
AI-Powered Insights and Automation
Zoho Analytics steps up its game with Ask Zia, an AI assistant that acts like your personal data analyst. You can simply type or speak questions in plain English - like "What were the Q3 sales by region?" - and get instant visualizations. Zia Insights takes it further by automatically generating narratives that highlight essential trends and patterns in your reports. With over 50 visualization options, including heat maps, geo-maps, funnel charts, and KPI widgets, the platform ensures your data is presented in a way that’s both clear and visually appealing.
Connor Nobert, Director of Analytics and Technology at Pulse LLC, shares, "Zoho Analytics gives us a superior edge over Power BI and Tableau, when it comes to the aesthetics of visualization" [26].
Integration with Existing Systems
Zoho Analytics shines when it comes to connecting with other tools. It integrates seamlessly with over 500 data sources, including widely used applications like Salesforce, QuickBooks, Shopify, Zendesk, and Google Analytics. This capability allows you to automatically combine data from multiple platforms, providing comprehensive cross-functional insights.
Jessica Eddowes, VP of Digital Marketing & Ecommerce at Lice Clinics of America, notes, "Once you sync the data and build reports there is no necessity to go back and refeed the data into it" [24].
Cost and Deployment Options
Zoho Analytics offers flexible pricing to fit different needs. There’s a free plan for two users, which supports up to 10,000 rows and five workspaces. Paid plans start at $8 per user per month, with the Standard Cloud Plan ranging from $24 to $30 per month for handling up to 500,000 rows. A 15-day free trial is also available, requiring no credit card. The platform has earned high marks, consistently rated 4.4 out of 5 on review sites like G2, Gartner Peer Insights, and Capterra, with 91% of users recommending it [23][25].
7. Metabase
Intuitive Interface and Ease of Use
Metabase stands out as one of the most user-friendly BI tools, making it easy for beginners to dive into data analysis with minimal setup or technical know-how. Its Visual Query Builder uses a simple point-and-click interface, allowing users to filter, group, and aggregate data without writing a single line of SQL. Want to skip the technical jargon entirely? You can even type plain-English queries like "Show me orders from last month" and get instant visualizations [27][29].
A key feature that simplifies the experience is its Semantic Modeling Layer. This allows administrators to rename database fields - turning something like usr_tbl into "User Table" - and add helpful tooltips to explain metrics. This way, your team can explore data confidently, without needing constant IT assistance or a dense database manual [27].
For teams without a dedicated data engineer, the free Metabase Copilot plugin is a game-changer. It helps autocomplete queries and flags potential issues, ensuring smoother workflows [28].
This intuitive design, paired with flexible deployment options, makes Metabase a solid choice for teams of all sizes.
Cost and Deployment Options
Metabase offers pricing plans that cater to a wide range of needs. The Open Source version is completely free for self-hosted setups, making it ideal for developers or small teams comfortable managing their own infrastructure. For those who prefer a managed solution, the Starter plan provides a cloud-based option with basic permissions and 3-day support via Slack or email.
Need more advanced features? The Pro plan includes row and column-level permissions, along with enhanced authentication options like SAML and JWT. This plan is available for both cloud and self-hosted deployments. For larger organizations, the Enterprise plan takes things up a notch with priority support (1-day SLA) and the highest level of security [28].
Whether you're a small team or a large enterprise, Metabase's pricing and deployment options are designed to fit your specific needs.
We Tested 5 Business Intelligence Tools So You Don't Have To - Here's What Actually Works in 2025
Tool Comparison Table
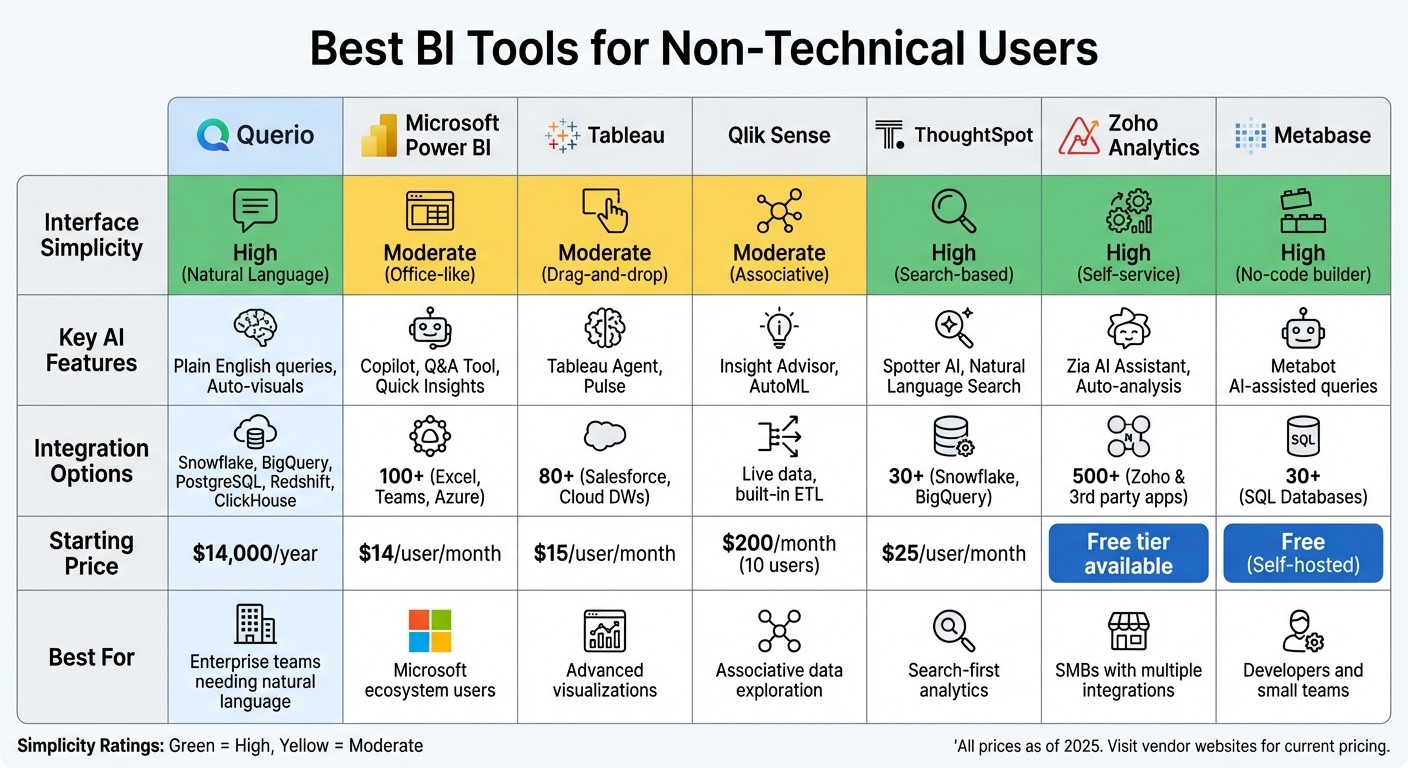
The table below outlines the essential features of modern BI tools, focusing on their interface ease, AI functionalities, available integrations, and pricing. This overview complements the detailed analysis provided earlier.
Tool | Interface Simplicity | Key AI Features | Integration Options | Starting Price |
|---|---|---|---|---|
Querio | High (Natural Language) | Plain English queries, Auto-visuals | Snowflake, BigQuery, PostgreSQL, Redshift, ClickHouse | $14,000/year |
Microsoft Power BI | Moderate (Office-like) | Copilot, Q&A Tool, Quick Insights | 100+ (Excel, Teams, Azure) | $14/user/month |
Tableau | Moderate (Drag-and-drop) | Tableau Agent, Pulse (Insights) | 80+ (Salesforce, Cloud DWs) | $15/user/month |
Qlik Sense | Moderate (Associative) | Insight Advisor, AutoML | Live data, built-in ETL | $200/month (10 users) |
ThoughtSpot | High (Search-based) | Spotter AI, Natural Language Search | 30+ (Snowflake, BigQuery) | $25/user/month |
Zoho Analytics | High (Self-service) | Zia (AI Assistant), Auto-analysis | 500+ (Zoho & 3rd party apps) | Free tier available |
Metabase | High (No-code builder) | Metabot (AI-assisted queries) | 30+ (SQL Databases) | Free (Self-hosted) |
Querio and ThoughtSpot excel in user-friendly simplicity, while Power BI and Tableau follow more traditional workflows. Zoho Analytics stands out with over 500 integration options, making it a great fit for small and medium-sized businesses.
Casey Ciniello from Slingshot explains, "Zoho Analytics balances cost and capability, making advanced BI accessible for SMBs" [1].
When it comes to pricing, options vary widely. Metabase offers a free self-hosted solution, while Zoho Analytics includes a free tier with paid plans starting at $24/month [1]. Power BI recently increased its Pro license fee to $14 per user per month as of April 2025 [20][1]. For enterprise-level needs, Querio combines natural-language querying with strong security features.
The business intelligence market is on track to reach $56.28 billion by 2030, driven by the demand for tools that simplify analytics for non-technical users [30]. Emerging trends like Agentic BI, where AI agents provide actionable suggestions and automate workflows, are reshaping how users interact with data [22].
The table and insights provided here underline how each tool caters to non-technical users, offering features that support informed and efficient decision-making.
Conclusion
Selecting the right BI tool boils down to three main factors: your team's comfort with technology, your budget, and whether the platform can scale as your business grows. A tool is only effective if your team can use it independently without needing constant IT assistance.
The next step? Test the tool yourself. Take advantage of a free trial and use your own data to assess how well it performs. Import your data, explore key questions, and conduct a proof of concept to evaluate usability, performance, and return on investment (ROI) before making a final decision.
"Run a proof of concept to validate usability, performance, and ROI before final selection." - OvalEdge Team [19]
During the trial phase, keep a close eye on adoption rates. If your non-technical team members struggle to create or adjust dashboards without IT support, the tool may not be the right fit [19]. The best BI tool is the one your team actively uses - not necessarily the one boasting the most features. Research indicates that 91% of BI users find these tools enhance decision-making, especially when using business intelligence reporting tools for financial planning [19].
FAQs
Which BI tool is easiest for my team to adopt?
If you're looking for a business intelligence tool that's simple for your team to pick up, Querio might be the answer. Its standout feature? Natural language querying - you can ask questions in plain English and get instant answers. Pair that with live data integration, and it becomes incredibly easy to create visualizations without any technical know-how.
While options like Tableau and Power BI are known for their user-friendly designs, Querio takes it a step further. Its AI-driven insights and minimal learning curve make it especially suited for non-technical teams who need quick, actionable results.
Do I need to move or copy my data to use a BI tool?
No, you don’t need to relocate or duplicate your data. Most BI tools are designed to connect directly to your existing data sources through built-in connectors. This allows for real-time analysis while keeping your data in its original location, ensuring smooth integration and efficient usage.
How do I choose between per-user pricing and flat pricing?
When deciding between per-user pricing and flat pricing for BI tools, it’s important to weigh factors like team size, usage patterns, and budget constraints.
Per-user pricing works best for smaller teams with a consistent number of users. It provides better cost control since you only pay for the exact number of users accessing the tool.
Flat pricing, on the other hand, is ideal for larger teams or situations where the number of users fluctuates. It simplifies budgeting and can reduce overall costs as your team grows.
The right choice hinges on your priorities - whether you need flexibility to accommodate growth or prefer stable, predictable costs for a larger user base.
Related Blog Posts


