Business Intelligence
Self-Service Analytics Without Losing Governance: A Data Leader's Guide
Enable self-service without losing control: set metric ownership, certify KPIs, use a governed semantic layer, enforce RBAC, and surface SQL/Python traceability.

You can give teams self-service analytics without losing control. I’d do it by locking metric definitions, limiting access with RBAC, using a semantic layer, and making every answer traceable to the warehouse.
If your company has 100–500 employees and runs on Snowflake, BigQuery, Redshift, or Postgres, the main risk is simple: different teams can get different answers from the same data. That leads to metric drift, more analyst cleanup, and less trust in numbers used for ARR, NRR, churn, and activation.
Here’s the short version:
- Set ownership first so each metric has one team responsible for its meaning
- Certify core metrics like ARR, NRR, churn, and activation before broad access
- Use a governed semantic layer so joins and business logic live in one place
- Keep access warehouse-native instead of relying on CSV exports and side files
- Require traceability so every AI answer shows SQL, Python, and source tables
- Give analysts and business users different paths based on what they need
A common pattern is this: Sales, Finance, Product, and CS each pull their own numbers, and soon one ARR figure does not match another. In many SaaS teams, a small set of leadership metrics drives a large share of planning and board reporting, so even one conflicting definition can slow decisions across the company.
My takeaway: self-service works when I let people move on their own inside fixed rules, not outside them.
Self-Service Analytics at Scale: Empowering Users Without Losing Governance
::: @iframe https://www.youtube.com/embed/qG4Oo72aUjY :::
Quick Comparison
| Model | Speed to answer | Metric consistency | Audit trail | Risk of disputes |
|---|---|---|---|---|
| Ungoverned access | High for one person | Low | Low | High |
| Centralized BI only | Lower | High | Medium | Medium |
| Governed self-service | High with guardrails | High | High | Lower |
In plain English: I would not start by opening raw data to everyone. I would start by fixing definitions, permissions, and lineage, then let teams self-serve from approved data while maintaining strict governance.
Build the Governance Model Before You Expand Access
::: @figure 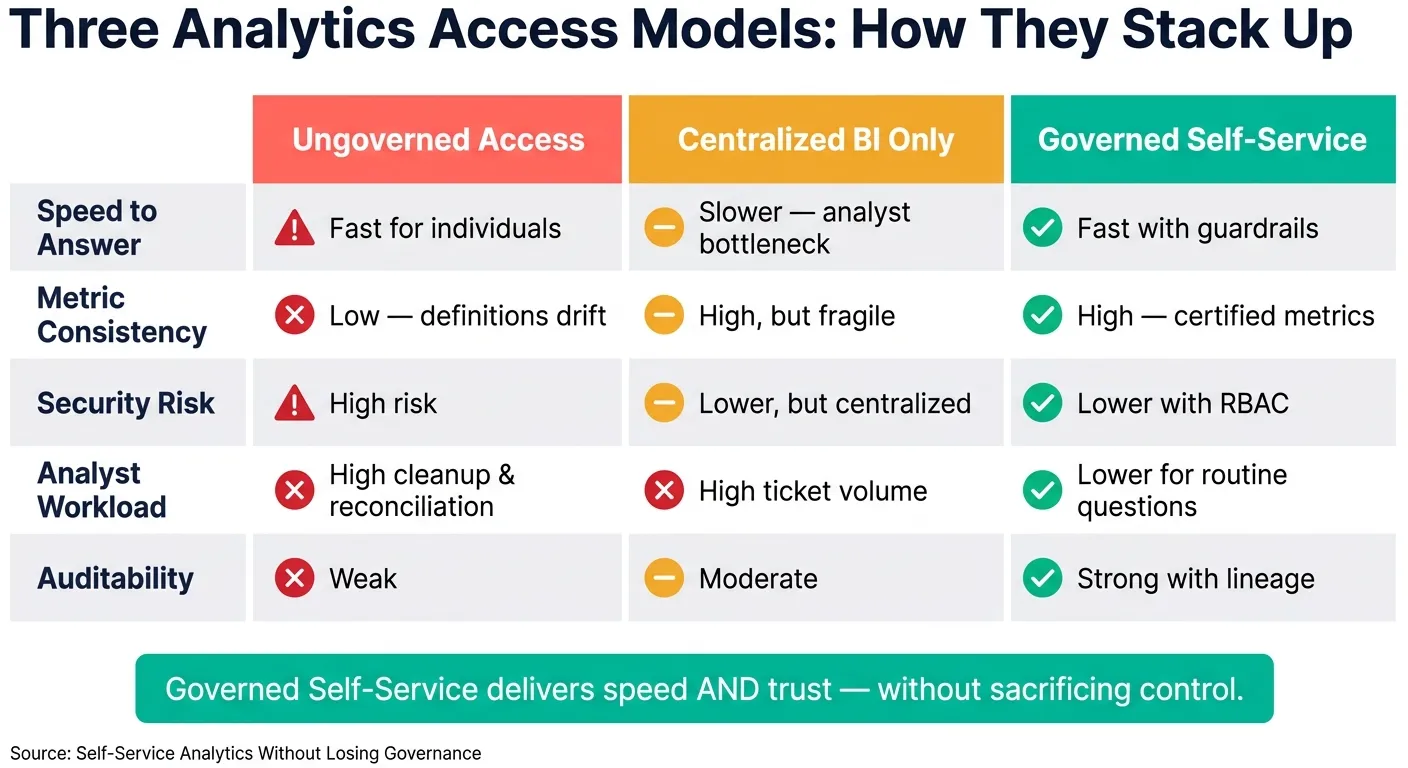 {Ungoverned vs. Centralized BI vs. Governed Self-Service Analytics}
:::
{Ungoverned vs. Centralized BI vs. Governed Self-Service Analytics}
:::
Expand access only after you set ownership, access, and certification rules. If you skip that step, self-service can turn into metric drift fast.
Assign Clear Ownership for Metrics, Datasets, and Published Analytics
For a 100–500-employee B2B SaaS team, the most practical setup is a federated ownership model.
That means Finance, RevOps, Product, and Customer Success each define the business logic for their own metrics. The central data team then puts those definitions into dbt, controls who can approve new models, and certifies dashboards for company-wide use.
It’s a clean split. Business teams decide what a metric means. The data team makes sure that meaning shows up the same way across the stack.
Once ownership is in place, you need to back it up with access controls and lineage.
Enforce Access Controls, Data Quality, Lineage, and Auditability
Role-based access control (RBAC) is the starting point. In Snowflake, BigQuery, Redshift, or Postgres, access should match what each team actually needs. It should not default to broad warehouse visibility.
For lineage, use automated tools that trace SQL, models, and docs back to source tables, and label relationships as direct or derived [1].
That gives teams a way to see where numbers come from, what depends on what, and what might break when a source changes.
Ungoverned Access vs. Centralized BI vs. Governed Self-Service: A Comparison
Here’s the trade-off in plain terms:
| Dimension | Ungoverned Access | Centralized BI Only | Governed Self-Service |
|---|---|---|---|
| Speed to answer | Fast for individuals | Slower - analyst bottleneck | Fast with guardrails |
| Metric consistency | Low - definitions drift | High, but fragile if one team owns everything | High - certified metrics stay consistent |
| Security | High risk | Lower risk, but centralized | Lower risk with RBAC and governance |
| Analyst workload | High cleanup and reconciliation | High ticket volume | Lower for routine questions |
| Auditability | Weak | Moderate | Strong with lineage and certification |
Governed self-service usually lands in the middle in the best way. People can move fast, but not at the cost of trust.
Build a Governed Semantic Layer and Certify Your Core Metrics
Once ownership and access are set, the semantic layer becomes your next checkpoint. This is what stops metric logic from drifting across dashboards, prompts, and hallway knowledge.
Define Business Entities and Joins Once on Top of the Warehouse
Set up your main business entities - accounts, users, subscriptions, and product events - directly on top of the warehouse. Then define the joins that connect them in warehouse code, so every downstream surface runs on the same logic.
When each relationship is tagged as either EXTRACTED or INFERRED, data teams can see in the semantic layer what comes straight from source logic and what the system derived [1].
Define joins once, and metrics like ARR, churn, and activation stay aligned across every report and AI answer.
Certify Core Metrics Like ARR, NRR, Churn, and Activation
Start small. Focus on the five to ten metrics that show up in board decks and leadership reviews. Define ARR, NRR, churn, and activation once. Then certify those definitions in the semantic layer and leave the rest uncertified.
The problem to avoid is silent metric drift. One dashboard uses one activation window. Another uses a different one. Suddenly, two teams are talking about the same metric but not the same math.
Certified metrics should be versioned before changes go live. Uncertified metrics can stay flexible, but they should have a clear label so users know they haven't been certified.
The trade-off becomes obvious when you compare chart-level logic, prompt-driven logic, and a governed semantic layer.
Dashboard Metrics vs. Prompt-Based Metrics vs. a Governed Semantic Layer: A Comparison
| Dimension | Dashboard Metrics | Prompt-Based Metrics | Governed Semantic Layer |
|---|---|---|---|
| Consistency | Low - logic lives in each chart | Very low - varies by prompt | High - one definition, reused everywhere |
| Discoverability | Hard - buried in dashboard configs | None - ephemeral by nature | High - centralized and searchable |
| Change management | Manual updates per dashboard | No change tracking | Versioned, reviewable changes |
| Explainability | Partial - depends on chart notes | Weak - AI reasoning can be opaque | Strong - SQL and lineage are visible |
| Risk of metric disputes | High | Very high | Low with certified metrics |
Querio's governed context layer lets teams define joins, metrics, and business terms once, then reuse them across ad hoc analysis, dashboards, notebooks, and AI answers with inspectable SQL/Python on live warehouse data. That setup keeps self-service fast without breaking trust in the numbers.
Keep Access Warehouse-Native and Make Every Answer Traceable
Definitions keep metrics consistent. Warehouse-native execution keeps those metrics open to review. If the warehouse is your system of record, every answer should lead back to it.
That’s the heart of governance in practice: people need to see the live data path behind an answer, not just accept a number on faith. When they can trace a result back to the warehouse, they can check it, trust it, and use it.
Use Live Warehouse Connections Instead of CSV Exports
CSV and spreadsheet exports weaken governance because they pull data out of the warehouse and into side files. Once that happens, permissions, lineage, and freshness can start to drift.
Live querying against Snowflake, BigQuery, Redshift, or Postgres lets tools read schemas straight from the live warehouse [1]. That keeps access controls in place, keeps data current, and preserves lineage. Put simply, live connections keep the warehouse in charge instead of letting exports become shadow data.
Require Every AI-Generated Answer to Show Its SQL, Python, and Source Tables
Trust drops fast when people can’t inspect how an AI answer was produced. The fix is simple: show the logic.
Every AI-generated answer should expose the SQL or Python it ran. Analysts should also be able to edit that code directly when something feels off. Systems should clearly separate EXTRACTED data from INFERRED data, so users can verify what came from source records and what was derived [1].
That becomes a big deal when Finance, RevOps, and Product all need the same number for the same call. If each team sees the same answer and the same logic behind it, fewer debates turn into copy-and-paste cleanup later.
Querio surfaces inspectable, editable SQL and Python for every answer, backed by live warehouse connections. That gives teams self-serve analytics without turning the whole setup into a black box.
The best workflow keeps analysts moving fast without adding copy-and-paste risk.
Spreadsheets vs. Dashboards Only vs. Governed Warehouse-Native Self-Service: A Comparison
| Dimension | Spreadsheets | Dashboards Only | Governed Warehouse-Native |
|---|---|---|---|
| Data freshness | One-time export | Scheduled refresh | Live query on demand |
| Permission enforcement | Minimal after export | Moderate | High, with warehouse permissions enforced |
| Security risk | Higher | Lower | Lower, with centralized access controls |
| Auditability | Limited | Limited query logs | Query history and lineage |
| Flexibility for analysis | High for ad hoc editing | Lower | High with governed AI and editable code |
| Risk of metric disputes | High | Medium | Lower with certified metrics |
A simple way to think about it:
- Use spreadsheets for local analysis
- Use dashboards for consumption
- Use warehouse-native self-service for governed exploration
With traceability in place, analysts and business users can move faster without giving up control.
Roll Out AI-Driven Self-Service for Analysts and Business Teams
A governed semantic layer only pays off when people use it every day. That usually means two lanes: one for analysts who need space to dig in, and one for business teams who need answers without poking around raw tables.
Give Analysts a Governed Ad Hoc Analysis Workspace
Analysts need freedom to test ideas, compare segments, and chase patterns. But that work should start from shared definitions, not raw tables they have to stitch together on their own.
A reactive notebook setup gives them that space. They can iterate fast while staying tied to certified metrics. If cohort or retention work lives in versioned notebooks, the team can reuse the logic instead of rebuilding joins and metric rules from scratch each time.
Querio's notebook environment is built for this. It uses reactive notebooks with live warehouse connections, so the logic stays inspectable and definitions stay aligned across the team. That same notebook logic can then power shared analysis or downstream publishing.
Let Non-Technical Users Ask Questions Without Querying Raw Tables
Sales, Customer Success, Product, and Marketing teams all have day-to-day data questions. They shouldn't have to sort through raw tables to get answers.
Point them to certified datasets for their domain. A CS manager looking into churn should see customer-facing metrics, not raw billing tables. Natural-language questions should resolve only to approved joins and certified metrics, with inspectable SQL or Python behind every result.
That makes self-service useful for day-to-day decisions without opening up raw data access.
The Playbook: Speed, Trust, and Control Together
The model is simple:
- Set ownership first
- Certify core metrics like ARR, NRR, churn, and activation in the semantic layer
- Keep queries warehouse-native so permissions and freshness stay in place
- Require every AI-generated answer to show its SQL or Python
When those parts are set up, teams move faster and spend less time arguing over metrics. And data leaders can spend less time putting out fires and more time building.
FAQs
::: faq
How do I decide which metrics to certify first?
Start with the metrics people use all the time and the ones that have the biggest effect on growth, financial health, or compliance. A smart first move is to agree on three to five core KPIs, such as MRR or ARR, that help leaders make decisions.
It also makes sense to put shared datasets near the top of the list, especially customer and revenue data. Since multiple teams rely on them, even small logic gaps can turn into a mess fast. Define those datasets with business owners upfront so the data team can enforce the same logic in a governed semantic layer. :::
::: faq
When should business users get self-service access?
Business users should get self-service access once a governed foundation is in place for security, data quality, and consistency.
Before you expand access, set standard metrics in a centralized semantic layer. Enforce RBAC and RLS at the warehouse level, and make sure documentation is clear and deployment pipelines are automated. That way, users query trusted, live data instead of guessing which numbers to use.
It also helps to start small. Run a lighthouse pilot in one business unit first, then scale from there. :::
::: faq
What should I govern in the semantic layer?
Govern the shared definitions that keep analytics consistent and trusted: core metrics, business logic and relationships, dimensions and hierarchies, ownership and access, and lineage/documentation.
In practice, define KPIs and edge-case handling once, standardize joins and filters, assign clear owners, apply role-based access controls, and document data provenance, refresh timing, and which datasets are certified versus experimental. :::