Business Intelligence
self serve business intelligence
Non-technical teams can query live data with natural language, a governed semantic layer, and faster, trusted insights.
Self-serve business intelligence empowers non-technical teams to access and analyze data independently, eliminating IT bottlenecks. This approach accelerates decision-making, reduces IT workloads, and promotes data-driven operations across organizations.
Key takeaways:
Faster insights: Self-serve BI cuts report creation time by up to 80%.
Broad access: Teams like marketing and sales can directly explore data.
Market growth: Valued at $6.79B, the self-serve BI market is projected to reach $63.75B by 2037.
Efficiency gains: IT teams focus on strategic tasks instead of routine reporting.
Querio, a leading platform, combines AI-powered natural language querying with governed data layers, ensuring accuracy and trust in analytics. Companies using Querio report faster decision-making, reduced IT backlogs, and significant cost savings.
Back to Basics: Generative BI Pattern for Self-Service Analytics
What is Self-Serve Business Intelligence?
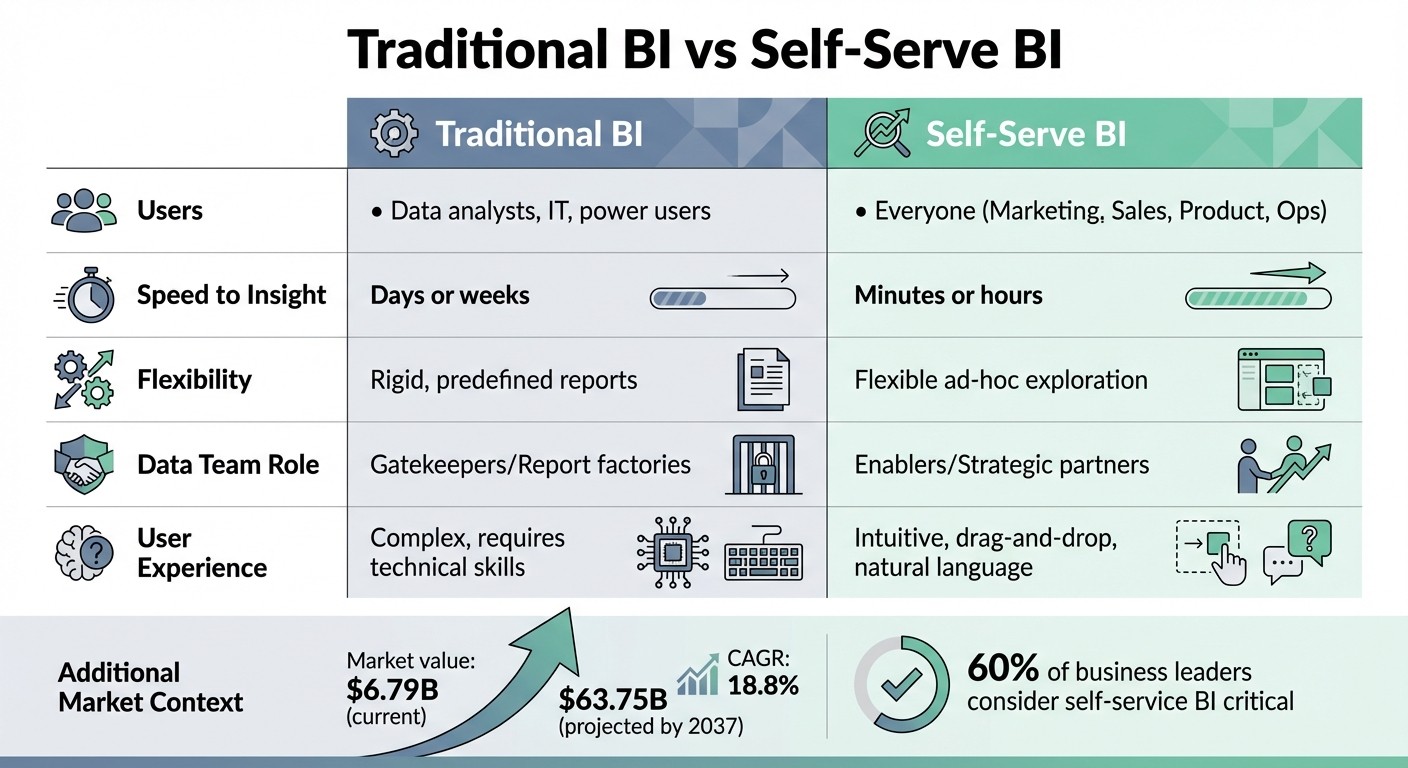
Traditional BI vs Self-Serve BI: Key Differences and Benefits
Self-serve business intelligence (BI) empowers business users to access and analyze data on their own. Instead of relying on data teams or waiting days for reports, employees from departments like marketing, sales, and operations can directly pull insights from company data. This means quicker decision-making without technical bottlenecks.
Self-service BI enables business users to answer data questions with minimal assistance from data teams [1].
The growing importance of this approach is reflected in its market numbers. The self-service BI market, valued at $6.79 billion, is expected to skyrocket to $63.75 billion by 2037, with a compound annual growth rate (CAGR) of over 18.8% [1]. It’s no wonder - 60% of business leaders now consider self-service BI a critical initiative for their organizations [3].
Core Principles of Self-Serve BI
To understand self-serve BI, it’s essential to highlight its three main pillars:
Intuitive interfaces: These tools eliminate the need for complex query languages. Instead, users can rely on drag-and-drop features and visual builders that are simple to navigate.
Natural language querying: This feature allows users to ask questions in plain English - like "What were our Q4 sales?" - instead of using SQL or other technical languages.
Governed data access: Acting as a bridge between complex database structures and everyday business language, this ensures users work with accurate and consistent metrics. It also maintains security and compliance through centralized oversight [2].
Self-Serve BI vs Traditional BI
The shift from traditional BI to self-serve BI fundamentally changes how organizations interact with data. Here’s a comparison:
Attribute | Traditional BI | Self-Serve BI |
|---|---|---|
Users | ||
Speed to Insight | Days or weeks [2] | Minutes or hours [2] |
Flexibility | Rigid, predefined reports [2] | Flexible ad-hoc exploration [2] |
Data Team Role | ||
User Experience | Complex, requires technical skills [2] | Intuitive, drag-and-drop, natural language [2] |
Organizations adopting self-serve BI are already seeing tangible benefits. For example, Henderson Group, an investment firm, achieved a 7.75% increase in sales per employee and a 26.14% boost in net trading income per head after implementing self-serve BI [3]. Similarly, IndianOil enabled 10,000 users across supply chain and inventory teams to create their own dashboards, saving 25% of the IT team’s total workload [3].
Benefits of Self-Serve Business Intelligence
Self-serve BI offers a transformative way for organizations to operate by giving teams direct access to the data they need. This approach eliminates delays and bottlenecks, creating measurable benefits of self-service business intelligence in three key areas.
Faster Decision-Making
In fast-paced industries, speed is everything. Logistics companies, for instance, can instantly check supply metrics to address disruptions, while ecommerce teams can quickly shift budgets to improve performance. This kind of agility is essential in sectors where timing can make or break success. With self-serve BI, processes that used to take days or even weeks can now be completed in mere minutes or hours [2]. Automating repetitive reporting tasks frees up valuable time, allowing teams to focus on strategy and optimization instead [2]. By enabling real-time analytics, self-serve BI encourages independent data exploration and fosters collaboration across departments.
Data Access for All Teams
Self-serve BI removes barriers between teams and the data they need. Marketing, sales, product, and operations teams can directly explore data, ask follow-up questions, and access reliable, governed information without waiting on IT. This approach promotes data literacy throughout the organization, making data as integral as a shared language [2]. For example, an ecommerce team can monitor ad performance and adjust budgets on the spot, while a SaaS team can analyze user behavior and churn trends, cutting feedback loops from weeks to hours [2]. When all teams have access to accurate data, decision-making becomes a shared, collaborative process. IT teams also benefit, as this self-service model reduces their workload, enabling them to focus on higher-value projects.
Reduced IT Backlog
With self-serve BI, IT teams can shift their focus from routine report generation to more impactful tasks like predictive modeling and scaling infrastructure. Instead of acting as "report factories", IT professionals can channel their expertise into managing platforms and ensuring data governance [2][1]. This shift not only drives innovation but also allows organizations to grow without proportionally increasing the size of their data teams.
Key Features of Effective Self-Serve BI Platforms
What sets apart a BI tool that genuinely empowers teams from one that creates confusion boils down to three key capabilities: a governed semantic layer, natural language querying with inspectable analytics, and flexible delivery mechanisms. These features are essential for scaling analytics while maintaining accuracy and control.
Let’s dive into the technical elements that make self-serve BI platforms successful.
Governed Semantic Layer
A governed semantic layer acts as the bridge between raw data and business users, ensuring everyone is working with the same definitions for metrics, dimensions, and business rules. Querio’s Context Layer is a strong example of this, centralizing these elements to prevent inconsistencies. Without such a layer, departments may create conflicting metric definitions - a problem often referred to as "shadow BI." This misalignment can lead to poor decision-making and erode trust in analytics.
Here’s a concrete example: implementing a robust semantic layer recently helped one organization reduce metric definition time from weeks to hours, achieve 99.9% data consistency, and increase self-serve adoption by 40%. These efficiency gains were valued at $5 million. Such consistency is critical, especially for global teams where even the definition of something as basic as "revenue" must be uniform.
Querio’s Context Layer simplifies this process by centralizing joins, metrics, and business terminology. Once data teams define these elements, they’re applied universally across dashboards, ad-hoc analyses, and AI-driven answers. This prevents the metric sprawl that often undermines trust in self-serve BI environments.
Natural Language Querying and Inspectable Analytics
Natural language querying lets users ask questions in plain English, but many platforms treat AI as a black box, delivering results without showing how they were derived. Querio takes a different approach by ensuring every query produces inspectable SQL and Python code. This transparency allows teams to review and validate the logic behind the results, fostering trust and confidence in the analytics.
Research backs this up: generative AI accuracy in analytics jumps from 16% to 54% when paired with a semantic layer. Kathryn Chubb of dbt Labs highlights the shift in focus for high-performing teams:
High-performing teams shift their focus from 'how many questions can we answer' to 'how many people can we enable to answer their own questions, safely.'
This transparency also sets the stage for interactive and dynamic visualizations that enhance user engagement.
Interactive Dashboards and Embedded Analytics
Interactive dashboards take reporting to the next level by allowing users to explore data in real time. Instead of waiting on IT for updates, users can filter, drill down, and adapt views instantly as new data comes in. For example, a sales team can monitor regional performance and filter by product line or time period to spot emerging trends quickly.
Querio’s Boards make this possible by linking interactive dashboard cells directly to live data warehouses. Users can click, filter, and even ask follow-up questions within the dashboard itself, cutting decision-making cycles from days to minutes.
Embedded analytics takes this functionality even further by integrating dashboards directly into customer-facing platforms using iFrames and APIs. This approach delivers insights exactly where users need them - whether in a SaaS portal, Slack, or a mobile app. In fact, embedded analytics tools and platforms adoption grew by 25% in 2024, driven by the demand for seamless, in-app insights. For instance, a SaaS company might embed usage analytics into customer dashboards, helping clients track feature adoption and identify optimization opportunities without requiring separate logins.
Querio supports this seamless integration by reusing governed analytics logic across internal dashboards, customer applications, and scheduled reports. All of these are powered by consistent definitions and live data connections, ensuring smooth functionality across every touchpoint.
How to Implement Self-Serve BI with Querio
Getting self-serve BI right takes careful planning, proper training, and ongoing adjustments. Rushing into implementation without ensuring data readiness or setting up governance can lead to low adoption and mistrust, which can derail the entire effort. With Querio's powerful features, you can empower teams while keeping data governance intact.
A phased approach is the most effective way to roll this out. Start by preparing your data and setting up infrastructure during the first four weeks. Use this time to audit data quality and establish your data warehouse. From weeks 5 to 8, launch a pilot program with one high-priority team, such as finance or product analytics, to gather feedback and identify champions. Between weeks 9 and 12, expand to two or three more teams, offering tailored training sessions. After week 13, roll it out across the organization. Most B2B SaaS companies achieve full adoption within 60 to 90 days, but you should see early wins within 4 to 6 weeks of starting the pilot. Below, we’ll cover how to prepare your data, train teams, and streamline workflows using Querio.
Preparing Your Data for Querio
Your data setup is the backbone of any successful self-serve analytics initiative. Before connecting Querio to your data warehouse, start by auditing your data sources to identify any quality issues. Document the origins of your data (data lineage) so users can see where it comes from, and standardize naming conventions across all systems. For B2B SaaS companies managing customer data, this also involves categorizing sensitive information before granting broader access.
Querio integrates seamlessly with modern data warehouses like Snowflake, BigQuery, Amazon Redshift, and ClickHouse. It uses encrypted, read-only credentials to ensure security. Your infrastructure should be robust enough to handle simultaneous queries from multiple users without slowing down. Core datasets should have less than 5% missing data and meet standards for accuracy, completeness, and timeliness before opening access to users.
Start small by defining 15-25 key metrics in Querio’s Context Layer instead of trying to catalog every metric. For B2B SaaS companies, focus on essential metrics like revenue (MRR, ARR, churn rate), product performance (daily active users, feature usage), and operations (sales cycle time, support ticket resolution). Clearly document each metric’s definition, calculation method, data sources, and refresh frequency to minimize confusion as usage grows. Once your data is solid, the next step is ensuring your teams are equipped to use it effectively.
Training Teams and Enforcing Governance
Implement a tiered training program that matches the varying skill levels of your users. Start with beginner sessions that teach dashboard basics and common use cases tailored to each department. Move to intermediate sessions where users learn to ask questions in natural language and understand metric definitions. Advanced training should focus on complex analysis and creating custom metrics within governed limits.
Governance training should be woven into every step of the process, not treated as a separate topic. Teach users about role-based access controls, approved metrics, and when to escalate questions to data teams. Tailor training paths to specific roles - marketing analysts and sales operations teams have different needs, and relevant training ensures faster adoption.
Set up audit logs to track data access and usage, and create clear procedures for escalating requests for restricted information. Regularly review governance practices to catch unauthorized access or metric inconsistencies before they turn into larger issues. With well-prepared data and trained teams, you can now focus on optimizing workflows to make analytics more efficient.
Optimizing Analytics Workflows with Querio
Querio’s reactive notebooks allow for dynamic, real-time analysis. Any changes to the underlying data automatically update dependent calculations. Users can ask questions in plain language, see interactive results, and drill down into the details instantly.
This approach drastically reduces the time it takes to derive insights - from days to mere minutes. For example, a sales operations manager can quickly analyze pipeline velocity by region, segment, or sales rep without needing to request custom reports from IT. This efficiency demonstrates how Querio simplifies self-service analytics across the organization.
IT teams can shift their focus to being enablers rather than report generators. Their role becomes maintaining the data infrastructure and governance policies. Create a feedback loop where users report data quality issues directly to data stewards, who can investigate and resolve them. While IT should still handle complex analyses when needed, business teams can take ownership of their analytics, exploring data and generating insights independently.
Querio in Action: Workflows and Use Cases
These examples highlight how Querio reshapes analytics workflows for B2B SaaS companies, addressing scaling challenges while boosting speed, consistency, and customer value.
Scaling Analytics with Consistent Metrics
A mid-stage B2B SaaS company specializing in customer success software leveraged Querio to standardize metrics across teams. Marketing created a "customer acquisition cost" model within Querio's semantic layer, allowing product and sales teams to reuse it for live queries. This shift expanded user access from just 5 to 50 users while ensuring 100% metric consistency across 200 dashboards [5]. Similarly, a CRM provider reduced reconciliation time by 70% and established reliable cross-departmental dashboards [4][5].
By ensuring consistent metrics, teams can make agile and well-informed decisions more effectively.
Improving Decision-Making Efficiency
Growdash, a B2B SaaS company with 50–100 employees, replaced its outdated BI tool to eliminate data bottlenecks. Using Querio's natural language interface and semantic layer, they slashed time-to-insight from two weeks to just 30 minutes. This empowered product and customer success teams to conduct self-service analytics, saving over $200,000 annually by avoiding extra data engineering hires [7].
"Querio's natural language interface was a game-changer. Our product team could explore data independently, leading to quicker and more informed decisions."
Enver Melih Sorkun, Co-Founder, Growdash [7]
In another case, a sales team at a project management SaaS company used Querio's live dashboards to track pipeline velocity metrics in real time. Sales reps could ask natural language queries like, "Show win rates for deals over $10,000 last quarter", enabling efficient weekly pipeline reviews. This led to a 25% increase in close rates [6]. Across the board, companies reported delivering insights 3× faster while reducing ad-hoc IT requests by 40–60% after adopting Querio [4][8].
Embedding Analytics for Customer-Facing Applications
Querio doesn't just improve internal workflows - it also enhances customer-facing platforms with real-time analytics.
For instance, a B2B SaaS e-commerce platform embedded Querio dashboards into its customer portal. This gave users access to inventory trends and sales forecasts directly within the platform, cutting support tickets by 50%. The process was quick: define metrics in Querio's semantic layer, build dashboards using no-code embedded analytics tools, integrate via APIs with single sign-on, and enforce row-level security to ensure proper governance [4][9]. The entire implementation took less than a week [5].
Similarly, a fintech SaaS company embedded churn prediction dashboards powered by Querio, boosting upsell conversions by 22% without any governance issues [5][10]. Teams also saw customer retention rates climb by 30–50% and product iteration speed increase fourfold with embedded analytics [5][10].
These examples illustrate how Querio helps organizations scale analytics, make faster decisions, and improve customer engagement - all while maintaining strong governance practices.
Conclusion: Why Querio Works for Self-Serve BI
Self-serve business intelligence allows teams to quickly access, analyze, and act on data. For this to work effectively, it relies on AI-driven analytics, a well-structured semantic layer, and live querying directly from data warehouses - all while ensuring both ease of use and accuracy.
Querio brings all these elements together, delivering insights that are both fast and dependable. Its plain-English query feature generates results up to 5× faster, with a governed semantic layer that reduces metric inconsistencies by up to 80% compared to older BI systems. By connecting directly to platforms like Snowflake and BigQuery, Querio eliminates the need for ETL processes or outdated extracts, enabling teams to analyze real-time data and gain insights 40% faster than static tools.
The impact? Companies report a 60–70% reduction in IT backlogs, 5× faster decision-making, and yearly cost savings exceeding $200,000. Whether it's scaling analytics across countless dashboards, embedding live insights into customer-facing portals, or empowering sales teams to monitor pipeline velocity in real time, Querio strikes the perfect balance between strong governance and speed.
FAQs
What data should be prepared before implementing self-serve BI?
Before rolling out self-serve BI, make sure you have clean, reliable data stored in a centralized data warehouse or data lake. Ensure it’s equipped with real-time connectivity for seamless updates. Implement role-based permissions to control access and safeguard sensitive information, and create a unified data model to ensure metrics are defined consistently across the board. It’s also crucial to evaluate your technical infrastructure and offer training to users, helping them confidently navigate the system while upholding data integrity and governance standards.
How do we prevent “shadow BI” and keep metrics consistent?
To keep "shadow BI" at bay and ensure consistent metrics in self-serve BI, organizations need to implement solid governance practices. This means centralizing data definitions, clearly defining roles and permissions, and leveraging a semantic layer to uphold data accuracy. Regular check-ins, fostering collaboration across teams, and using AI-powered tools for monitoring can further enhance consistency, giving all users a single, reliable source of truth to depend on.
How do permissions and security work for non-technical users?
Managing permissions and security doesn't have to be overwhelming, even for non-technical users. Querio takes a governance-first approach, striking the right balance between user autonomy and control.
At the heart of this system is Role-Based Access Controls (RBAC). This means data access is restricted based on user roles, helping to minimize risks and stay compliant with regulations like GDPR and HIPAA.
On top of that, Querio includes features like encrypted connections, automated compliance checks, and audit trails. These tools work together to safeguard sensitive data while still allowing users to explore and analyze data securely and independently.
Related Blog Posts


