Business Intelligence
what is time series analysis
Explains trends, seasonality, cyclicity, methods (ARIMA, LSTM), and business uses of time series forecasting.
Time series analysis helps you understand how data changes over time. Unlike static data analysis, it focuses on trends, patterns, and anomalies in data collected at regular intervals. Businesses use it to forecast sales, predict customer behavior, and optimize operations. For example:
Trends show long-term movement (e.g., sales growth over years).
Seasonality reveals recurring patterns (e.g., holiday sales spikes).
Cyclicality identifies non-calendar-based fluctuations (e.g., economic cycles).
Irregularity accounts for random, unpredictable changes (e.g., natural disasters).
Techniques range from simple moving averages to advanced AI models like LSTM. Tools like Querio simplify this by connecting directly to your data and enabling natural language queries, making insights more accessible and actionable.
Time Series Analysis Explained: Trend, Seasonality & Stationarity
What Makes Up Time Series Data
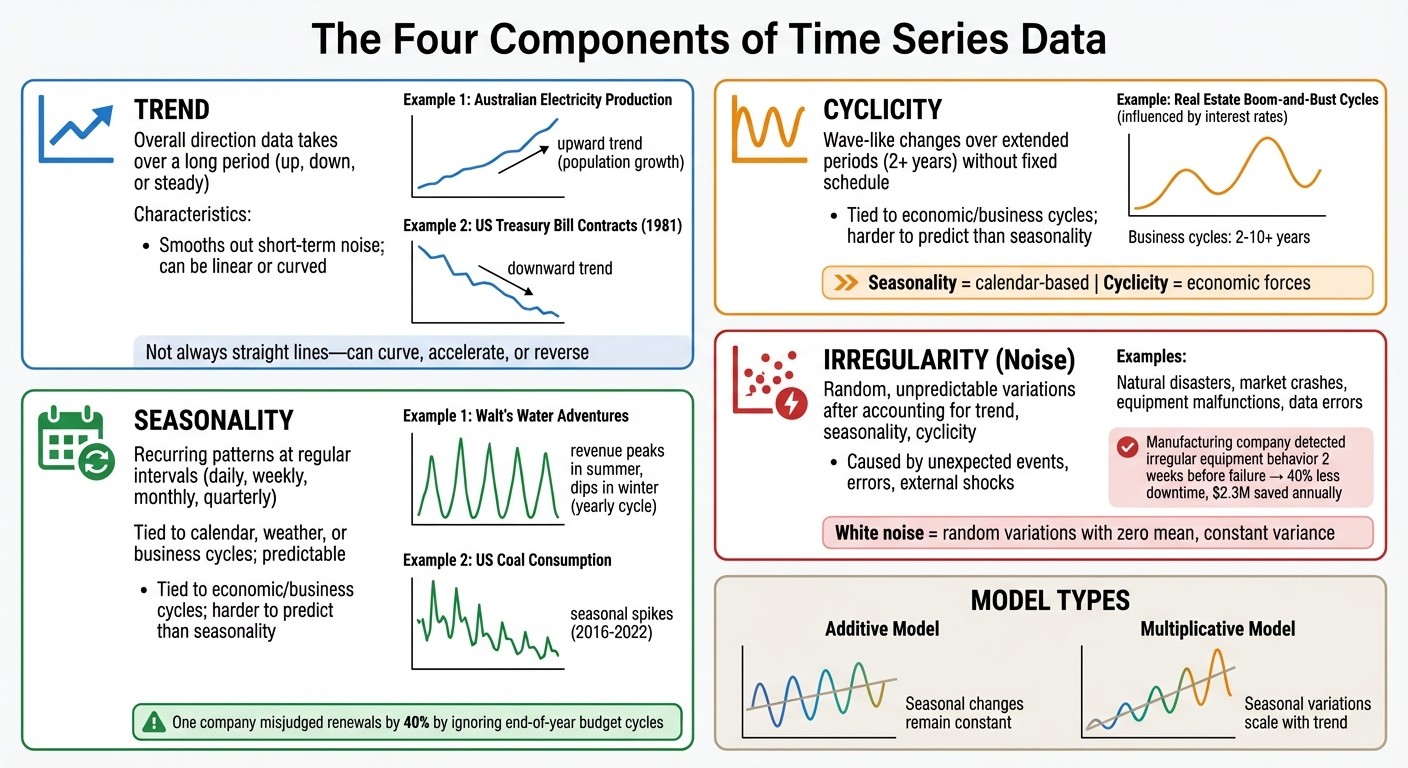
Four Key Components of Time Series Data: Trend, Seasonality, Cyclicity, and Irregularity
Every time series is built from four key components that together shape the patterns and trends in your data. Understanding these components is crucial for making sense of time series data and using it to guide better decisions. By breaking down the data into these elements, you can separate meaningful insights from random fluctuations and create more reliable forecasts.
"A trend exists when there is a long-term increase or decrease in the data. It does not have to be linear." - Rob J Hyndman and George Athanasopoulos, Authors, Forecasting: Principles and Practice [6]
These components interact in two main ways: additive (where seasonal changes remain constant) or multiplicative (where seasonal variations scale with the trend) [7][8]. Choosing the right model for your data is essential for interpreting patterns over time.
Trend
The trend is the overall direction your data takes over a long period - whether it's moving up, down, or staying steady. It smooths out short-term noise, making it easier to see the big picture [7].
For instance, Australian electricity production showed a clear upward trend over time, reflecting population growth and increased energy use. On the other hand, US Treasury Bill contracts from 1981 revealed a downward trend with no seasonal influences [6]. SaaS companies often use trends to track revenue growth and assess long-term performance, filtering out monthly fluctuations for a clearer view.
Trends aren’t always straight lines - they can curve, accelerate, or even reverse, depending on shifts in the market or external factors [6]. Now, let’s look at how recurring patterns shape seasonality.
Seasonality
Seasonality captures recurring patterns that repeat at regular intervals - daily, weekly, monthly, or even quarterly. These patterns are often tied to the calendar, weather, or business cycles [7][8].
Take Walt's Water Adventures, a kayak and canoe rental business, for example. From 2021 to 2023, their quarterly revenue consistently peaked in summer and dipped in winter, showing a seasonal cycle of one year [8]. Similarly, US coal consumption for electricity generation from 2016 to 2022 exhibited seasonal spikes, even as the overall trend declined [8].
Ignoring seasonality can lead to costly mistakes. One software company misjudged subscription renewals by 40% because they overlooked end-of-year budget cycles - a classic seasonal pattern [2]. Recognizing these predictable intervals can save businesses from major forecasting errors. Beyond these fixed cycles, there are longer, less predictable shifts known as cyclicity.
Cyclicity
Cyclicity refers to wave-like changes that occur over extended periods - typically at least two years - but without a fixed schedule [6]. These patterns are often tied to economic or business cycles rather than the calendar [7].
For example, real estate markets often experience multi-year boom-and-bust cycles influenced by interest rates and broader economic trends [6]. Business cycles, which can last anywhere from two to ten years or more, are harder to predict than seasonal patterns because they don’t follow a set rhythm [7].
The key difference between seasonality and cyclicity is timing: seasonality is predictable and tied to the calendar, while cyclicity depends on larger, less predictable forces [9][5].
Irregularity
Irregularity, or noise, represents the random, unpredictable variations left after accounting for trend, seasonality, and cyclicity. These fluctuations often arise from unexpected events, measurement errors, or external shocks [7].
"The irregular component... represents the random, unpredictable fluctuations in the time series that cannot be explained by the trend, seasonality, or cyclical components." - ApX Machine Learning [7]
Examples of irregularity include natural disasters, sudden market crashes, equipment malfunctions, or errors in data collection [9][1]. For instance, a manufacturing company analyzed sensor data to establish a baseline for normal operations. This allowed them to detect irregular equipment behavior two weeks before a failure occurred, cutting downtime by 40% and saving $2.3 million annually [2].
In statistical terms, "white noise" refers to random variations with a constant zero mean, constant variance, and no correlation between values [8]. Identifying these irregularities can help businesses anticipate challenges and improve efficiency.
Methods for Analyzing Time Series Data
Understanding the components of time series data is just the beginning. The next step is choosing the right analysis method to make timely, data-driven decisions. Your choice will depend on whether you're aiming to understand historical trends, predict future outcomes, or tackle complex datasets.
"Time series forecasting is one of the most applied data science techniques in business, finance, supply chain management, production and inventory planning." – InfluxData [13]
Here’s a breakdown of the main approaches that turn raw data into actionable insights:
Descriptive analysis focuses on summarizing historical patterns through statistics and visual tools [1][11]. By identifying what’s “normal,” this method helps spot anomalies - like an unexpected surge in website traffic or a sudden dip in production. Techniques such as decomposition are commonly used to break down historical patterns into understandable components [10][13].
While descriptive analysis looks at the past, forecasting models take it a step further by predicting what’s ahead. These models rely on historical data to estimate future trends. Methods like moving averages help smooth out short-term fluctuations, while exponential smoothing techniques, including Holt-Winters, quickly respond to recent changes [1][13]. For more complex data, ARIMA models and their seasonal counterpart, SARIMA, combine autoregression and moving averages to handle both stationary and seasonal datasets [1][13]. Before using ARIMA, it’s crucial to test for stationarity with the Dickey-Fuller test - a p-value greater than 5% means the data isn’t stationary and needs adjustments [12].
For more dynamic and complex datasets, AI and machine learning methods offer cutting-edge solutions. These techniques, including Long Short-Term Memory (LSTM) networks, Recurrent Neural Networks (RNNs), Random Forests, and XGBoost, excel at capturing non-linear patterns and automating feature extraction [1][11][13]. They’re particularly valuable in fast-changing environments, such as detecting real-time anomalies in IT performance or tracking shifts in marketing engagement [1]. These models adapt quickly to new data, making them a powerful tool for modern businesses.
How Businesses Use Time Series Analysis
Time series analysis plays a key role in helping businesses tackle challenges and stay ahead in competitive markets. With around 70% of enterprise data being time-based [14], understanding how data evolves over time is critical for making informed decisions. Here's how various business functions rely on time series analysis to shape strategy.
Revenue and Sales Forecasting
Revenue forecasting is essential for budgeting, hiring, and planning for growth. Companies that use time series forecasting techniques grow 19% faster than those that rely on intuition alone [3]. By embracing data-driven approaches, organizations can predict future revenue with 5% accuracy [3], giving leadership the confidence to make strategic moves.
Different models work best depending on the data. For example:
ARIMA is ideal for identifying monthly trends.
SARIMA works well for data with seasonal patterns.
Exponential smoothing is perfect for markets with frequent fluctuations.
Choosing the right model based on your data's seasonality and volatility ensures forecasts remain reliable, even in dynamic environments.
Customer Behavior Analysis
Understanding how customer behavior changes over time uncovers patterns that can guide product development and marketing strategies. Time series analysis helps establish baselines for metrics like click-through rates and lead generation, allowing businesses to measure the success of campaigns [1]. If engagement drops unexpectedly, segmenting the data - by device type or subscription tier - can help pinpoint the root cause [4].
In finance, time series analysis is used to detect anomalies, such as spotting fraudulent transactions by identifying deviations from a customer's typical spending habits [2]. For product teams, tracking feature adoption over time helps identify "power users" and understand which features drive retention [4]. It's worth noting that 62% of forecasting errors stem from data quality issues rather than model selection [3], emphasizing the importance of maintaining clean, reliable data.
Operational Efficiency
Time series analysis is also a powerful tool for improving operational workflows. By studying historical demand patterns, businesses can optimize production schedules and inventory management - reducing waste while ensuring products are available when needed [1][2]. In manufacturing, analyzing equipment sensor data enables predictive maintenance, helping companies anticipate failures and cut down on unplanned downtime [2].
For SaaS and tech companies, forecasting server loads ensures capacity is adjusted dynamically, preventing service buffering during high-traffic periods [2]. Real-time anomaly detection further supports operations by monitoring metrics like IT latency or transaction activity, allowing teams to quickly address technical issues or fraudulent behavior [1][2]. For example, WHOOP accelerated its financial forecasting process by 3x through the use of AI and machine learning models [14].
How Querio Handles Time Series Analysis
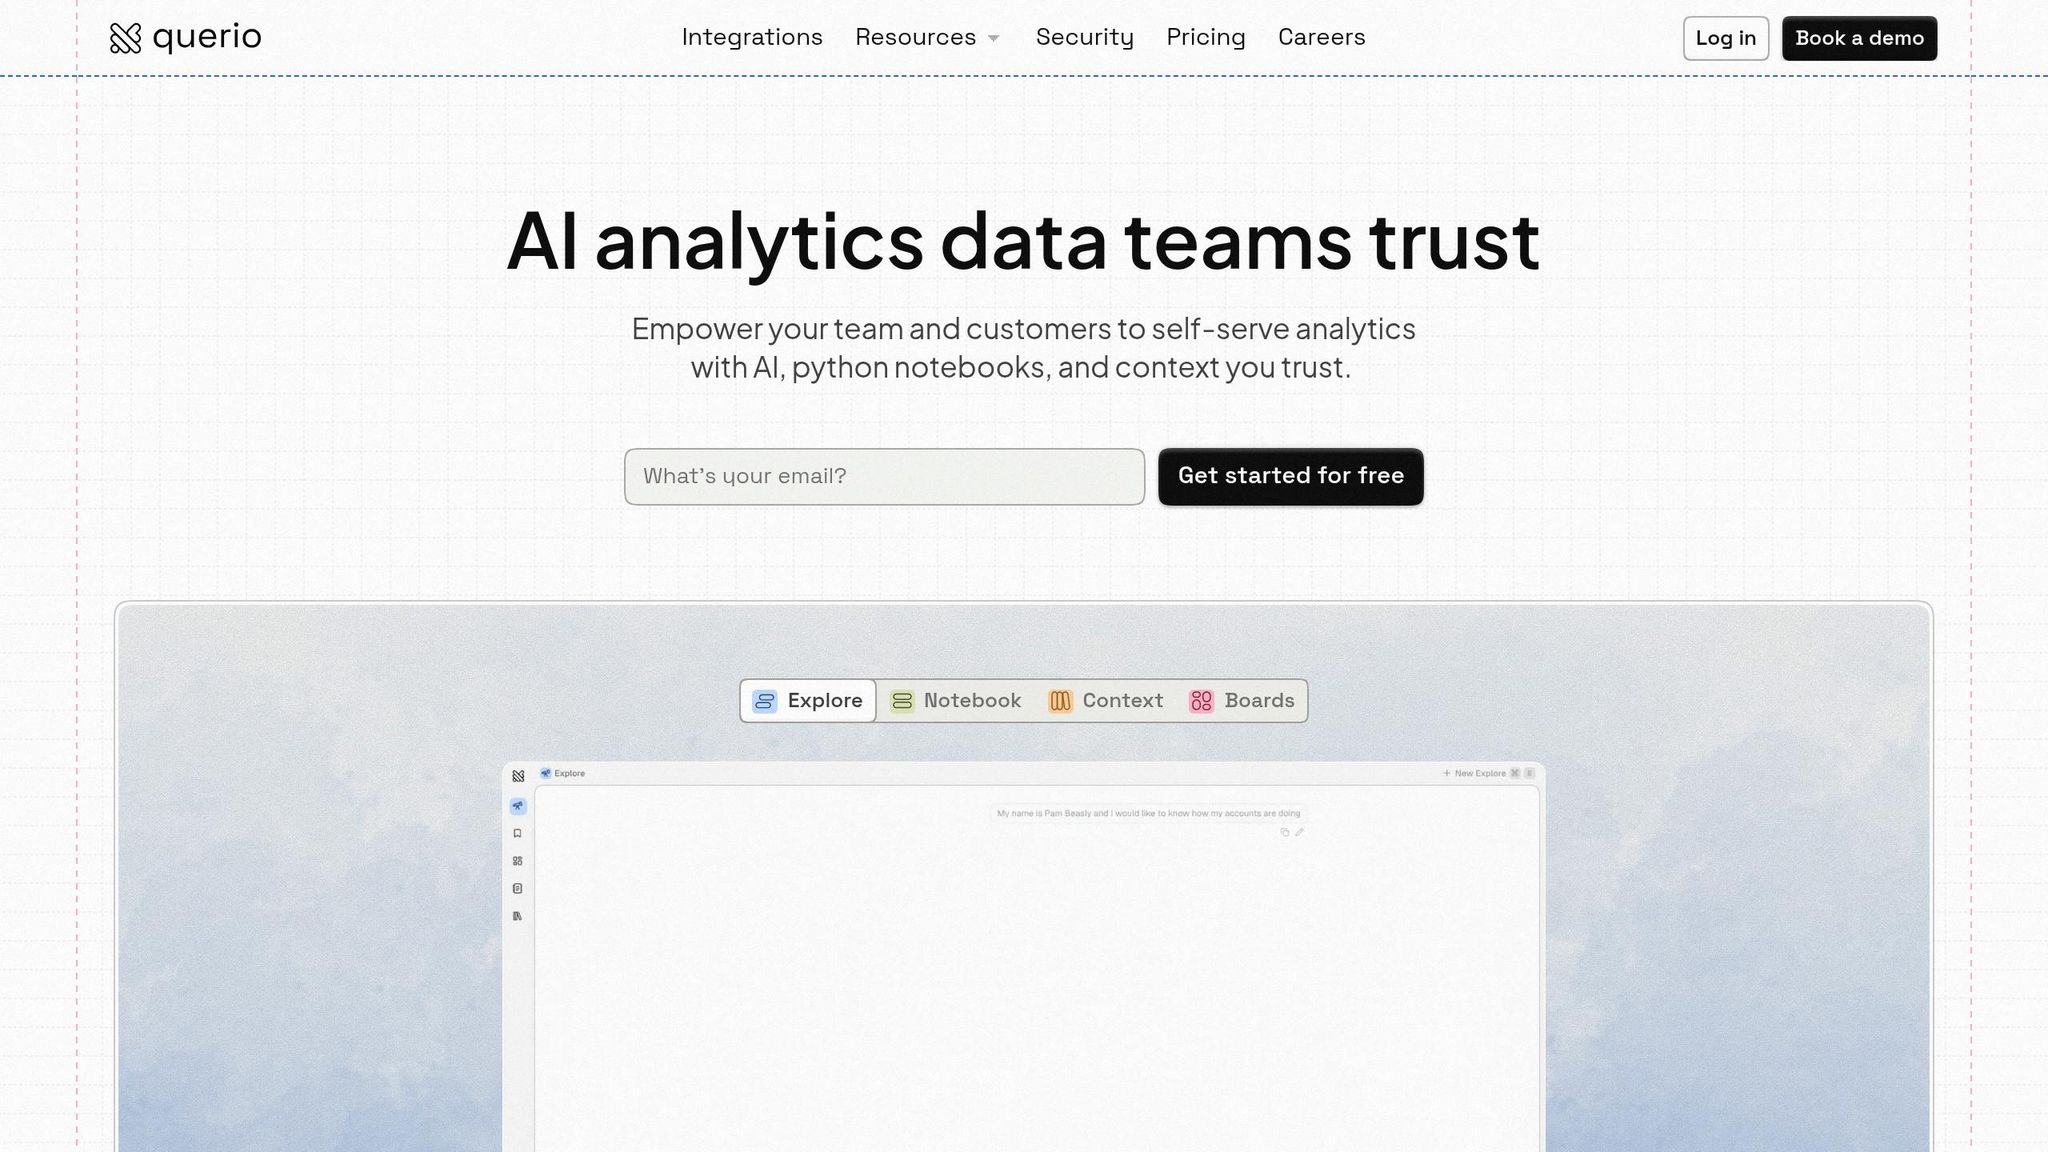
Querio makes time series analysis easier by connecting directly to your data warehouse and enabling plain English queries. By cutting out long wait times and complex analytics, it lets anyone explore trends, identify anomalies, and create forecasts using live data. At the same time, it ensures the accuracy and governance that data teams expect. Here’s a closer look at how AI is transforming data analytics to deliver real-time insights for every team.
Direct Data Warehouse Connections
Querio integrates seamlessly with data warehouses like Snowflake, BigQuery, Redshift, and ClickHouse through encrypted, read-only access. This keeps your time series data secure in its original location - no need for copies, extracts, or outdated snapshots. So, whether you're analyzing revenue trends or customer behavior, you’re working with real-time data directly from your source of truth. This setup ensures transparency and reliability for all your forecasting efforts.
AI-Powered Forecasting with Transparent Code
Querio stands out by generating inspectable SQL and Python code for every query, unlike traditional black-box AI tools. For example, when you ask for a sales forecast or a breakdown of seasonal trends, the platform translates your natural language query into verifiable code. This approach ensures your forecasts are accurate, grounded in your actual data, and open to adjustments if needed. By combining transparency with precision, Querio helps businesses make decisions they can trust.
Self-Service Analytics for All Teams
With Querio’s natural language interface, anyone can perform advanced time series analysis. Queries like "Show me revenue trends by region for the past six months" are converted into SQL or Python using pre-defined business rules through a governed context layer. This ensures metrics like "monthly recurring revenue" are calculated consistently based on your data team’s definitions. While data specialists maintain oversight of the logic, business users can quickly access insights without waiting - making it easier for everyone to work with real-time data.
Conclusion
Time series analysis plays a key role in turning ever-changing business data into actionable insights. Unlike older tools that can bog down decision-making with delays, outdated reports, and extra costs, time series analysis helps businesses uncover trends, spot seasonal patterns, and detect anomalies. This process transforms raw data into accurate forecasts that lead to smarter decisions. Companies using time series forecasting grow 19% faster than those relying on intuition alone[3]. On the flip side, 74% of executives admit they’ve made poor business decisions due to misinterpreting data charts[4].
To break free from these challenges, modern solutions are needed. Querio steps in by connecting directly to your data warehouse and letting users ask questions in plain English. Whether you’re forecasting revenue, identifying customer churn patterns, or tracking seasonal trends, Querio delivers answers in minutes - not weeks. Plus, every forecast comes with inspectable SQL and Python code, ensuring the logic behind the numbers is clear and trustworthy.
For SaaS companies managing subscription revenue, customer behavior, or operational metrics, this approach offers a meaningful edge. Data teams retain control through a governed semantic layer, while product managers, finance teams, and operations can access live data instantly. This blend of speed, clarity, and precision makes time series analysis a powerful tool for gaining a strategic advantage.
FAQs
How do I choose the right forecasting model?
Choosing the right forecasting model starts with understanding the patterns in your data. Look for elements like trends, seasonal shifts, or cyclic behaviors - these will guide your choice. For straightforward patterns, models like ARIMA can be effective. On the other hand, when dealing with more complex or non-linear data, AI-driven methods might be a better fit.
Before putting any model to work, it's crucial to test its performance. This helps confirm that the model accurately reflects your data and is ready for real-world use.
How much historical data do I need?
When deciding how much historical data you need, it all comes down to the patterns and models you're working with. To identify trends, seasonality, and cycles effectively, you’ll need a dataset that’s long enough to capture these elements. For models like ARIMA or SARIMA, longer datasets tend to yield better accuracy.
It's also essential to prepare your data properly. This means addressing any missing values and ensuring the data is stationary, as both are critical for reliable analysis. Additionally, make sure the dataset covers all relevant cycles to reflect the behavior you're trying to model.
How do I handle missing or messy time series data?
Handling time series data that's incomplete or messy requires a few essential steps. First, make sure all timestamps are consistent - any irregularities can throw off your analysis. Next, tackle missing values by either filling them in using imputation techniques or removing them altogether, depending on the situation. Outliers also need attention since they can skew results; addressing them improves overall data quality.
To stabilize trends or reduce variance, consider applying transformations like differencing or logarithms. These adjustments can make your data more reliable and ready for analysis, helping you detect patterns and improve forecasting accuracy.
Related Blog Posts


