Breaking down data silos: Unify data, empower teams, and accelerate growth
Learn practical steps for breaking down data silos to unify data, empower teams, and accelerate growth with real-world strategies.
https://www.youtube.com/watch?v=0_0bjG4lhsU
published
Outrank AI
breaking down data silos, data strategy, unified analytics, business intelligence, data governance
ee6ed75a-a6b9-449d-b873-d619bd3104fb

Breaking down data silos is all about creating a connected data ecosystem. The goal is to get information flowing freely between departments, tearing down the isolated "islands" of data that kill collaboration and cripple decision-making. It’s how you turn fragmented data points into a single, powerful strategic asset.
The Real Cost of Your Disconnected Data

Let's be clear: data silos are far more than an IT headache. They're a silent but steady drain on your bottom line. These information islands create constant friction, forcing teams to make critical decisions with only a sliver of the full picture.
Think about a classic, real-world example I've seen play out dozens of times. The marketing team is high-fiving over a massive surge in website traffic from their latest campaign. At the same time, the sales team is sounding the alarm because qualified leads have completely dried up.
From their siloed perspectives, both teams are right. But for the business as a whole? They're both completely missing the point. This kind of disconnect isn't a rare occurrence; it's the daily reality for companies bogged down by data silos.
The Financial Drain of Disconnected Data
The consequences of this data fragmentation are real, and they show up on the balance sheet. Teams waste an unbelievable number of hours manually exporting spreadsheets, trying to reconcile conflicting reports, and arguing over whose numbers are the "right" ones. This isn't just inefficient; it's a massive financial burden.
Data silos aren't just an IT problem—they're a financial black hole. On average, they drain organizations of an estimated $7.8 million annually in lost productivity from data duplication, manual wrangling, and fractured workflows.
This hidden cost comes from duplicated efforts and, worse, bad decisions made on incomplete information. When your product team has no visibility into customer support tickets or your finance team can't get real-time sales figures, you’re not just moving slow. You're actively leaving money on the table and letting growth opportunities slip through your fingers. You can learn more about how outdated systems feed into this problem by exploring the hidden costs of traditional BI platforms.
Operational Friction and Missed Opportunities
Beyond the direct financial hit, silos create deep-seated operational friction. They breed an "us vs. them" mentality between departments, where data is guarded like a state secret instead of shared as a common resource. This kills the very cross-functional collaboration you need to solve complex customer problems or spot the next big market trend.
This friction leads directly to missed strategic opportunities. It means you can't answer the most fundamental questions about your business, such as:
Which marketing channels actually bring in our most profitable customers?
What specific product features are most used by the customers who don't churn?
How do our customer support interactions truly impact lifetime value?
Getting answers requires connecting data from your CRM, product analytics, billing systems, and support platforms. When that data is locked away, these crucial questions go unanswered. Your business is left running on gut feelings and assumptions instead of hard facts.
Breaking down data silos is the essential first move to shift your organization from being reactive to proactive, turning your data into a true competitive edge.
To put the contrast in stark terms, here’s a quick look at the day-to-day reality of operating in a siloed environment versus a unified one.
Siloed vs Unified Data Environments at a Glance
Characteristic | Siloed Environment (The Problem) | Unified Environment (The Solution) |
|---|---|---|
Data Accessibility | Locked within specific departments or tools. Requires manual requests and exports. | Data is centrally available and accessible to authorized users across the organization. |
Decision-Making | Based on incomplete, often conflicting, departmental data. Leads to localized optimizations. | Holistic and data-driven. Decisions are made with a complete view of the business. |
Collaboration | Stifled. Teams operate with different "truths," leading to friction and finger-pointing. | Seamless. Cross-functional teams work from a single source of truth, fostering alignment. |
Reporting | Time-consuming and manual. Analysts spend 80% of their time finding and cleaning data. | Automated and instant. Teams spend their time on analysis and strategy, not data prep. |
Customer View | Fragmented. Marketing, sales, and support have different, incomplete views of the customer. | A true 360-degree view. Everyone sees the full customer journey and can act on it. |
Innovation | Slow. Inability to connect disparate data points means missed trends and opportunities. | Accelerated. Insights from combined datasets fuel new product ideas and market strategies. |
As the table shows, the difference isn’t just about having cleaner data—it’s about fundamentally changing how your entire organization operates, collaborates, and competes.
Where to Start? Finding and Prioritizing Your Data Silos
Trying to tear down every data silo at once is a rookie mistake. It’s a surefire way to burn out your team and achieve very little. A far better approach is to play detective first—figure out which silos are causing the most pain and which ones you can realistically tackle. This isn't just about fixing a problem; it's about creating a smart, actionable roadmap.
And this process doesn't start with a new piece of software. It starts with conversations.
Your first job is to understand how information actually moves—or fails to move—through your company. Go talk to the heads of sales, marketing, product, and finance. Ask them simple questions that get to the heart of the matter: "Where do you get your data?" and, more importantly, "Where do you get stuck?"
It won't take long to find the bottlenecks. You’ll hear things like the marketing team having fantastic campaign engagement data in their platform, but the sales team in their CRM has zero clue which leads are actually warm. That's a classic, high-impact silo right there.
Pinpoint the Business-Critical Blind Spots
Once you've got a rough sketch of your data landscape, it's time to get specific. What are the critical business questions that your current, disconnected setup makes impossible to answer? This is where you move past the technical annoyances and into the real, strategic cost of silos.
Start a running list of these high-value questions. They usually sound something like this:
Which specific product features actually lead to the highest customer lifetime value?
What’s our true cost to acquire a customer, from the first ad click all the way to the final sale?
How do customer support interactions really impact our churn rate and future purchases?
Answering any of these requires connecting the dots between different systems—product analytics with billing data, ad spend with CRM records, support tickets with user behavior. Every unanswered question on your list is a bright, flashing arrow pointing directly at a silo that needs to come down.
The fastest way to get buy-in for a data integration project is to show the C-suite the million-dollar questions they can't answer. Suddenly, it’s not a tech problem; it's a strategic imperative.
This investigative work gives you the ammunition you need to make your case. It’s no longer an abstract IT issue; it’s a list of very real, missed opportunities. A well-documented list of these blind spots is also a foundational element for building a strong data governance practice. For a deeper dive, you can learn more about how active metadata matters for modern BI and its role in making your data trustworthy and easy to find.
Scoring Your Silos for Maximum Impact
Now that you have a list of silos and the blind spots they create, you can get strategic. Let's be honest, not all silos are created equal. Some are minor headaches, while others are full-blown roadblocks to growth. The trick is to score each one on two simple axes: business impact and integration effort.
You can do this with a simple matrix. For each silo you've identified, give it a score.
Data Silo Example | Business Impact (1-5) | Integration Effort (1-5) | Priority Score (Impact / Effort) |
|---|---|---|---|
Sales CRM & Marketing Platform | 5 (High) | 2 (Low) | 2.5 |
Product Analytics & Billing System | 5 (High) | 3 (Medium) | 1.67 |
Support Tickets & Product Usage | 4 (Medium-High) | 4 (High) | 1.0 |
Finance ERP & Departmental Budgets | 3 (Medium) | 5 (Very High) | 0.6 |
This simple exercise brings instant clarity. You're hunting for the quick wins—the high-impact, low-effort projects that deliver immediate value. That value builds momentum and trust for the bigger, hairier projects down the road.
Looking at the table, connecting the sales and marketing data is the obvious place to start. This practical approach transforms a huge, daunting challenge into a focused, step-by-step plan.
Your Unification Playbook for Breaking Down Silos
Once you've zeroed in on the most problematic data silos, it's time to roll up your sleeves. Moving from diagnosis to action requires a solid game plan. Without one, even the best intentions can get swallowed by technical weeds or organizational resistance.
Breaking down data silos isn't just about connecting a few APIs. It’s a bigger play—a fundamental rewiring of how your business finds and uses information. Let's walk through the essential parts of a playbook that actually works.
Securing Genuine Organizational Buy-In
Before you touch a single data pipeline, your first job is to get real, enthusiastic buy-in from across the company. This whole effort will fizzle out if everyone sees it as just another IT project. The secret is to frame it entirely around business outcomes, not technical jargon.
Go back to that list of critical business questions you couldn't answer. Don't tell leadership, "We need to integrate the CRM and the marketing platform." Instead, show them the stakes: "We can't accurately calculate our customer acquisition cost. Fixing this could help us shift 20% of our marketing budget to channels that actually work."
You have to connect the dots for each department:
For Sales: Imagine faster lead scoring and seeing a prospect's entire journey in one place.
For Marketing: Finally, a clear picture of campaign attribution and what truly drives revenue.
For Product: Insight into how feature usage connects directly to customer lifetime value.
This simple reframing changes the entire conversation. You're no longer talking about a cost center; you're talking about a value driver. That makes getting the resources and political backing you need a whole lot easier.
The process boils down to mapping out your data, pinpointing the biggest pain points, and then scoring them to decide where to start.
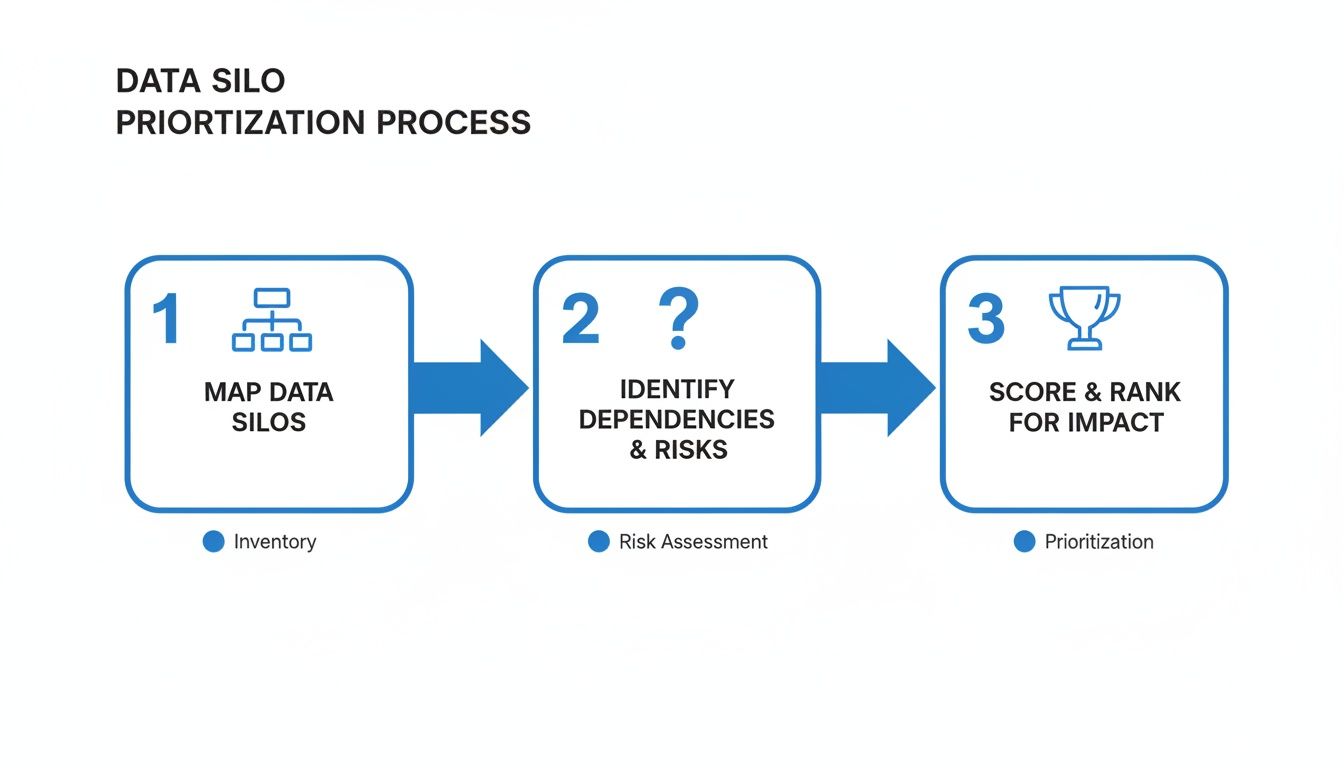
This roadmap isn't just a nice visual; it’s a strategic guide to ensure you tackle the highest-value integrations first. Quick wins build the momentum you'll need for the long haul.
Designing a Unified Data Model
At the heart of any silo-busting effort is the creation of a single source of truth. This usually starts by designing a unified data model—often called a semantic layer—that standardizes the language your business uses to talk about itself.
Think about it: what does an "active user" really mean? Someone who logged in this month? Someone who used a key feature? Your marketing, product, and finance teams probably have three different answers. As long as that's the case, your reports will never agree.
The goal here is to get everyone on the same page by establishing one official definition for your core metrics and entities. This involves a few key steps:
Identify Core Business Entities: Pinpoint the fundamental "nouns" of your business—things like Customers, Subscriptions, Products, and Tickets.
Define Key Metrics: Nail down the critical "verbs" and measurements, such as Revenue, Churn Rate, Engagement Score, or Customer Lifetime Value.
Document the Logic: Write down exactly how each metric is calculated and which data sources feed into it.
A unified data model is your organization's Rosetta Stone. It ensures that when a product manager talks about 'user engagement,' they mean the exact same thing as the data analyst running the churn report.
This central library of definitions becomes the bedrock for all of your analytics. Modern tools like Querio can seriously speed this up by building a semantic layer that maps all the messy, raw data from different systems into clean, business-friendly terms. You can get a deeper dive into this foundational idea by checking out our guide on semantic layers and their key benefits.
Choosing the Right Integration Strategy
With a unified model defined, the next challenge is actually connecting the pipes. There are a few well-trodden paths for data integration, and the right one for you will depend on your company's size, technical setup, and what you need to achieve right now.
ETL (Extract, Transform, Load): The classic approach. Data gets pulled from a source system (like Salesforce), reshaped into a standard format, and then loaded into a central data warehouse. It’s dependable and great for historical analysis, but it can be slow to adapt.
ELT (Extract, Load, Transform): A more modern twist where you load raw data into the warehouse first and handle transformations later. This is far more flexible and takes full advantage of the muscle behind today's cloud data warehouses.
Reverse ETL: This is a game-changer. It’s all about sending enriched, unified data from your warehouse back into the tools your teams live in every day. Think about pushing a calculated "propensity to churn" score from your data warehouse directly into your CRM, right on the customer's profile for the sales team to see.
Data Federation/Virtualization: Instead of moving data, this method queries data right where it sits. It can give you a unified view without the heavy lifting of building a central repository. It’s quick to set up but can sometimes hit performance snags at scale.
For most companies today, a smart combination of ELT for centralization and Reverse ETL for activation is the sweet spot. You get a reliable source of truth and a practical way to get those insights into the hands of people who can act on them.
Implementing Practical Data Governance
Finally, you can’t break down silos without thinking through data governance and access. The goal is to empower people, not to create a data free-for-all that compromises security or privacy.
Good governance isn't about locking everything down. It's about getting the right data to the right people for the right reasons. This starts with assigning clear ownership for key data assets. Who’s on the hook for the accuracy of customer data? Who owns the official definition of product usage? Clear owners eliminate confusion and dramatically improve data quality over time.
This isn’t just a niche idea; it’s a major trend. A recent Demand Gen Report survey found that 50% of organizations now have a single source of truth for their sales and marketing data—a massive leap forward from the fragmented past.
Modern BI platforms make this so much easier. With a tool like Querio, you can set up role-based access controls that dictate who can see what. You could give the marketing team free rein over campaign data while completely hiding sensitive financial metrics from them. This is how you democratize data safely, building a culture of self-service analysis without giving your security team a heart attack.
Using AI-Powered Analytics to Accelerate Unification

Connecting all your data sources is a huge win, but it’s only half the battle. The real magic happens when you make that unified data instantly accessible and genuinely useful to everyone in the organization. This is where modern, AI-powered analytics platforms come in, turning the hard work of breaking down data silos into an immediate competitive advantage.
Forget waiting days or weeks for an analyst to merge spreadsheets. What if your teams could get answers themselves, right now? This isn't some futuristic idea; it's how top companies operate today.
The reality is that data silos are still a massive headache. A shocking 19% of a company's data is often siloed, hidden, or completely unusable. It’s no surprise that over 80% of leaders point to this exact problem as a blocker for their AI initiatives, creating incomplete customer views and costing them real money. You can get more details on these data and analytics trends from Salesforce.
Moving from Data Wrangling to Instant Answers
Traditional business intelligence is stuck in a frustrating cycle. A product manager has a question, they file a ticket, and then they wait. And wait. An expert has to write SQL, join a bunch of tables, and eventually send back a static report. By the time it arrives, the opportunity to act has often vanished.
AI-powered analytics completely flips this script. These tools plug directly into your various data sources—the CRM, product database, billing system—and build a deep, contextual understanding of your entire business. This lets non-technical users simply ask questions in plain English and get trusted answers back in seconds.
Here’s a common scenario I've seen play out:
The Question: A marketing lead asks, "Show me our top-performing ad campaigns from last quarter, but only for customers with a lifetime value over $500."
The Old Way: This request would mean pulling data from Google Ads, Salesforce, and Stripe. An analyst would have to manually join everything, which could easily eat up a few days.
The AI-Powered Way: The user just types that question into a platform like Querio. The AI already understands the relationships between campaigns, customers, and revenue. It queries the unified data on the fly and serves up an interactive chart in seconds.
This is so much more than a speed boost; it fundamentally changes who gets to play with data. It empowers the people with the most business context to find their own answers, which frees up your data team to tackle the truly complex, strategic challenges. For a closer look at the mechanics, check out our guide on how AI improves data integration workflows.
AI That Understands Your Business Context
The best AI analytics tools don't just understand language; they learn the language of your business. They know what a "churned user" is, how "monthly recurring revenue" is calculated, and which product events signal high engagement. This business context is the secret ingredient that makes the answers reliable.
A simple, natural-language prompt in Querio can generate a complex visualization by pulling from multiple, previously siloed sources.
The platform isn't just showing you a single dataset; it's synthesizing information to answer a complex business question on the spot. This capability turns what used to be a week-long analysis project into a task you can knock out in a few minutes.
This unlocks a far more interactive and curious way of working with data. A user can ask a follow-up like, "Now break that down by customer segment," and the AI maintains the context of the original query to provide a deeper insight instantly.
AI analytics acts as a translator between your team's curiosity and your complex, unified data. It makes sophisticated analysis accessible to everyone, not just the experts.
This kind of self-service capability has a profound impact. It fosters a culture of data-driven curiosity, encouraging team members to explore information and validate their gut feelings without creating a bottleneck. It’s the ultimate acceleration layer for all your data unification efforts.
Measuring Success and Sidestepping Common Pitfalls
Let's be realistic: a project to break down data silos is never truly "done." It’s a commitment to a new way of working. Once you’ve made those initial connections and people start seeing the early wins, your focus has to shift. Now it's all about measuring what's working and getting ahead of the problems that are bound to pop up.
Without solid metrics, you're just hoping for the best. You need to prove the project’s value, and gut feelings won't convince your CFO. Your success needs to be anchored in clear Key Performance Indicators (KPIs) that connect directly to business outcomes.
Defining Your Key Performance Indicators
Tracking the right KPIs is how you turn this initiative from a perceived cost center into a proven value driver. These aren't just vanity metrics; they're the vital signs of a data-driven organization.
Your first move should be to focus on metrics that track speed, user adoption, and tangible business impact. Here are a few I've seen work exceptionally well:
Time to Insight: How long does it actually take a marketing manager to go from asking "which campaigns drove the most Q2 signups?" to getting a trustworthy answer? Measure this before and after your changes. A dramatic reduction is one of your most powerful proof points.
Self-Service Analytics Adoption Rate: What percentage of your product team is now building their own dashboards instead of emailing the data team? Tracking active users on your BI platform, like Querio, gives you a hard number. High adoption means you've built something people actually want to use.
Reduction in Manual Reporting Hours: Just ask your teams. Find out how many hours they sink into copy-pasting data into spreadsheets every week. When that number drops by 80%, you’ve just handed dozens—or hundreds—of hours back to the business. That's a direct impact on the bottom line.
Data Asset Usage: An AI-powered platform like Querio can show you exactly which unified datasets are being hit the most. If your newly combined "customer 360" view is getting queried constantly, you know you've hit a home run.
The ultimate goal isn't just to connect data sources; it's to shorten the distance between a question and a decision. If your KPIs show you're doing that, you're on the right track.
This is the data you’ll use to justify the next phase of investment and show leadership that their bet is paying off.
To give you a more structured view, here are some key KPIs that data leaders should have on their dashboards to monitor the health and ROI of their unification efforts.
Key KPIs for Measuring Data Unification Success
KPI | What It Measures | How to Track It |
|---|---|---|
Time to Insight | The end-to-end time from a business question to a data-backed answer. | Conduct baseline time studies before the project and repeat quarterly. Track ticket resolution times for data requests. |
Self-Service Adoption Rate | The percentage of target users actively using the BI platform without data team assistance. | Monitor active user logins, query execution, and dashboard creation within your BI tool (e.g., Querio's usage analytics). |
Reduction in Manual Reporting | The decrease in time employees spend on manual data aggregation and reporting tasks. | Pre- and post-initiative surveys with key teams (Finance, Marketing, Ops) to quantify hours saved. |
Data Trust Score (NPS-style) | User confidence in the accuracy and reliability of the centralized data. | Run a simple quarterly survey asking users to rate their trust in the data on a scale of 1-10. |
Data Asset Utilization | Which unified datasets are most frequently used and provide the most value. | Use the BI platform’s metadata to track query frequency and user counts for key tables and views. |
Cross-Functional Queries | The number of queries that join data from two or more previously siloed departments. | Analyze query logs to identify joins across distinct data sources (e.g., Salesforce and Zendesk data). |
Tracking these metrics gives you a powerful narrative backed by hard evidence, making it much easier to communicate the project's ongoing value to the rest of the organization.
Navigating the Most Common Pitfalls
Even the most well-architected projects can get derailed. From my experience, the failures are almost never about the technology—they’re about the people. Knowing where the landmines are is the best way to avoid them.
Pitfall 1: Overlooking Team Culture
This is the classic mistake. You can roll out a brilliant, unified data platform, but if your marketing team still secretly protects "their" lead data, you haven't solved the core problem. The cultural change is just as, if not more, important than the technical plumbing.
How to Sidestep It: Create a 'Data Champions' Program Don't rely on a top-down mandate. Instead, find those people in each department who are genuinely excited about data. Give them early access, extra training, and a direct line to the project team. They become the on-the-ground evangelists who can show their peers, in their own language, why this new system makes their lives easier. Grassroots momentum is far more powerful than any executive decree.
Pitfall 2: Neglecting Data Ownership
Once all the data is in one place, it's easy for accountability to get fuzzy. When no one is officially responsible for the quality of the "customer" data model, it will slowly but surely degrade. Outdated fields, duplicate entries, and unclear definitions creep in, and before you know it, trust evaporates. People will retreat to the safety of their old spreadsheets.
How to Sidestep It: Assign Clear Data Stewards For every critical data domain—Product, Sales, Finance, Marketing—assign an official "steward." This isn't a gatekeeper role. The steward's job is to be the definitive expert, ensuring the data is accurate, well-documented, and logically defined for everyone to use. This simple step eliminates the finger-pointing and creates a culture of shared responsibility.
Your Questions About Data Silos Answered
So, you're ready to start unifying your company's data. That's a great first step, but it's also where the real-world questions start popping up. When the theory hits the road, teams immediately ask about where to start, what a realistic timeline looks like, and who needs to be involved.
Let's cut through the noise. Here are the most common questions we hear, with direct answers to help you get moving.
Where Should We Start With Dozens of Silos?
Seeing a map of dozens of disconnected systems is enough to make anyone feel overwhelmed. The biggest mistake you can make is trying to tackle everything at once—that "boil the ocean" strategy almost never works.
My advice? Go back to the prioritization framework we talked about earlier and pick the single most valuable connection you can make. Just one.
For most businesses we see, the most critical link is between product usage data and revenue data. This is where the money is. Connecting these two finally lets you answer make-or-break questions like, "What are our highest-paying customers actually doing in the product?"
Nailing this first connection does more than just give you powerful insights. It delivers a quick, visible win that builds incredible momentum. You prove the value immediately, which makes getting buy-in for the next project a whole lot easier.
How Long Does Breaking Down a Major Silo Take?
This is the classic "it depends" question, but I can give you some real-world benchmarks. If you go the traditional route and build a massive data warehouse from scratch, you're easily looking at 6 to 12 months before a single business user sees a useful report. Honestly, that kind of timeline kills most projects before they even get off the ground.
But modern AI-powered BI platforms have completely changed the game. The whole point is to shorten that "time to value" from months to days.
The goal isn't perfection; it's progress. You can connect a couple of key data sources and start pulling unified insights in a matter of days or weeks, not quarters.
This approach gives the business immediate value while you continue the heavier, foundational infrastructure work in the background. It keeps everyone happy and engaged because they see a continuous return on the investment.
Do We Need a Dedicated Data Engineering Team?
If you're launching a massive, enterprise-wide data infrastructure overhaul, then yes, you absolutely need dedicated data engineers. Their expertise is non-negotiable for building something that's truly robust and scalable for the long haul.
But here’s the good news: you don't have to wait for them to start getting answers.
Modern analytics tools were created for the people who actually know the business inside and out—your data analysts, product managers, and ops leaders. These platforms give them simple, intuitive ways to:
Plug in data sources without needing to write a ton of code.
Unify data at the analytics layer, which acts as a virtual source of truth.
Run their own analyses, empowering the whole team to be self-sufficient.
This model lets your business teams move incredibly fast. They can answer their own questions without getting stuck in a six-month engineering backlog, which speeds up decision-making for everyone.
Ready to stop waiting for answers and start unifying your data in minutes? Querio’s AI-powered analytics platform lets your team ask questions in plain English and get trusted insights from all your data sources instantly. See how Querio can break down your data silos today.

