Business Intelligence
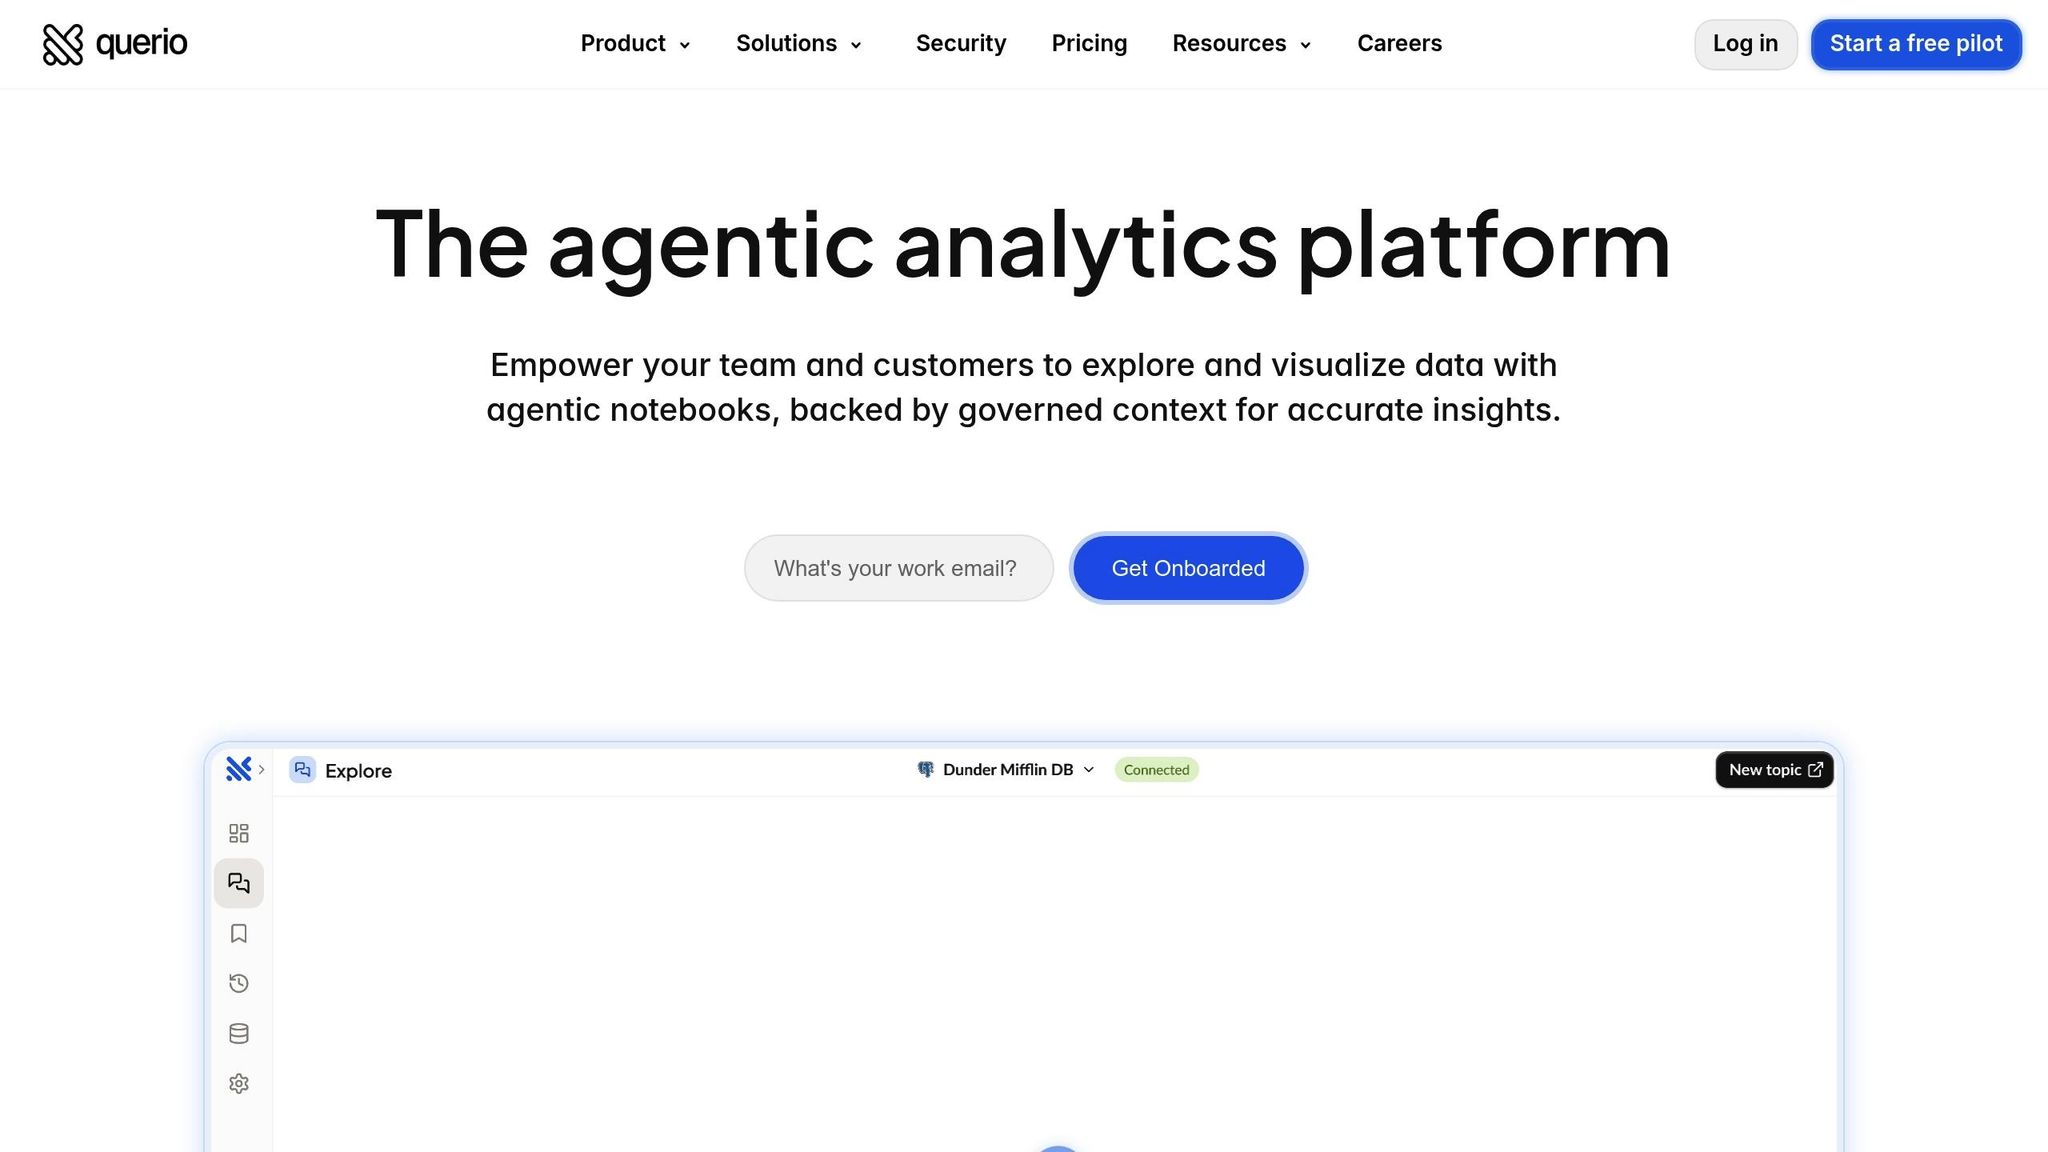
Analyst-Grade Dashboards Without Analysts
Build real-time, analyst-grade dashboards without SQL. Ask in plain English, connect to Snowflake or BigQuery, use standardized metrics and strong security.
Businesses often face delays turning data into actionable insights due to reliance on analysts for dashboards and reports. Querio addresses this by enabling non-technical users to create real-time dashboards and reports through plain English queries, eliminating the need for coding or complex tools. Users can ask questions like, "What were our top-selling products last quarter?" and instantly receive visualized insights.
Key Benefits:
Faster Insights: Avoid waiting weeks for analysts; get answers in seconds.
Ease of Use: No SQL or technical skills required - just type your question.
Real-Time Data: Connects directly to data warehouses like Snowflake and BigQuery.
Standardized Metrics: Ensures consistent reporting with centralized definitions.
Enhanced Collaboration: Unlimited viewer access for organization-wide visibility.
Querio also supports modern business intelligence and data warehousing features like Python notebooks for data teams, embedded analytics, and strong security measures (SOC 2, GDPR, HIPAA compliance). This tool empowers businesses to make quicker, data-driven decisions while freeing analysts to focus on high-value tasks.
Create Dashboards in Seconds With AI (It's Mind-Blowing 🤩)
Problems with Traditional Dashboard Creation
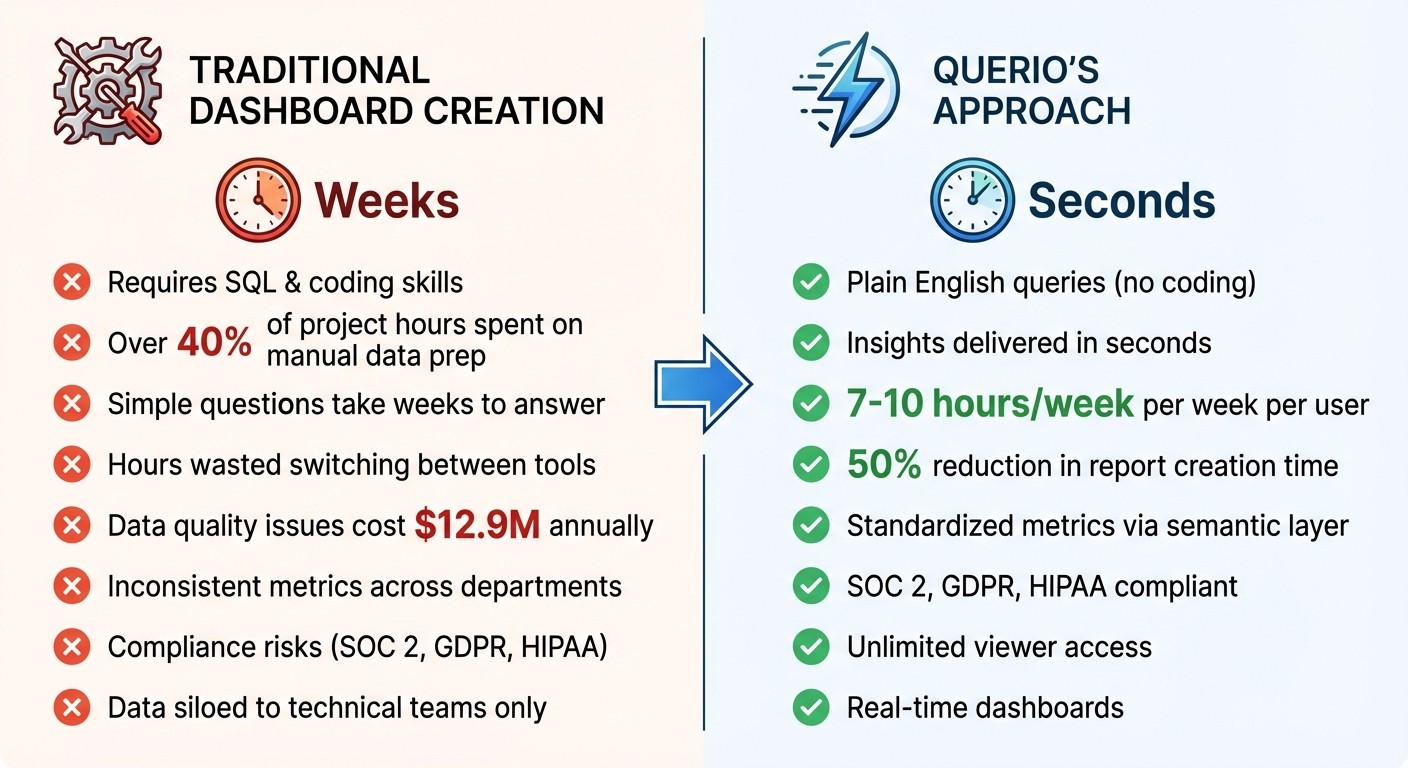
Traditional Dashboard Creation vs Querio: Time and Efficiency Comparison
Traditional dashboard creation often limits direct access to data, creating a frustrating experience for non-technical users. Building dashboards typically requires skills like SQL, database expertise, and proficiency with complex BI tools - skills most employees don’t have. This means marketing managers can’t easily access conversion metrics, finance teams struggle to segment revenue data, and product managers are left waiting for engagement trends. The reliance on analysts creates bottlenecks, slowing down decisions and impacting productivity across departments. Let’s break down the benefits and challenges of self-service BI, from technical hurdles to governance risks.
Requiring Technical Skills
The need for SQL and coding knowledge locks many employees out of their own company’s data. Sales directors, operations teams, and customer success managers often have to depend on analysts to access critical performance metrics. This reliance eats up time - over 40% of project hours are spent on manual data prep rather than analysis or decision-making. This technical barrier prevents teams from acting quickly and efficiently.
Slow Insights and Decision-Making
When analysts are overwhelmed with requests, even simple questions can take weeks to answer. Small data teams are often buried under a mountain of dashboard requests, forcing other teams to wait. Meanwhile, employees waste hours switching between tools, manually copying data, reformatting spreadsheets, and updating charts. By the time dashboard data analytics are delivered, they’re often outdated, as market conditions may have already changed.
Inconsistent Data and Governance Problems
Without clear, standardized definitions, different departments end up calculating the same metrics in different ways. For example, finance might define "revenue" one way, sales might use another formula, and product might have yet another interpretation. This leads to conflicting reports, eroding trust in the data. Poor data quality isn’t just an inconvenience - it’s expensive, costing companies an average of $12.9 million annually in errors and rework. Traditional tools also lack proper visibility, making it hard to track who’s accessing what data. This creates compliance risks for organizations bound by regulations like SOC 2, GDPR, or HIPAA. Breaking down data silos, accessible only to technical teams, leaving everyone else dependent on analysts for even basic queries.
How Querio Simplifies Dashboard Creation
Querio removes the usual hurdles of dashboard creation that often demand a dedicated analyst. Forget waiting days - or even weeks - for SQL queries and custom reports. With Querio, anyone in your team can ask questions in plain English and get accurate, real-time charts in seconds. The platform connects directly to your data warehouse, pulling live data without duplicating or moving it. Here’s how Querio transforms the process of building dashboards.
Ask Questions in Plain English
Querio makes it easy for users to interact with their data. Simply type a question like, "What were our top-selling products last quarter?" Querio uses SQL automation to instantly convert your query, retrieves the data from your warehouse, and presents it as a clear, visual chart. Whether it’s a marketing manager checking conversion rates, a finance team analyzing revenue segments, or a product manager monitoring engagement trends, anyone can access insights without relying on an analyst.
"I immediately started saving 7-10 hours a week!" - Guilia Acchioni Mena, Co-Founder, Zim
Build Dashboards with Drag-and-Drop
Once your charts are ready, you can easily pin them to shared dashboards using Querio’s drag-and-drop interface. The platform even chooses the most suitable visualization for your data - like bar charts for comparisons or line charts for trends. Need to tweak the visuals? Querio’s formatting panel lets you adjust colors, filters, and axes effortlessly. Plus, dashboards update in real time, eliminating the need for manual refreshes.
Standardized Definitions with the Semantic Layer
Querio also simplifies self-service BI by centralizing data definitions through its semantic layer. Data teams can set up standardized metrics, table joins, and business terms. For instance, defining an "active customer" as someone who purchased within the last 90 days ensures consistency across all teams. This shared framework eliminates confusion, aligns reporting, and reduces the need for constant analyst intervention.
Advanced Features for Data Teams and Enterprises
Querio doesn’t just cater to non-technical users - it’s also packed with tools designed for data teams handling intricate, large-scale analyses. These features ensure your organization can address complex reporting demands while maintaining consistent governance and security across the board.
Building on its intuitive dashboards, Querio provides data teams with the capabilities to dive into detailed and advanced analytics.
Python Notebooks with AI Assistance
Querio’s built-in Python notebook combines SQL and Python, enhanced with AI-generated code to streamline report creation. By cutting the time needed to create reports by 50%, it allows data teams to focus on deeper insights. The Context Control feature centralizes key definitions, ensuring that the generated code is accurate and aligned with your data needs. This setup not only supports technical users but also equips non-technical users to begin exploring SQL and Python tools on their own.
"Querio slashes reporting time with copilot SQL and Python workflows in your BI tool, letting your team churn out polished reports fast so you can beat deadlines and clear backlogs effortlessly." - Querio
Embedded Analytics and Scheduled Reports
With Querio, you can embed dashboards directly into your applications using embedded analytics tools or CRMs using powerful data APIs and theme tokens that seamlessly match your design system. This allows users to access live, actionable insights without ever leaving their workflow. For executives who rely on regular updates, Querio supports scheduled reports that deliver refreshed insights automatically - whether daily, weekly, or monthly. This eliminates the need for manual updates while keeping leadership consistently informed.
On top of these features, Querio ensures every data interaction is protected by robust security measures.
Enterprise Security and Unlimited Viewers
Querio meets stringent compliance standards, including SOC 2 Type II, GDPR, CCPA, and HIPAA, making it a trusted choice for industries like healthcare, finance, and government. All connections are secured with AES-256 encryption and read-only credentials, ensuring that your source data remains untouched. Additionally, Querio guarantees that customer data is never stored, shared, or used to train Large Language Models.
With Role-Based Access Control (RBAC), administrators can assign specific permissions, ensuring users only access data relevant to their roles. Unlike traditional BI tools that charge per user, Querio offers unlimited viewer access on all plans, enabling organization-wide data visibility without skyrocketing costs. This makes it a competitive alternative when you compare AI BI tools like ThoughtSpot or Sigma.
How to Deploy Querio in Your Organization
Setup Process Step-by-Step
Getting started with Querio is quick and straightforward. Begin by connecting your data warehouse through Querio's secure, read-only integrations with platforms like Snowflake, BigQuery, and Postgres. With encrypted credentials, there’s no need for data duplication or complicated ETL processes. Once connected, Querio automatically identifies your tables and fields, removing the hassle of manual setup.
Next, use Querio's Context Layer to define your business-specific framework. Map out table relationships, introduce key terms like CAC, MRR, or churn rate, and create a glossary for standardized metrics. This step ensures Querio understands your unique data structure. For instance, if someone asks, "Show quarterly sales by region", Querio can pinpoint the right tables and calculate "sales" based on your pre-defined rules.
From there, you can build your first dashboard by simply asking questions like, "Display weekly sales data for Q4 2024." Querio converts these requests into SQL queries and generates visual charts. You can then organize these AI-generated visuals into interactive dashboards that update in real time, giving you instant, actionable insights - all within minutes.
Best Practices for Dashboard Governance
Once Querio is up and running, establishing solid governance practices is key to maintaining consistent and reliable insights across your organization. Your Context Layer acts as the backbone of trustworthy reporting. Define essential metrics, such as revenue or customer lifetime value, once in the Context Layer. This ensures every dashboard uses the same definitions, preventing inconsistencies across departments.
Use Role-Based Access Control (RBAC) to limit data visibility based on team roles. Querio also supports field-level encryption and audit logging to monitor data access, which is especially useful for industries with strict compliance requirements. To maintain data accuracy as your organization grows, consider forming a data governance committee to review and approve new metric definitions.
Getting the Most from Querio
To unlock Querio’s full potential, integrate it into your team’s daily routines. Focus on high-impact areas where faster insights can make an immediate difference, such as revenue tracking, optimizing delivery routes, or evaluating marketing campaigns. Train your teams to use natural language processing in BI, enabling them to find answers independently without relying on analysts.
Set up automated reports to deliver updated insights to executives on a daily, weekly, or monthly schedule. Configure alerts to notify you when critical KPIs hit specific thresholds, and enable cross-filtering on your dashboards so clicking one data point dynamically updates related charts. These features can dramatically improve reporting efficiency and operational decision-making.
For more advanced users, Querio offers native Python notebooks for in-depth statistical analysis and machine learning on governed data. Plus, with unlimited viewer access included in every plan, you can share data insights widely across your organization without worrying about per-user licensing fees. This makes it easier to democratize data and empower teams at every level.
Conclusion
Querio transforms how businesses approach intelligence by providing instant, analyst-grade dashboards - no specialists or extended development cycles required. It breaks down technical barriers, enabling everyone from marketing managers to finance teams to access clear, dependable insights effortlessly.
With its Context Layer, Querio centralizes metric definitions, ensuring all reports stay consistent. For data teams, this means fewer backlogs and more time to focus on strategic projects instead of repetitive tasks. For organizations, it translates to quicker decisions, less reliance on technical teams, and a workplace where every department can tap into reliable insights every single day.
"What used to be a week-long process now takes minutes." - Jennifer Leidich, Co-Founder & CEO, Mercury
FAQs
How does Querio protect sensitive data and comply with regulations like GDPR and HIPAA?
Querio employs a robust security framework to protect sensitive information. This includes encryption for data both during transmission and while stored, along with role-based access controls to restrict data access to authorized personnel. The platform also undergoes constant monitoring, using automated compliance checks and regular audits to uphold stringent security measures.
Built to align with strict regulatory standards like GDPR and HIPAA, Querio ensures compliance through well-documented governance protocols. These include data cataloging, breach notification procedures, and safeguards for protected health information (PHI). With these measures in place, your business data remains secure, accurate, and compliant with both U.S. and international regulations.
Can Querio integrate with popular data warehouses like Snowflake and BigQuery?
Querio works effortlessly with top data warehouses like Snowflake and Google BigQuery. This means you can plug your existing data sources directly into Querio, giving you real-time data visualization and insights without relying on extra tools or tedious manual steps.
These integrations keep your workflows smooth and ensure your dashboards always show the latest information, helping you make faster, more informed decisions based on data.
What advantages does Querio's Context Layer offer for managing and standardizing metrics?
Querio's Context Layer acts as a dependable hub for all your key performance indicators (KPIs). It takes raw data and translates it into straightforward business terms like "Monthly Revenue", ensuring consistent calculations - such as year-over-year growth - are applied across your organization. This consistency eliminates the confusion caused by conflicting formulas, minimizes errors, and ensures every team, from finance to marketing to product, operates with the same reliable numbers.
Beyond simplifying metrics, the Context Layer enhances data governance by managing how metrics are defined and accessed. With role-based permissions, you can control who can view or edit specific data, while built-in data masking ensures sensitive information stays protected. Plus, its optimized query translations boost performance, cutting down on delays and delivering insights faster.
By standardizing metrics, Querio's AI engine enables instant, precise visualizations, automated anomaly detection, and natural-language insights. This makes it easier for non-technical users to confidently make data-driven decisions, while analysts can spend more time tackling complex, strategic challenges.
Related Blog Posts


