Business Intelligence
Omni vs Looker (2026): Migration Realities and Costs
Migration between BI platforms costs mainly model rewrites, dashboard rebuilds, and parallel runs — not data movement.

If you switch between Omni and Looker in 2026, the main cost is not data movement. It’s model rewrite, dashboard rebuilds, permission checks, and running both tools at once.
If I had to boil this article down to a few numbers, it would be this:
- Timeline: about 6 to 10 weeks for smaller mid-market setups, and 10 to 16 weeks for larger ones
- Cutover buffer: expect a 30- to 90-day dual-run period
- Biggest risk: semantic-layer mismatch, especially for finance KPIs, row-level security, and embedded analytics
- Budget pressure points: internal labor, license overlap, warehouse compute, LookML training or hiring, and parity testing
- Main tradeoff: Omni’s YAML model can feel easier to work with, while Looker puts more weight on LookML rules and governed metrics
Here’s the short version:
- If your team has a deep semantic layer, a lot of embedded analytics security, or strict access rules, migration work can grow fast.
- If your dashboard estate is messy and trust in metrics is low, a move may still make sense.
- The safest path is usually a phased rollout with a 30-day shadow run and hard parity checks before cutover.
Quick Comparison
| Criteria | Omni | Looker |
|---|---|---|
| Semantic model | YAML-based | LookML-based |
| Main migration pain | Rewriting model logic into another structure | Rebuilding into stricter LookML rules |
| Dashboard transfer | Partial | Partial |
| Permissions/RLS | Needs remapping | Needs remapping |
| Embedded analytics tools | Often rebuilt | Often rebuilt |
| AI workflow transfer | Limited | Limited |
| Skill ramp | YAML/data modeling skills | LookML skill set often needed |
| Cost drivers | Rebuild time, validation, overlap | Rebuild time, validation, overlap, LookML staffing |
My takeaway: this is less a feature comparison and more a rewrite-and-risk exercise. If you’re making the call, I’d focus on three things first: how much semantic logic you own, how many dashboards people use every day, and how long you can afford to run both systems side by side.
sbb-itb-284a532
Omni vs Looker: the architectural differences that drive migration work
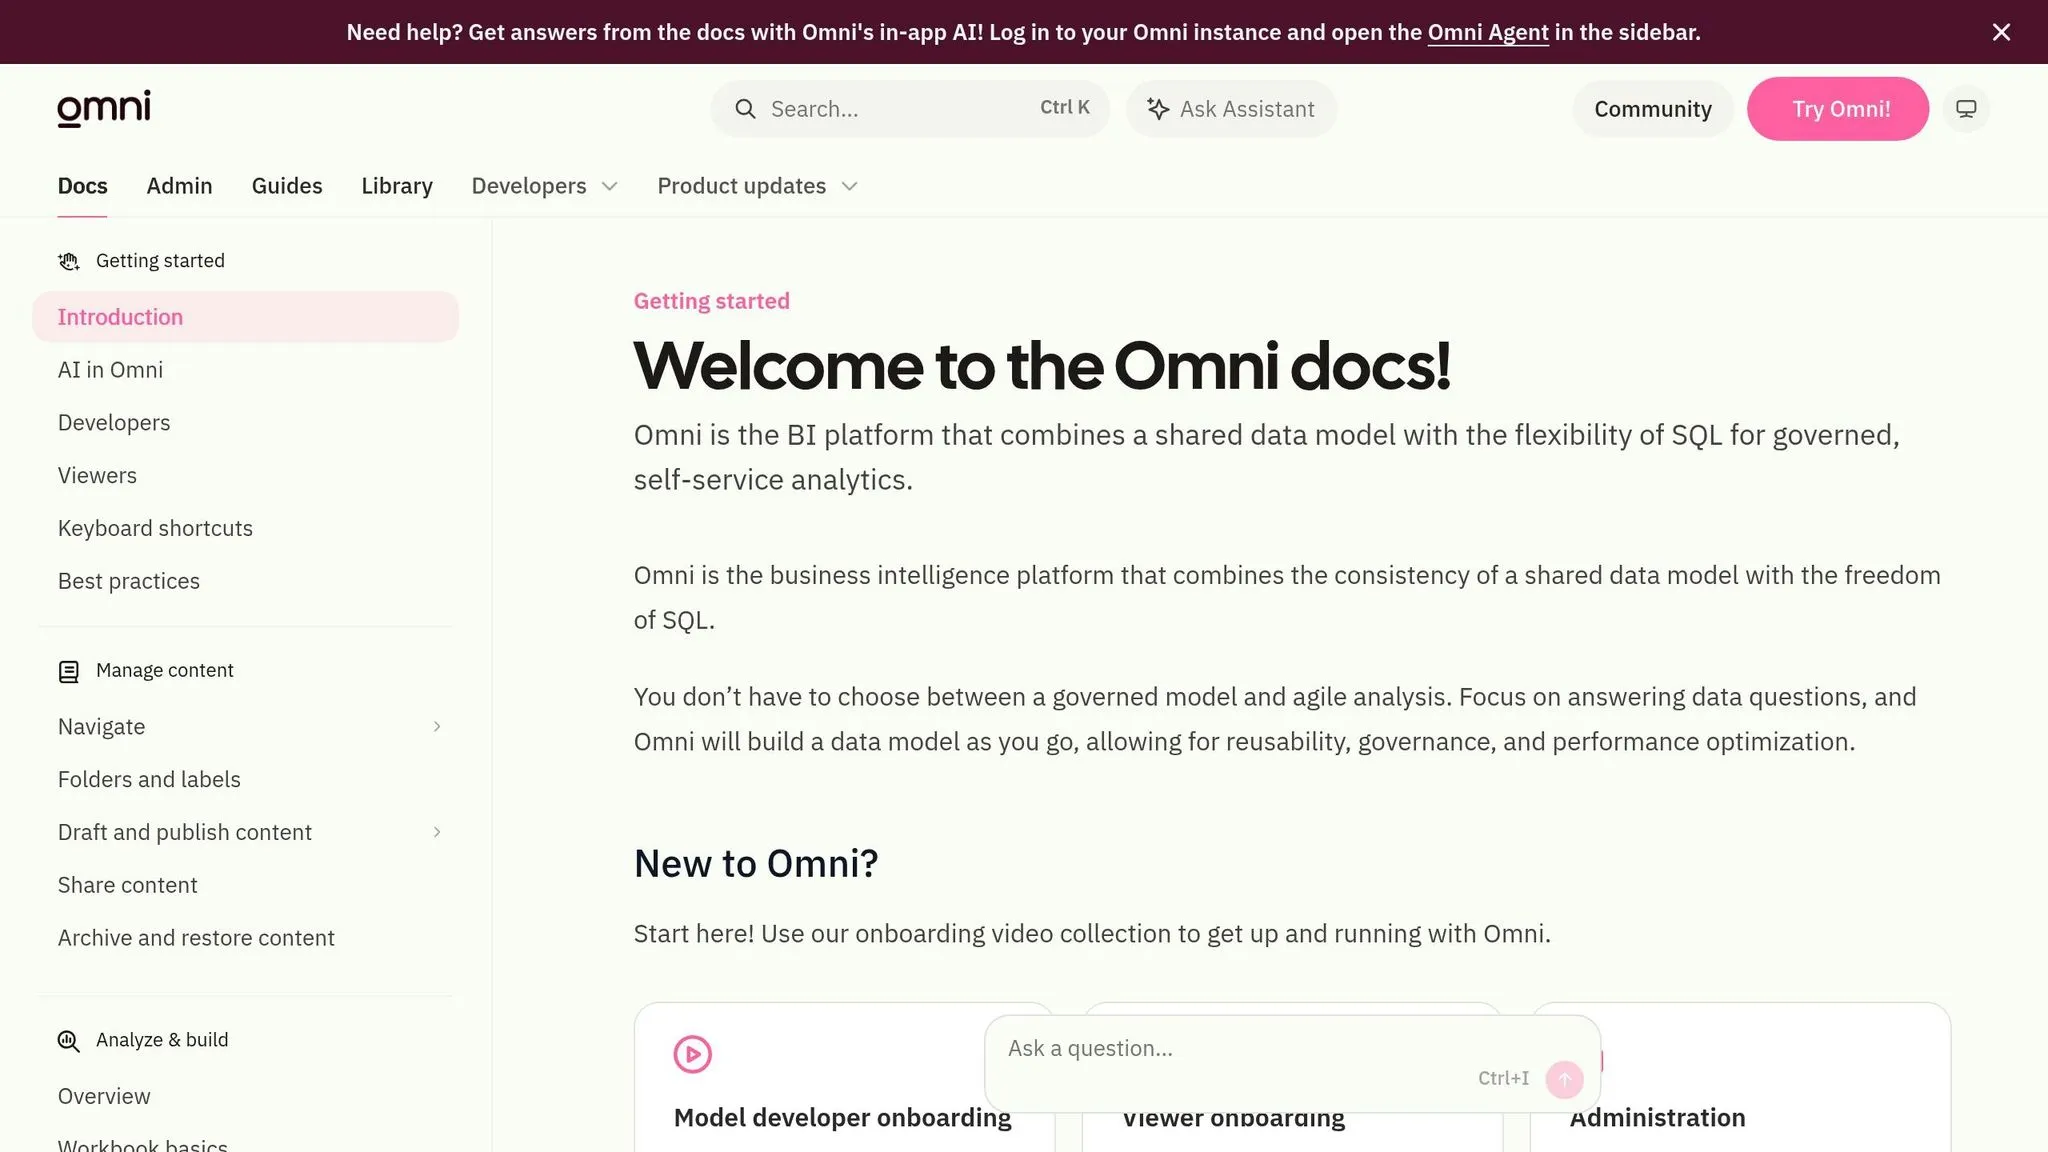
The main cost in a migration isn't moving data. It's translating semantic logic, permissions, and embeds.
Semantic model differences: LookML vs Omni's YAML model
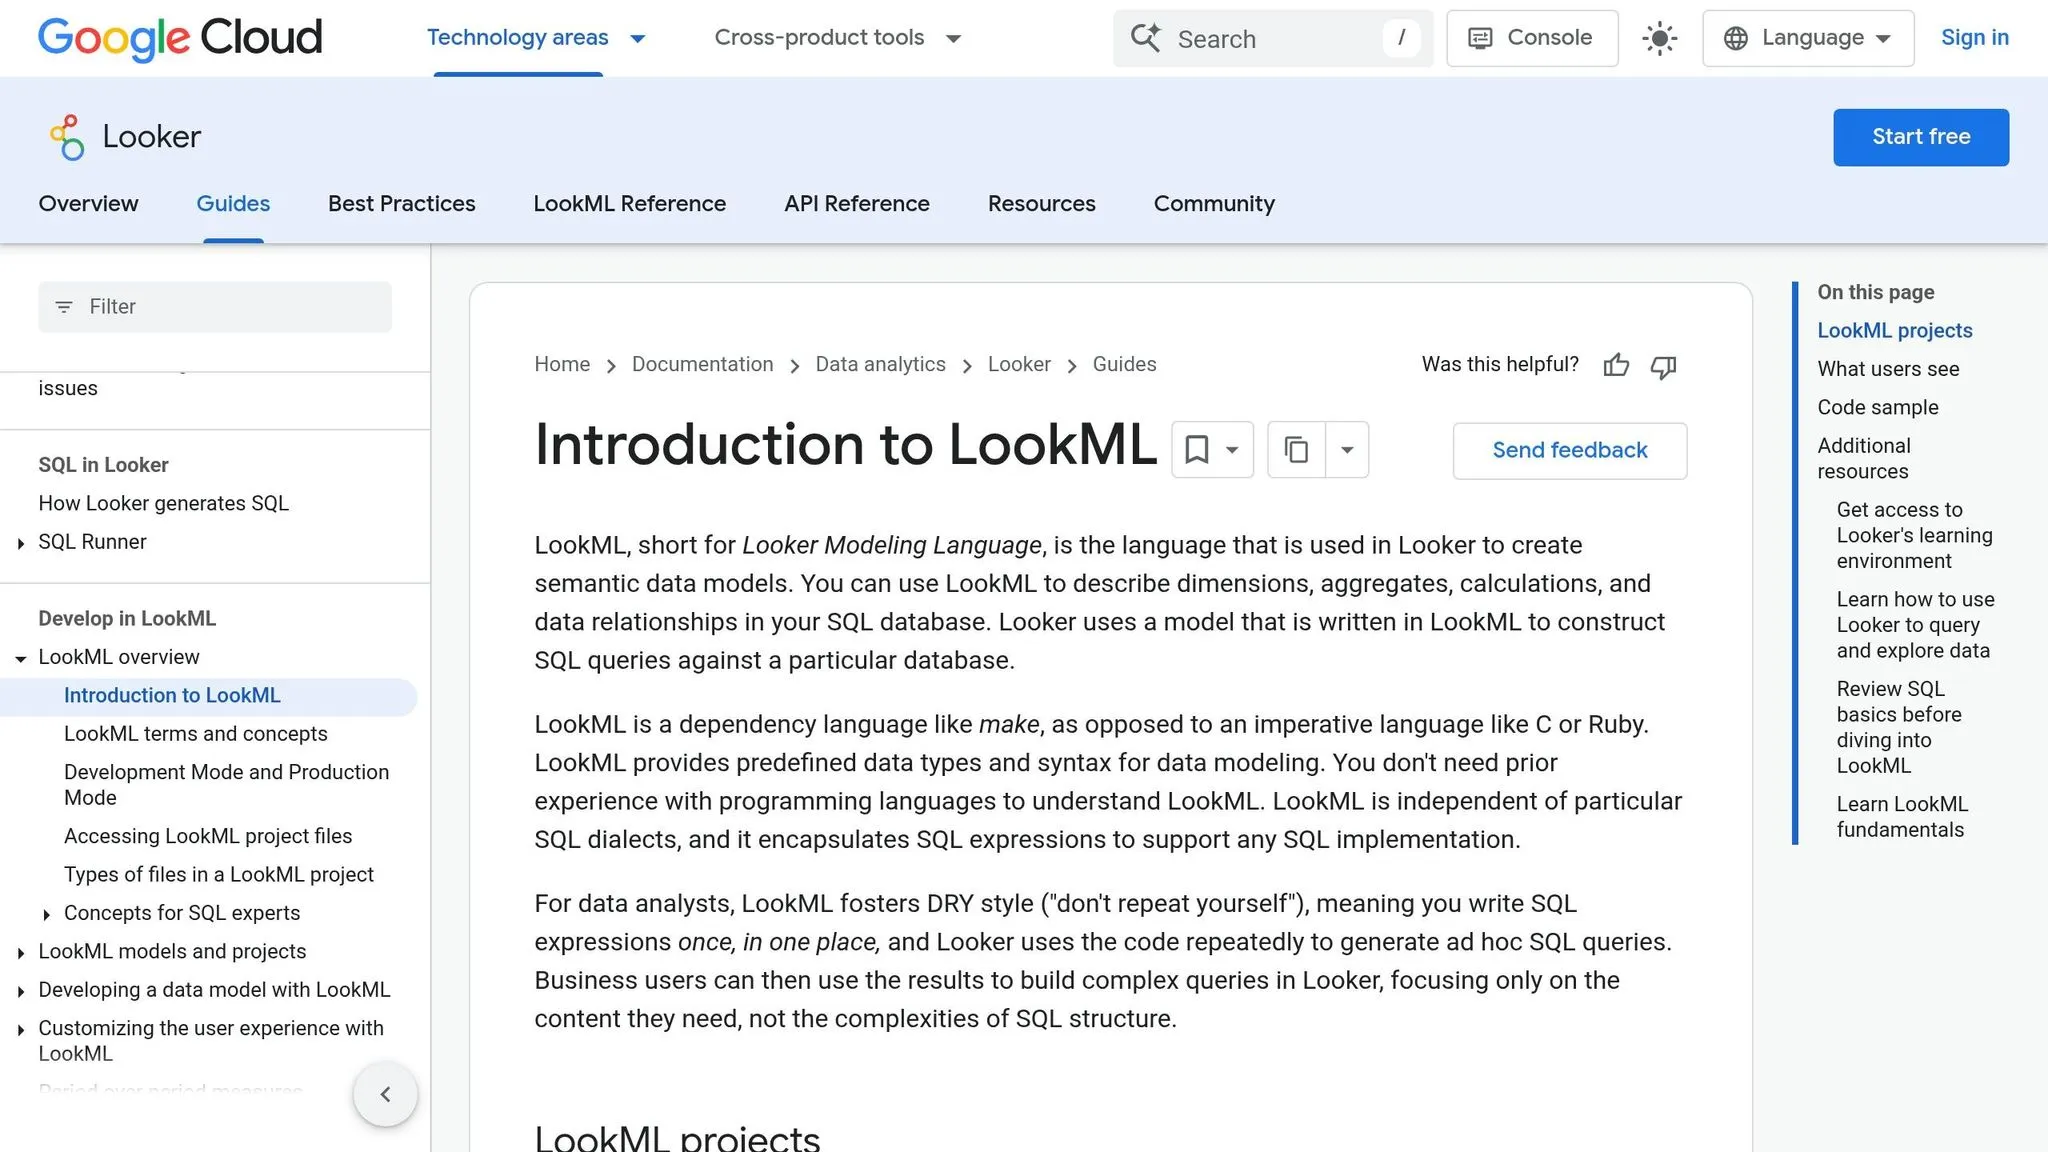
Looker's semantic layer runs on LookML, a proprietary, code-based modeling language. Metrics, joins, field definitions, and access rules are defined once and then used across dashboards, embedded apps, and AI agents. Omni uses a YAML-based model that handles many of the same jobs, but the file structure is different.
That gap matters more than it may seem at first glance. Joins, metric logic, and access rules often need to be translated by hand, then checked for parity. That's where a big share of migration hours goes.
There's also a practical staffing issue here. Looker requires dedicated LookML modeling skills. If your team is moving to Looker without someone who already knows LookML well, plan for either a new hire or a long training ramp. That's not a small footnote. It can shape the timeline from day one.
Dashboards, embedded analytics, and permission models
Charts, filters, and layout tend to get the most attention. But those surface-level dashboard parts are often the easiest pieces to misjudge. The tougher work sits underneath: row-level security rules and SSO configurations.
Looker and Omni both support governed access, but the rules have to be rewritten and tested again in the new platform. The logic may look similar on paper, but it doesn't carry over one-to-one. Each rule needs to be checked against your actual user groups.
Embedded analytics is where costs can climb fast. Looker's embedded analytics depend on iframes and SDKs, so product-facing dashboards usually need to be rebuilt instead of copied over. For healthcare and finance teams with regulated access patterns, that regulated access adds review cycles. Once permissions are mapped, the next big parity check is embedded analytics.
AI workflows and governed self-serve in 2026
Both platforms now support AI-assisted querying. But those workflows are tied closely to each platform's semantic layer, so they don't move cleanly. In plain English: they usually need to be rebuilt and rechecked during cutover.
Gemini in Looker handles conversational analytics based directly on LookML definitions. That governance model has a measurable effect: using Looker's semantic layer reduces natural-language query errors by 66% compared to direct text-to-SQL approaches [3]. But there's a catch. That gain only shows up after the model is complete and validated.
You can see this in the asset inventory pretty quickly. Some parts translate with work. Others don't. They need a rebuild.
What migrates cleanly and what gets rebuilt
Start by putting every asset into one of three buckets: migrate, rebuild, or retire. That split shapes the time, cost, and risk of the move.
| Asset Type | Migrates Cleanly | Needs Translation | Rebuilds | Risk Level |
|---|---|---|---|---|
| Semantic Models | Warehouse connections | Metric definitions, common joins | LookML logic to YAML syntax | High |
| Dashboards | Basic query logic | Filter behavior, naming conventions | Visual tiles, drill paths, interactivity | Moderate |
| Permissions & RLS | SSO/IAM config | User role mapping | Row-level security edge cases | High |
| Embedded Analytics | Data payloads | Iframe implementations | API/SDK custom workflows | High |
| Scheduled Reports | Recipient lists | Delivery triggers | Formatting and layout | Moderate |
| AI Workflows | Basic natural language prompts | Grounding context and definitions | Agentic actions and SQL verification | High |
Assets that translate with moderate effort
Warehouse connections to Snowflake, BigQuery, Redshift, or Postgres usually go live in days. But a fully governed semantic layer is a different story. That often takes weeks to months [1].
Metric definitions and common joins can usually move over once the target model is settled. Still, this is where teams often hit small but costly mismatches. Filter behavior, naming conventions, and drill paths all need parity checks, especially for finance and executive reporting [1].
Assets that require manual rebuilds
Dashboards usually need to be rebuilt tile by tile [1]. The base query logic may transfer, but the visual layer often doesn’t. Drill paths, interactions, and layout choices tend to need hands-on work.
Embedded analytics follows a similar pattern. Iframe links may come across with less effort, but API and SDK workflows usually need a rebuild. Conversational analytics setups also take time and can stretch into a few weeks [1].
Scheduled reports are less painful, but they still need testing. Recipient lists may port over cleanly. Delivery triggers, formatting, and layout often need to be set up again.
Assets that break parity when rushed
The riskiest items are row-level security edge cases, executive KPI definitions, and finance metrics. If these get rushed, metric drift shows up fast. That’s when the same KPI gives different numbers in different platforms, and trust starts to slip [2].
AI workflows can run into the same problem. If prompts, grounding context, and business definitions aren’t mapped again in the new system, answers can come back inconsistent or flat-out wrong [1][2].
Before rebuilding anything, run a usage audit. Cut the dashboards nobody touches. Rebuild the high-signal assets people rely on every day.
This inventory sets the hours, budget, and cutover risk in the next section.
Migration timeline and cost model: hours, dollars, and hidden work
::: @figure 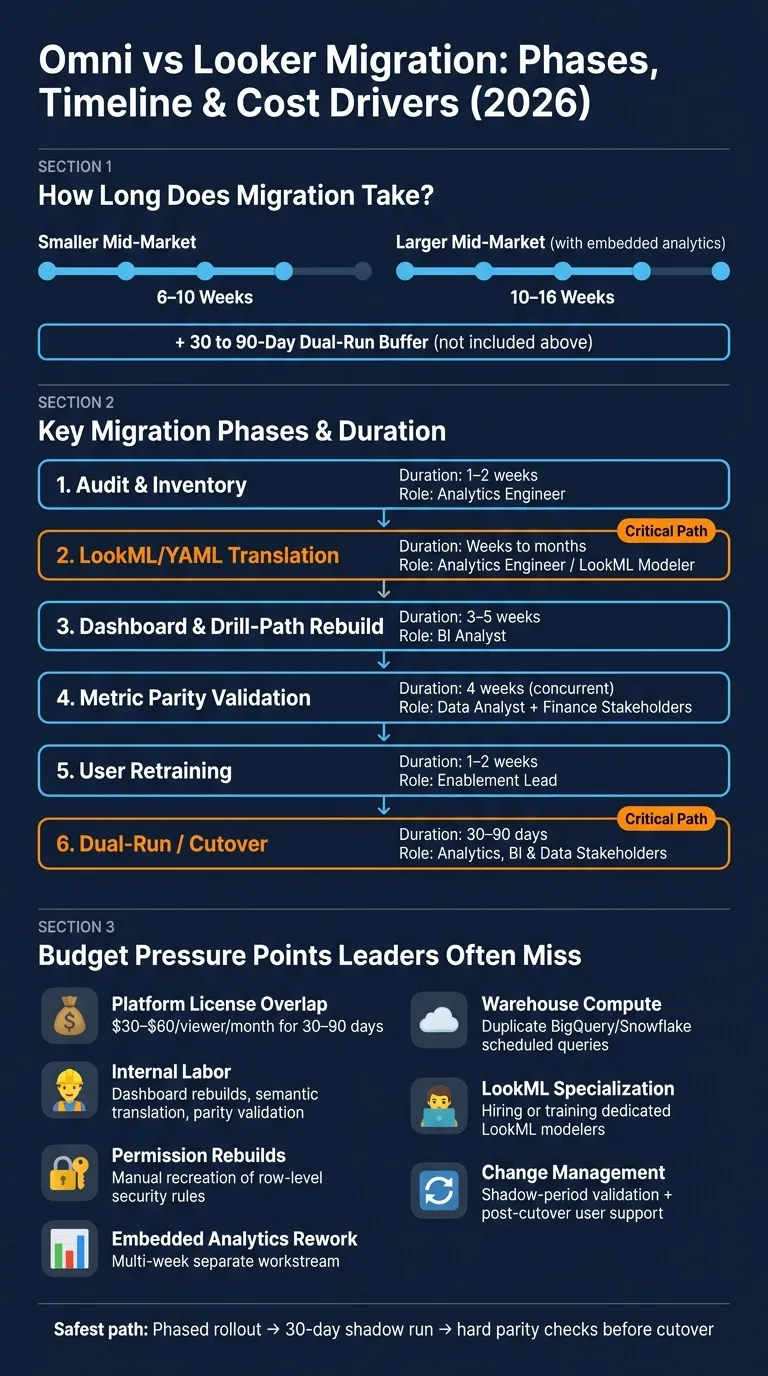 {Omni vs Looker Migration: Phases, Timeline & Cost Drivers (2026)}
:::
{Omni vs Looker Migration: Phases, Timeline & Cost Drivers (2026)}
:::
Those rebuild buckets turn straight into labor, overlap, and risk. Once you know what has to be rebuilt, the next step is simple to ask and harder to answer: how long will this take, and what will it cost?
That answer depends on a few big things: how much of the analytics estate is moving, how much embedded analytics architecture is in play, and how complicated your permissions setup is.
Timeline ranges for mid-market teams
For smaller mid-market deployments, 6 to 10 weeks is a realistic planning window. Larger mid-market estates with embedded analytics and more involved modeling should plan for 10 to 16 weeks. Neither range includes the post-cutover stabilization period [1][2].
What stretches the schedule most? Usually semantic translation, permissions, and embedded work. That’s where teams tend to spend the bulk of their time.
| Migration Phase | Duration | Primary Labor |
|---|---|---|
| Audit & Inventory | 1–2 weeks | Analytics engineer |
| LookML/YAML translation | Weeks to months | Analytics engineer / LookML modeler |
| Dashboard and drill-path rebuild | 3–5 weeks | BI analyst |
| Metric parity validation | 4 weeks (concurrent) | Data analyst + finance stakeholders |
| User Retraining | 1–2 weeks | Enablement lead |
| Dual-Run / Cutover | 30–90 days | Analytics, BI, and data stakeholders |
Use the audit to lock scope and assign owners. Semantic translation usually becomes the critical path.
Hidden cost drivers leaders miss
Most budget overruns don’t come from the obvious line items. They come from the work sitting just off to the side.
Parity validation eats up analyst time and usually runs as a 30-day shadow period.
Dual-run operations add cost in two ways: overlapping software licenses for 30 to 90 days, plus duplicate warehouse compute from running scheduled queries in both systems at the same time. If your warehouse is BigQuery or Snowflake, those parallel schedules hit the cloud bill directly [2].
Recreating complex permissions is another expense that often shows up late in the plan [2].
LookML specialization is easy to undershoot. Looker migrations usually need a dedicated LookML modeler, which can mean hiring or training [1].
Embedded analytics rework can stretch the timeline too. It makes sense to budget embedded analytics as its own multi-week workstream [2].
AI workflow revalidation adds more time when prompts, grounding context, and business definitions have to be remapped in the new system [1][2].
A sample cost model for budget planning
A clean way to plan the budget is to split it into overlap, internal labor, and rework. That makes the full cost easier to see instead of burying it in one big estimate.
| Cost Category | What drives it | Planning note |
|---|---|---|
| Platform licensing overlap | 30–90 days of dual licenses at $30–$60 per viewer/month [2] | The seat bill is only part of the migration cost. |
| Internal labor | Dashboard rebuilds, semantic translation, parity validation, retraining | This is usually the hardest line item to shrink. |
| Permission rebuilds | Recreating complex permissions [2] | Access rules often need manual recreation. |
| Embedded analytics rework | Multi-week workstream for Looker's Conversational Analytics APIs [2] | Budget this as a separate workstream. |
| Warehouse compute | Duplicate schedules in BigQuery or Snowflake [2] | Parallel runs can show up directly on the cloud bill. |
| Specialized modeling help | Hiring or training LookML modelers [1] | Often needed when the semantic layer is deep. |
| Change management | Shadow-period validation and user retraining [2] | Plan for support time after cutover, not just during it. |
Licensing savings rarely offset implementation cost.
Decision framework: stay, switch, or phase the migration
Use the rebuild inventory and cost model above to decide whether a migration cuts risk or simply recreates the same governance issues in a new tool. This isn’t about picking the platform that looks "better" on paper. It’s about whether the move is worth the disruption for your team right now. The asset inventory and cost ranges above should tell you if the migration clears your risk and budget bar.
When staying on your current platform is the lower-risk choice
Staying put makes sense when your semantic layer already carries a lot of weight. If you have a mature semantic model, rebuilding it is often the most expensive part of switching. The same goes for a stack that is closely tied to BigQuery, IAM, and private networking. [1]
You should also stay put when the assets that matter most are the ones most likely to lose parity. Say your leadership team depends on a small group of dashboards every morning. If those dashboards are high stakes, even a short dip in trust can do damage. In that case, the disruption risk may be higher than the upside of switching. [2]
When switching platforms is worth the cost
A switch is easier to justify when the data team is buried under ad hoc questions that the current BI tool can’t answer without custom SQL. And if you’re sitting on thousands of barely used reports, that’s often a sign the model has started to decay. Migration can give you a chance to clean house instead of dragging old clutter into a new system. [2]
Governance gaps are another common trigger. If different teams are getting different numbers for the same KPI, the semantic layer isn’t doing its job. But switching only helps if the new platform gives you a governed, shared metric layer that powers both dashboards and ad hoc queries. If it doesn’t, metric drift just comes along for the ride. [2]
How to run a phased migration without losing trust
If the business case still makes sense after the cost review, phase the move instead of flipping everything at once. Shadow runs and validation are the main cost-control tools from the hidden-cost section. Don’t treat them like a nice extra. They’re the backbone of the migration.
Start with Customer Success or Operations. Then move to Sales once people trust the new answers. Run a 30-day shadow period and validate every answer before cutover. [2]
Migration is also a good moment to audit low-use dashboards and retire them. Keep the dashboards that earn daily attention. Decommission the rest instead of porting everything over. [2]
Use these gates to decide whether to expand, pause, or stop:
| Migration Phase | Target Scope | Duration | Success Gate |
|---|---|---|---|
| Pilot | CS or Ops routine queries | 30 days | 95%+ accuracy in shadow testing |
| Rollout | 10–20 high-signal dashboards | 1–2 months | 70% self-serve adoption rate |
| Cutover | Executive summaries | 1 month | Legacy dashboard decommissioning |
Treat semantic parity and a 30-day shadow period as the minimum bar before cutover.
FAQs
::: faq
How do I estimate migration scope?
Take stock of what you have now, then decide what should be rebuilt and what can be brought over as-is. Start with semantic or metric definitions, dashboards or workbooks, permissions or row-level security, embedded analytics, and AI-driven workflows. For each item, assign a plain label: ports cleanly, needs rewrite, or requires redesign.
That simple sorting step saves a lot of pain later. A dashboard might move over with little trouble, while a metric definition tied to old business logic may need fresh work. An embedded analytics setup might still function, but the surrounding auth flow could push it into needs rewrite. AI-driven workflows often deserve extra scrutiny because prompt logic, model behavior, and downstream actions don't always transfer neatly.
You should also plan for parity validation, user retraining, and a shadow or cutover period. A 30-day validation phase is a common way to do this. During that window, teams can compare outputs from the old and new setup, catch mismatches, and fix them before the old system is turned off.
Use your real question logs to estimate ongoing maintenance. They show what people ask, where definitions break down, which dashboards get hit most often, and where support requests are likely to pile up. That gives you a much better read on day-to-day upkeep than a guess made in a planning meeting. :::
::: faq
What usually breaks parity first?
Parity usually breaks first in semantic/metric logic and in the way teams check that logic. In Looker, LookML measure limits can push people into workarounds like derived tables. Those tables can go stale, and they add extra upkeep.
The Explore/dashboard workflow can turn into a bottleneck too. When that happens, reports and ad hoc questions stop lining up cleanly. And if the AI layer isn’t tied to the same governed semantic layer as the dashboards, KPI definitions can drift. Once that starts, answers can split fast. :::
::: faq
When is a phased migration safer?
A phased migration is the safer path. Keep the old system live while you check accuracy and give people time to build trust in the new one.
A good place to start is a 30-day shadow period. During that time, analysts should review AI answers, flag misses, and help tune the semantic layer so it matches the old system as closely as possible. That side-by-side setup gives you room to catch problems before they spread.
It also helps to begin with one high-value team instead of rolling the change out to everyone at once. Then use question logs to see which artifacts people still rely on, which ones can be retired, and which ones should stay in place until cutover.
Skip that step, and one early wrong answer can do real damage to trust. :::