Business Intelligence
How to replace Tableau without losing your analysts
Plan a phased migration from Tableau to a warehouse-native BI: involve analysts, validate dashboards, and reduce licensing costs.
Tableau is a powerful BI tool, but its rising costs and operational challenges are pushing companies to compare BI alternatives. Transitioning away from Tableau can be daunting, especially for analysts who rely on its tools and workflows. Here's how to switch platforms effectively without disrupting your team:
Costs Add Up: Tableau's licensing fees can exceed $200,000 annually for 500 users, plus additional expenses for external tools and infrastructure.
Scalability Issues: 71% of companies report Tableau struggles to scale, leading to slow performance and bottlenecks.
Analyst Concerns: Migrating dashboards and logic (like LOD expressions) to a new platform requires significant effort and risks productivity loss.
To make the switch smoother:
Involve analysts early to ensure buy-in and reduce resistance.
Audit Tableau dashboards, retire unused ones, and prioritize simple, high-value reports for migration.
Choose a platform like Querio, which offers live data connections, natural language queries, and a cost-effective pricing model.
Train analysts, validate results, and run both platforms in parallel during the transition.
Switching platforms doesn’t have to derail your analytics team. With careful planning and the right tools, you can reduce costs and improve efficiency while keeping your analysts productive.
How to Prepare for the Platform Switch
Starting your migration planning early is key to a smooth transition. With the data analytics market expanding at an annual growth rate of 25.5% [4], careful preparation can help your organization embrace modern tools without disrupting daily workflows.
Assess Your Organization's Analytics Requirements
Begin by conducting a technical audit of your Tableau environment. This means mapping out workbook elements like chart types, calculated fields, filters, parameters, and data relationships [5][8]. Use a spreadsheet to document all data sources, including details like the source, owner, key data points, and quality ratings [4][8].
Next, classify dashboards based on their complexity. Create a scoring system that considers factors like sheet count, calculated fields, LOD expressions, data sources, and SQL queries for BI. For example:
Dashboards with fewer than five sheets, under 10 calculated fields, and no LOD expressions are easier to migrate.
Dashboards with 15+ sheets, over 30 calculated fields, and complex custom SQL will require more attention from senior developers [9].
Talk to department heads to uncover the business's most pressing questions. Instead of simply asking what data they need, frame the conversation around decision-making. As Querio suggests:
"Don't ask stakeholders 'What data do you want?' Ask them 'What are the most important decisions you need to make this quarter, and what information do you lack to make them confidently?'" [4]
Set migration KPIs to measure success. Track metrics like current dashboard load times, weekly active users, and query performance to compare results on the new platform [6].
Finally, ensure that analysts are involved early in the process to help translate technical requirements into actionable migration steps.
Get Analysts Involved from Day 1
Involving analysts from the beginning is critical. Clearly communicate the reasons behind the platform switch - whether it’s for cost efficiency, better governance, or improved integration. This transparency fosters ownership and reduces resistance [7][8]. Include analysts in Proof of Concept testing to address challenges in translating Tableau-specific logic [5][8]. By having them validate that numbers align between the old and new systems, the migration becomes a collaborative effort rather than a simple technical task [2].
Identify key power users within your team and train them first. These individuals can act as internal champions, supporting their peers during the rollout [8]. Create dedicated Slack channels or hold office hours where analysts can ask questions and share feedback throughout the process [7][8]. As Evan Rusackas from Preset explains:
"Keeping users informed helps build their buy-in and reduce resistance to change" [7]
Once analysts are on board, it’s time to take stock of your existing dashboards and reports.
Catalog Your Existing Reports and Dashboards
Start with a detailed inventory of your dashboards, which typically takes two to four weeks [10]. Use automated tools to streamline this process. During the audit, you’ll likely find that 30%–60% of dashboards are unused or redundant [10]. Apply the 90-day rule - if a report hasn’t been accessed more than a few times in the last 90 days, consider retiring it instead of migrating [10]. This step alone can reduce your migration workload by 30% to 50% [10].
Categorize dashboards based on usage and complexity:
High-usage dashboards with simple logic can migrate as-is.
Low-usage reports may be retired.
High-usage dashboards with complex or slow logic should be rebuilt to improve performance [10].
Document Tableau-specific calculation logic early. LOD expressions and table calculations often need to be translated into the new platform’s language, so cataloging them now will help avoid headaches later [9][8]. Focus your first migration wave on low-complexity, high-usage dashboards to quickly demonstrate success and build confidence across the organization [9].
What to Look for in a Replacement Platform
Finding the right platform to replace Tableau means choosing one that maintains analysts' capabilities while solving Tableau's biggest drawbacks. Your new tool should eliminate licensing restrictions, lower maintenance efforts, and strengthen data governance - all without requiring analysts to start from scratch. Here's what you should prioritize in a replacement platform.
Required Platform Capabilities
A modern BI platform must support live connections to your current data warehouses. This means it should integrate directly with platforms like Snowflake, BigQuery, Redshift, and PostgreSQL using secure, read-only connections. Avoid tools that rely on data extracts or summaries, as these can lead to version control headaches and unnecessary storage costs.
The platform should offer an intuitive interface for non-technical users while also providing advanced options for analysts. Non-technical users need the ability to explore data without writing code, while analysts should have tools to inspect, edit, and fine-tune the underlying logic. Ideally, the platform should generate real SQL or Python code, avoiding proprietary syntax that limits flexibility and transparency.
Centralized business logic is another must-have. Your new platform should allow data teams to define joins, metrics, and terminology in a single, shared layer. This ensures consistent governance and prevents the metric sprawl often seen in decentralized Tableau environments.
Lastly, look for tools with AI tools that write SQL. The ability to translate natural language questions into SQL queries is becoming critical. According to Gartner, 80% of enterprises are expected to adopt AI-enhanced analytics platforms by 2025 [1]. This feature can give your organization a competitive edge.
Why Querio Works as a Tableau Replacement
Querio addresses Tableau's limitations with a warehouse-native design that queries live data directly - no extracts needed. It integrates seamlessly with Snowflake, BigQuery, Redshift, ClickHouse, and PostgreSQL, handling up to 1 billion data points in under 5 seconds. This eliminates data staleness and refresh delays caused by extracts.
The platform's natural language interface allows decision-makers to ask questions in plain English, such as, "What were our top-performing products last quarter?" Analysts, meanwhile, retain full access to the generated SQL and Python code, ensuring transparency and avoiding the "black box" issue. This setup allows senior analysts to verify and optimize queries during the migration process.
Querio also excels in governance with its shared context layer, where data teams can define joins, metrics, and glossary terms once. This ensures that all departments receive consistent results for the same KPIs, replacing Tableau's decentralized certification model.
Finally, Querio's pricing model is designed to scale. With unlimited viewer access included, the core platform costs $14,000 per year and comes with 4,000 AI prompts per month. Additional database connections are $4,000 per year, and dashboards cost $6,000 per year. This straightforward pricing eliminates the per-seat fees that make Tableau costly for larger teams, simplifying both budgeting and scaling.
How to Execute the Migration
Step-by-step guide to migrating from Tableau to a new BI platform
Moving from Tableau to Querio is no small task, but with a phased approach, you can ensure analytics remain operational while taking advantage of Querio's warehouse-native design. Instead of an abrupt switch, treat the transition as a gradual rollout. This allows analysts to adjust while maintaining access to essential reports. Below are the steps to guide the process, building on your initial preparation and planning.
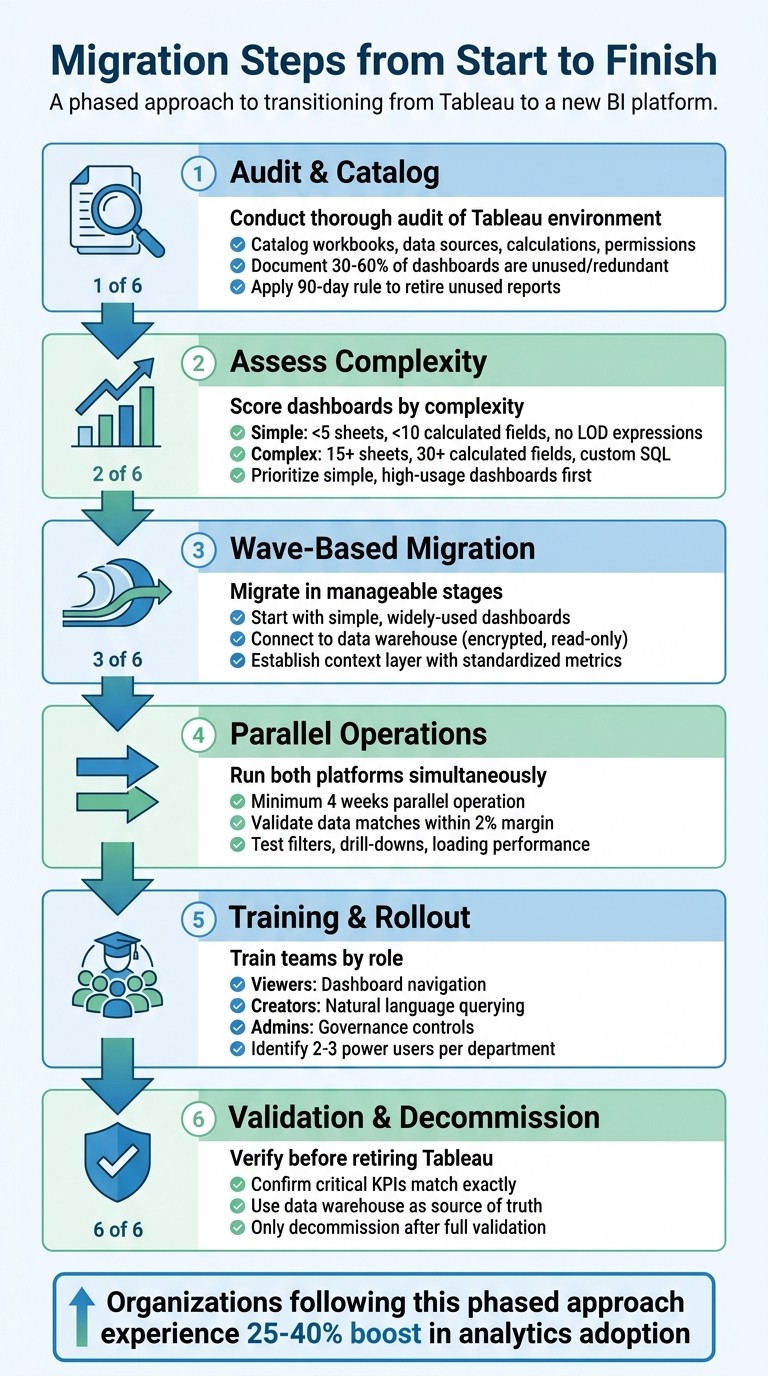
Migration Steps from Start to Finish
Start by conducting a thorough audit of your Tableau environment. Catalog every workbook, data source, calculation, and permission. This comprehensive inventory will help you determine which dashboards are essential, which are redundant, and which can be retired [3][9][12].
Next, assess the complexity of each workbook. Factors like the number of sheets, calculated fields, LOD expressions, and the intricacy of data sources should guide your prioritization. This scoring system will help you tackle the migration in manageable stages [9].
Adopt a wave-based approach for the migration. Begin with dashboards that are simple but widely used - this builds confidence and allows you to fine-tune your process [3][9]. Start by connecting Querio to your data warehouse using encrypted, read-only credentials. Then, establish the context layer with standardized joins, metrics, and definitions. This ensures that AI-generated queries interpret business terms consistently across all users.
For dashboards, Querio offers a Dashboard Parity Pack, a service priced at $6,000, which replicates your Tableau dashboards while maintaining consistent visuals and data. This option can significantly reduce disruptions for teams relying on specific layouts.
How to Train Analysts on the New Platform
Training should be tailored to different roles:
Viewers: Focus on navigating and interacting with dashboards.
Report creators: Learn natural language querying and the analytics notebook environment.
Administrators: Dive into governance controls and context layer management [9].
Start with a pilot program involving a motivated team to test the migration steps and refine your training methods before scaling up across the organization [3][12]. Identify 2–3 power users in each department to act as champions. These individuals can provide peer support and encourage adoption during the transition [9].
Make the learning curve easier with quick reference guides that map Tableau actions to their Querio equivalents. For instance, "In Tableau, you created a calculated field; in Querio, you can ask 'Show revenue minus cost' or define it in the context layer" [9]. These tools can help analysts adapt their existing skills with minimal disruption.
Once training is complete, shift your focus to testing and validation to ensure a seamless transition.
Testing and Validation Before Full Rollout
Testing is critical to maintaining analyst productivity and ensuring Querio meets your reporting needs. Run both Tableau and Querio in parallel for at least four weeks [3][9]. This dual-write strategy provides a safety net, allowing you to revert to Tableau if necessary, while building confidence in Querio's accuracy [11].
Validate every migrated report using a detailed checklist. Confirm that data values match within a 2% margin between platforms, ensure filters and drill-downs work as expected, and test loading performance [3][9]. If discrepancies arise, use your primary data warehouse - whether Snowflake, BigQuery, or PostgreSQL - as the single source of truth.
Only decommission Tableau workbooks once you've verified that critical KPIs produce identical results in Querio. This careful validation process helps avoid data-trust issues that could undermine the migration’s success.
Keeping Analysts Productive After Migration
Once the migration is complete, the focus shifts to keeping analysts engaged and productive. Ensuring their continued support is essential for maximizing the return on investment (ROI). While the initial migration may have gone smoothly, it's the ongoing adoption and usage that truly determine success. As Ryan Goodman, CMO of BIChart, explains:
"Migration is the event, but adoption is the outcome that drives ROI" [3].
Set Up Regular Feedback Channels
To address post-migration challenges effectively, establish clear and accessible feedback channels. For example, create a dedicated Slack or Teams channel where analysts can ask questions about Querio during the first few weeks. This allows them to troubleshoot issues like exporting data or fixing filters without waiting for IT support [3][7]. Aim for a 24-hour response time to build trust and maintain momentum.
Weekly office hours are another great way to provide support. These drop-in sessions allow teams to address emerging problems and refine workflows in real time [3]. They also reinforce the message that help is always available. Leaning on power users for peer-to-peer support adds an extra layer of guidance and helps sustain adoption over the long haul [12].
Additionally, embed short surveys within Querio to capture usability feedback. Since Querio relies on AI, analyst input - like flagging incorrect interpretations of terms such as "revenue" - is invaluable for improving the platform's accuracy. These corrections help refine the semantic context layer, ensuring the system becomes smarter over time [13].
By addressing issues promptly and encouraging feedback, you can build confidence in the platform while fostering a culture of continuous improvement.
Encourage Skill Development and Platform Mastery
Promote ongoing learning by organizing informal knowledge-sharing sessions. These weekly gatherings provide a space for analysts to collaborate, share discoveries, and solve problems together. For instance, they might explore workflows unique to Querio, like asking complex questions in plain English instead of creating calculated fields.
Support self-paced learning by developing a centralized resource library. Include video tutorials and quick-reference guides so analysts can explore advanced features whenever they have time.
Quarterly roundtables with advanced users are another way to uncover new use cases and optimize the platform's performance. These sessions can transform early adopters into advocates who showcase Querio's potential to hesitant colleagues. The goal here is not just to build skills but to instill confidence that Querio can handle their needs effectively.
Conclusion
Switching from Tableau can keep analysts productive if approached thoughtfully. By involving analysts from the start, thoroughly cataloging existing reports, and selecting one of the best AI business intelligence tools that aligns with their needs, the transition becomes much smoother.
Querio simplifies this process by removing per-user licensing fees, offering live warehouse connections, and enabling natural-language queries. With inspectable SQL for verification, analysts can rely on plain English queries instead of intricate calculations, making data more accessible and fostering trust without extensive training. This approach also enhances cost efficiency.
The migration process should follow a structured plan: begin with an inventory of your reports, assess their complexity, roll out changes in waves, and maintain parallel operations for at least four weeks. This phased approach allows analysts to validate results and build confidence. Organizations adopting this method often experience a 25–40% boost in analytics adoption [9]. These steps ensure a smooth operational shift while maintaining continuity for your analytics team.
Key Points to Remember
Conduct a detailed audit of your analytics environment and engage analysts early to encourage adoption [9].
Select a new platform that supports live data connections, natural-language queries, and transparent pricing. Avoid overwhelming your team by migrating in waves rather than all at once [9][3]. Use a 2% variance rule to confirm that converted dashboards align with Tableau originals on key performance indicators before retiring old reports [9].
Post-launch, provide 24-hour response times for analyst questions and offer quick-reference guides to map Tableau actions to Querio equivalents [9]. The ultimate goal isn’t just migration - it’s creating a more accessible and cost-effective analytics system that your team will actively use.
FAQs
How long does a Tableau migration usually take?
For many organizations, migrating to Tableau usually takes less than two weeks, particularly for smaller setups. However, if you're dealing with a larger deployment - think over 100 users or more complex configurations - it might take several weeks. This extra time ensures everything is transitioned smoothly, including content, user accounts, and governance frameworks. The duration really hinges on the project's size and complexity.
How do we convert LOD calculations without breaking KPIs?
When converting Level of Detail (LOD) calculations to a new platform, it's crucial to replicate their logic accurately to maintain KPI integrity. For example, a Tableau LOD expression like {FIXED [Customer ID] : SUM([Revenue])} can be translated into SQL queries or integrated into data models that ensure the same aggregation behavior.
To prevent any discrepancies in KPIs, it's a good idea to centralize these calculations in a semantic layer or a unified data model. This approach helps maintain consistent definitions across all reports and dashboards, ensuring accuracy and reliability in your analytics.
What’s the best way to keep analysts productive during the switch?
To ensure analysts remain productive during a Tableau migration, adopting a phased strategy is key. Start by focusing on migrating the most essential dashboards and data sources while keeping existing tools accessible. This approach helps minimize disruptions and safeguards critical workflows.
Additionally, clear communication and training play a big role in smoothing the transition. Involving analysts early in the planning process reduces confusion, builds confidence, and helps maintain productivity throughout the migration.
Related Blog Posts


