Business Intelligence
The Perfect Embedded Analytics Architecture
Practical guide to secure, scalable embedded analytics: data access, semantic and presentation layers, deployment choices, and implementation tips.
Multi-tenant embedded analytics integrates data insights directly into software platforms, eliminating the need for users to switch between tools. This approach improves productivity, decision-making, and user experience by providing real-time, context-specific insights within workflows.
Key Components:
Data Access Layer: Connects to data sources, supports data federation, and ensures security with role-based controls.
Semantic Layer: Transforms raw data into business metrics, centralizes KPIs, and applies consistent rules across dashboards.
Presentation Layer: Displays dashboards and visualizations tailored to user roles, offering interactivity and actionable insights.
Deployment Options:
Cloud-Based: Scalable, cost-effective, and vendor-managed. Ideal for businesses needing flexibility and global connectivity.
On-Premises: Full control over data and security but requires significant investment and maintenance.
Implementation Tips:
Start with a few high-impact dashboards.
Use tools like Snowflake, BigQuery, and Looker, or consult an embedded analytics vendor selection guide.
Ensure security with row-level policies and tenant isolation.
Embed analytics seamlessly with white-labeling and secure integrations.
The Best Embedded Analytics Strategy Isn’t Just Build or Buy
Core Components of Embedded Analytics Architecture
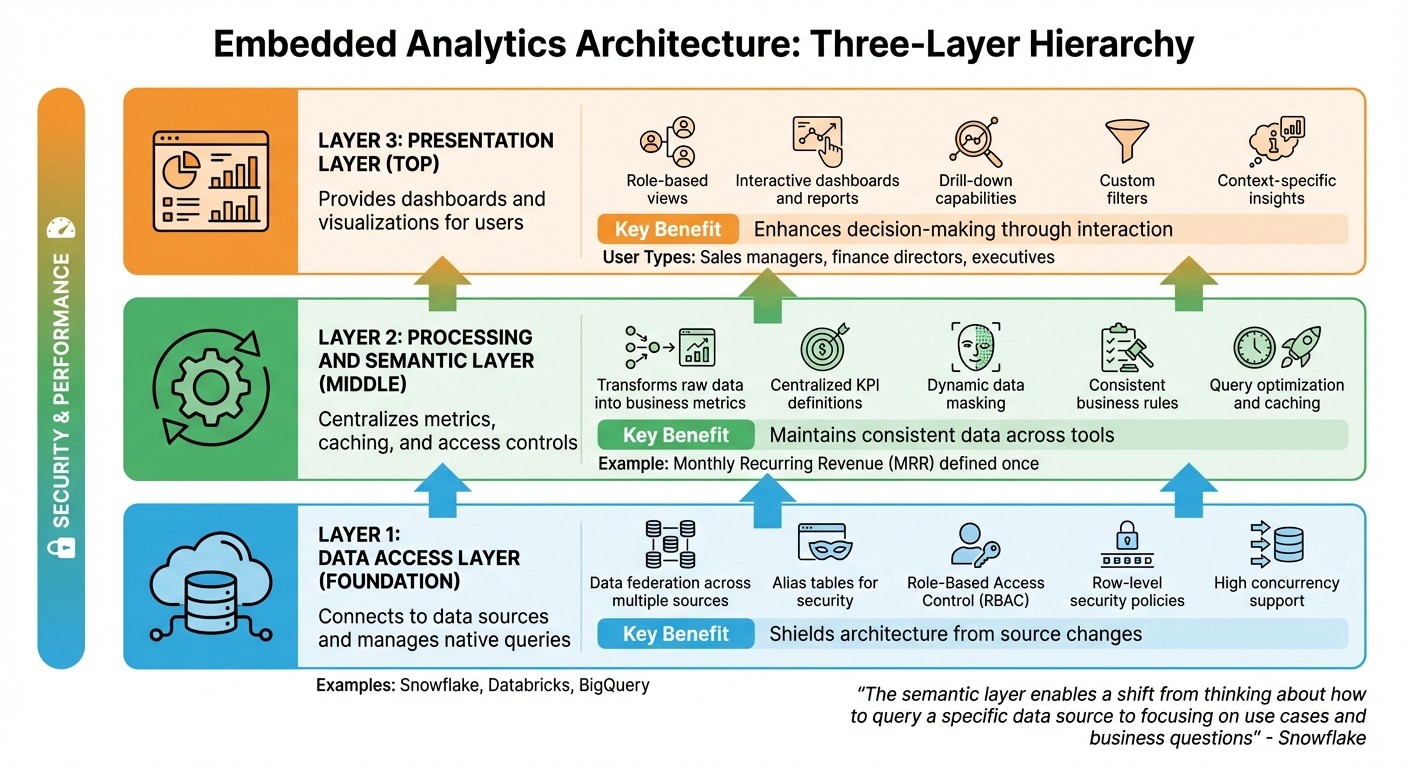
Three-Layer Embedded Analytics Architecture: Data Access, Semantic, and Presentation Layers
Embedded analytics architecture is built on three interconnected layers: data access, processing and semantic, and presentation. Together, these layers work to pull, transform, and present data in a secure and scalable way, enabling real-time, context-driven insights. Here’s a closer look at how each layer contributes to an efficient embedded analytics system.
The Data Access Layer
The data access layer serves as the bridge between your analytics system and your data sources, whether you're working with platforms like Snowflake, Databricks, or other cloud data warehouses. It handles data ingestion while maintaining security and simplicity through alias tables, which mask database names and structures. This not only protects your schema but also simplifies access management.
A standout feature of this layer is data federation - the ability to combine data from multiple sources into a single logical object. This eliminates the need for duplicating or manually syncing data, allowing you to query across different warehouses seamlessly. Modern cloud platforms ensure high concurrency, so performance remains strong even under heavy query loads. Additionally, this layer enforces security with Role-Based Access Control (RBAC) and row-level security policies, ensuring only authorized users can access specific data.
The Processing and Semantic Layer
Sitting between raw data and end users, the semantic layer transforms complex database structures into user-friendly business metrics. It centralizes the definitions of key performance indicators (KPIs) and calculations, ensuring consistency across all dashboards. For example, a metric like monthly recurring revenue (MRR) is defined in one place, eliminating discrepancies across reports. As Snowflake explains:
"The semantic layer enables a shift from thinking about how to query a specific data source to focusing on use cases and business questions supported by a unified view of the available data."
This layer also manages caching, access controls, and metric definitions, streamlining operations while enhancing security through features like dynamic data masking and row-level policies. These measures ensure users only see data relevant to their roles, making the system both secure and efficient.
The Presentation Layer
The presentation layer is where users interact with the data, offering dashboards, charts, and reports that abstract away the complexities of the underlying layers. This layer provides role-based views, tailoring insights to specific user needs - for instance, a sales manager and a finance director might view the same dashboard but see different metrics relevant to their roles.
A strong presentation layer supports detailed interactions, including drilling into specific data points, applying custom filters, and generating reports on demand. Whether users need to monitor established KPIs or explore data for new insights, the tools in this layer should align with their goals. By connecting the presentation layer to a centralized semantic layer, you ensure consistency in metrics across all visualizations, preventing confusion or errors.
The table below summarizes these layers and their core benefits:
Component | Primary Function | Key Benefit |
|---|---|---|
Data Access Layer | Connects to data sources and manages native queries | Shields architecture from source changes |
Semantic Layer | Centralizes metrics, caching, and access controls | Maintains consistent data across tools |
Presentation Layer | Provides dashboards and visualizations for users | Enhances decision-making through interaction |
Choosing the Right Deployment Model
Deciding between cloud or on-premises deployment for your embedded analytics is a major decision - one that can shape everything from your costs to how you meet compliance requirements. This choice isn't just about technology; it’s about aligning with your business priorities, regulatory obligations, and future growth plans. Both options have their strengths, so it's important to weigh them carefully against factors like scalability, expenses, and compliance needs.
Cloud-Based Deployment
Cloud-based deployment relies on a multi-tenant architecture, where a third-party provider handles hosting and infrastructure management. With this model, you don’t have to worry about maintaining servers, applying software updates, or scaling resources - the vendor takes care of it all. It operates on a pay-as-you-go basis, meaning you’re only billed for what you use, eliminating the need for large upfront investments.
This approach is particularly appealing if your business is expanding rapidly or requires seamless global connectivity. Cloud platforms can scale instantly to accommodate usage spikes, making them ideal for companies with fluctuating demands. As S&P Global notes:
"AnPaaS is the future of embedded analytics"
This refers to Analytics-Platform-as-a-Service, a cloud-native framework that integrates AI and real-time insights directly into applications.
Cloud deployment also shifts expenses from capital expenditures (CapEx) to a more predictable operating expense (OpEx) model. Security updates and compliance certifications like SOC2, GDPR, and CCPA are managed by the provider, reducing the workload for your internal teams. However, one potential drawback is that your data and encryption keys are stored with a third-party provider, which might be a concern for businesses in highly regulated sectors.
On-Premises Deployment
If your business requires strict control over data, on-premises deployment may be the better choice. With this model, everything runs on your own servers, secured behind your corporate firewall. You maintain full ownership of your data and encryption keys, making this setup ideal for industries like government, banking, or healthcare, where regulations such as HIPAA or FERPA demand precise control over data storage and access.
The trade-off for this level of control is cost and complexity. On-premises deployment involves a significant upfront investment in software licenses and hardware, along with ongoing costs for power, physical space, and IT staff. Scaling is a manual process and limited by your existing infrastructure - adding capacity means purchasing and installing more servers. For many organizations, the biggest advantage of on-premises deployment is its single-tenant architecture, which ensures complete isolation from other users. While this provides maximum security and customization, it also requires substantial internal resources to handle maintenance, updates, and troubleshooting.
Cloud vs. On-Premises: Comparison Table
Factor | Cloud-Based | On-Premises |
|---|---|---|
Deployment | Hosted by provider; instant provisioning | Installed on company-owned hardware |
Cost Structure | OpEx: Pay-as-you-go, no upfront costs | CapEx: High initial investment in hardware |
Scalability | Automatic, virtually unlimited | Manual, limited by physical infrastructure |
Maintenance | Vendor-managed with automatic updates | Handled internally; manual patching |
Control | Data managed by third party | Full internal control over data |
Compliance | Standardized (SOC2, GDPR, CCPA) | Custom-tailored for strict regulations |
Security | Shared responsibility with provider | Data remains behind corporate firewall |
When deciding between these models, your regulatory requirements should be the primary consideration. For industries with strict compliance demands, on-premises deployment might be the only viable option. On the other hand, businesses prioritizing flexibility and cost efficiency will find cloud-based deployment more suitable. Many companies also explore hybrid models, combining the strengths of both - keeping sensitive data on-premises while leveraging the cloud for scalable, less sensitive analytics tasks.
Design Principles for Performance and Security
After selecting your deployment model, the next step is to build an architecture that supports growth while keeping security intact. Both optimized performance and robust security are fundamental to creating a reliable embedded analytics system.
Scalability and Resource Optimization
Scalability goes beyond just managing more users - it’s about maintaining consistent performance, even as demand shifts. Multi-tenant architectures are key here, enabling multiple clients to share infrastructure while ensuring their data remains fully isolated. This setup maximizes resource use without compromising security.
To keep performance steady, dynamic resource allocation is crucial. An analytics engine that auto-scales based on demand ensures service levels are maintained without requiring manual adjustments. This is especially critical for embedded analytics tools, where user activity can spike unexpectedly at different times of the day.
Another important factor is workload isolation. By separating processes such as data ingestion, transformation, and query serving, you can prevent a bottleneck in one area from affecting the entire system. This segmentation also minimizes the impact of potential component failures.
A semantic layer is a game-changer for performance. It transforms raw data into actionable insights while consistently applying business rules and security filters across all tenants. Modern semantic layers utilize dedicated query pools and automated optimization techniques to deliver fast response times, even when hundreds of users are executing complex queries. For real-time analytics, ensure that stream processing scales dynamically by using appropriate sharding or partitioning methods. As performance scales, security measures must remain equally robust to protect data integrity.
Security Frameworks
Security in embedded analytics demands a multi-layered approach, starting with authentication. Instead of requiring users to log in separately to access analytics, use methods like signed embedding or Single Sign-On (SSO) solutions such as SAML, Google OAuth, or Two-Factor Authentication (2FA). These options allow users to authenticate through your host application, offering a seamless yet secure experience.
To control data access, implement Row-Level Security (RLS) and Object-Level Security (OLS) based on user roles. For added protection, especially in third-party integrations, deploy customer-facing content on separate instances from internal analytics. This physical separation provides an extra security layer.
Tenant isolation is critical in multi-tenant systems. Achieve this by assigning unique user IDs and using dedicated service accounts. For APIs, create service accounts with minimal privileges and safeguard client secrets as carefully as admin credentials. Additionally, using sandboxed iframes for the presentation layer ensures that embedded content cannot interact with or alter the parent application, preserving a secure boundary between your platform and the analytics interface.
Isolation Strategy | Implementation Method | Best Use Case |
|---|---|---|
Physical Separation | Dedicated instances for each tenant | Maximum security for third-party integrations |
Logical Separation | Schema partitioning or row/column-level controls | Efficient resource management within a shared semantic layer |
Direct Query | Connecting directly to the data warehouse | Real-time data exploration without data movement |
Sharding/Partitioning | Increasing shards (Kinesis) or partitions (Kafka) | Scaling stream storage for high-volume event processing |
How to Implement Embedded Analytics
Once you've ensured performance and security, it's time to bring your embedded analytics solution to life. But implementation isn't just about connecting tools - it's about aligning the technology with your business goals and ensuring your team can execute effectively. Here's how to move from planning to action.
Define Business Goals and Stakeholder Needs
Start by documenting clear use cases and setting measurable success metrics. For instance, you might track pipeline conversion rates or pinpoint workflow bottlenecks. Poor access to insights can directly affect customer retention and platform adoption, so clarity here is crucial.
Assemble a cross-functional team that includes executive sponsors, product owners, technical architects, and compliance experts. Why? Because implementations with well-structured teams are 40% faster than those without clear leadership. This team will guide the process, turning strategic plans into actionable insights.
Next, identify your user personas. Different users have different needs:
Executives prefer high-level KPIs and trend visualizations with minimal interaction.
Power users need advanced filtering, drill-down capabilities, and self-service exploration.
Casual users benefit from pre-built dashboards with guided experiences and contextual help.
Build a quantifiable business case to back your efforts. For example, companies that implement embedded analytics often cut customer support tickets by 60% and save over $400,000 in development costs. On average, clients see a monthly revenue boost of $47,000 within the first quarter of implementation. Data-driven organizations also report higher operational efficiency (81% vs. 58%) and stronger revenue growth (77% vs. 61%).
Select Tools and Technologies
Your analytics stack is built on three key components: the data source (storage), the semantic layer (metrics and security), and the presentation layer (visualization).
Data Source: Choose databases that can handle high concurrency for simultaneous queries. Cloud data warehouses like Snowflake, BigQuery, and Databricks offer scalability for structured data, while specialized databases like ClickHouse and Druid are optimized for real-time, read-heavy analytics.
Semantic Layer: This acts as the single source of truth, ensuring consistent metric definitions like "net sales" across all tools. Positioned between your data warehouse and presentation tools, it centralizes business logic and access controls.
Presentation Layer: Your choice here depends on your customization needs. Options range from out-of-the-box BI tools for quick deployment to fully custom frontends built with React or D3.js for a tailored experience.
Align your tool selection with your team's expertise. For example, in 2020, RamSoft, a medical imaging company, rolled out native embedded analytics to its users in just two weeks by using Cube as their semantic layer. Similarly, SupporTrends built a complete solution in six months, with Looker visualizations taking only two weeks to implement.
Before diving into technical features, define your requirements. Consider factors like the number of independent processors you'll need, your recovery objectives (RPO/RTO), and whether you need real-time streaming or batch processing capabilities.
Integrate Analytics Into Your Platform
With the right tools in place, the next step is embedding analytics seamlessly into your platform.
Start with a staged deployment, focusing on 3–5 high-impact dashboards to gather feedback quickly. This "starter pack" approach allows organizations to beta launch their analytics offering in as little as three to six weeks.
Choose your integration method based on your needs:
Public embedding: Quick to implement but limited in customization. Ideal for publicly shared data.
Private embedding: Suitable for internal users with existing platform logins.
Signed embedding: Offers secure, seamless single sign-on for external applications.
API-first integration: Enables fully customized data experiences but requires more development effort.
"Data analysis occurs within a user's natural workflow, without the need to toggle to another application." – Gartner
To ensure analytics feel like a natural part of your product, implement white-label analytics platforms. This is especially important as poor user experience contributes to low adoption rates, which average just 45%. Seamless integration into your application's flow can significantly improve engagement.
Don't forget to prioritize row-level security (RLS) to maintain multi-tenancy when sharing data with external clients. Use unique external user IDs and dedicated service accounts to isolate tenant data securely. With strategic planning, production-ready solutions can be delivered in as little as 5 weeks, compared to the 18+ months it often takes for in-house builds.
Looking ahead, by 2026, over 80% of software vendors are expected to embed AI capabilities, shifting the focus from descriptive to predictive analytics. It's wise to design your architecture with AI integration in mind from the start.
Conclusion
Embedded analytics architecture reshapes how businesses operate and enhances the way users interact with data. When implemented thoughtfully, it not only streamlines operations but also creates a smooth and intuitive experience for users.
By weaving analytics directly into workflows, you can cut down on the inefficiencies of switching between apps while maintaining data accuracy. Strong security measures ensure that multi-tenant environments remain safe without sacrificing performance or speed.
The shift toward cloud-based, warehouse-focused architectures with decoupled presentation layers represents a modern approach that keeps organizations ahead of the curve. A practical starting point? Focus on three to five impactful dashboards, establish a reliable and unified semantic layer, and ensure analytics blend seamlessly into your platform. This method aligns with the core principles of this architecture: accessible data, consistent semantics, and embedded analytics UX.
With this setup, raw data transforms into meaningful insights, fueling both efficiency and growth.
FAQs
What are the advantages of using a semantic layer in embedded analytics?
A semantic layer transforms complex raw data into a streamlined, business-friendly format. By centralizing metric definitions and hierarchies, it ensures everyone in your organization is working from the same playbook. This consistency eliminates the headaches of conflicting KPIs or redundant data transformations, cutting down on errors and paving the way for smarter decisions.
By translating data into terms that make sense to business users, the semantic layer enables both technical and non-technical teams to uncover insights on their own. This fuels self-service analytics, speeds up the decision-making process, and lightens the load on data teams by reducing repetitive query requests. At the same time, it enforces governance, making sure every tool - whether it’s a dashboard or embedded analytics - delivers data that’s consistent and trustworthy.
When it comes to embedded analytics, the semantic layer ensures that business logic and metrics stay consistent across all embedded platforms. This not only boosts dashboard reliability but also makes integration easier. Developers can then focus on crafting a seamless user experience without getting bogged down by data complexities.
What are the cost and scalability differences between cloud-based and on-premises deployment?
Cloud-based deployment often lowers initial expenses because providers take care of the hardware, software, and maintenance through a pay-as-you-go model. This approach transforms hefty capital investments into manageable operational costs, eliminating the need to purchase servers, storage, or networking equipment upfront. In contrast, on-premises solutions demand significant initial spending on hardware, along with ongoing costs for staff or external services to maintain and manage the infrastructure.
In terms of scalability, cloud platforms shine by offering virtually unlimited resources that can be adjusted automatically based on demand. This flexibility allows businesses to handle large-scale analytics without needing extra hardware. On the flip side, on-premises systems are constrained by their existing hardware. Scaling up means buying, installing, and configuring new equipment - a process that’s not only expensive but also time-consuming. Plus, it often results in over-provisioning to ensure peak usage needs are met.
What are the key security practices for protecting data in embedded analytics?
Protecting data in embedded analytics involves setting up solid security measures to maintain data integrity and block unauthorized access. A key step is environment isolation - running embedded analytics on a separate instance from internal systems. This separation reduces vulnerabilities and limits the chances of accidental data exposure.
Another important practice is enforcing data-source restrictions. Only connect the specific tables or views needed for the embedded analytics experience. By sticking to the principle of least privilege, you significantly lower the chances of unauthorized data access.
Additional safeguards include implementing strong authentication and role-based access control (RBAC), encrypting data during transit (using TLS/HTTPS) and while stored, and enabling audit logging to monitor and review system activities. These combined efforts ensure sensitive data remains protected while providing users with secure and accurate insights.
Related Blog Posts


