Business Intelligence
modern self service BI stack
Live warehouses, AI natural-language queries, and governed semantic layers enable faster, accurate self-service analytics and reduce IT bottlenecks.
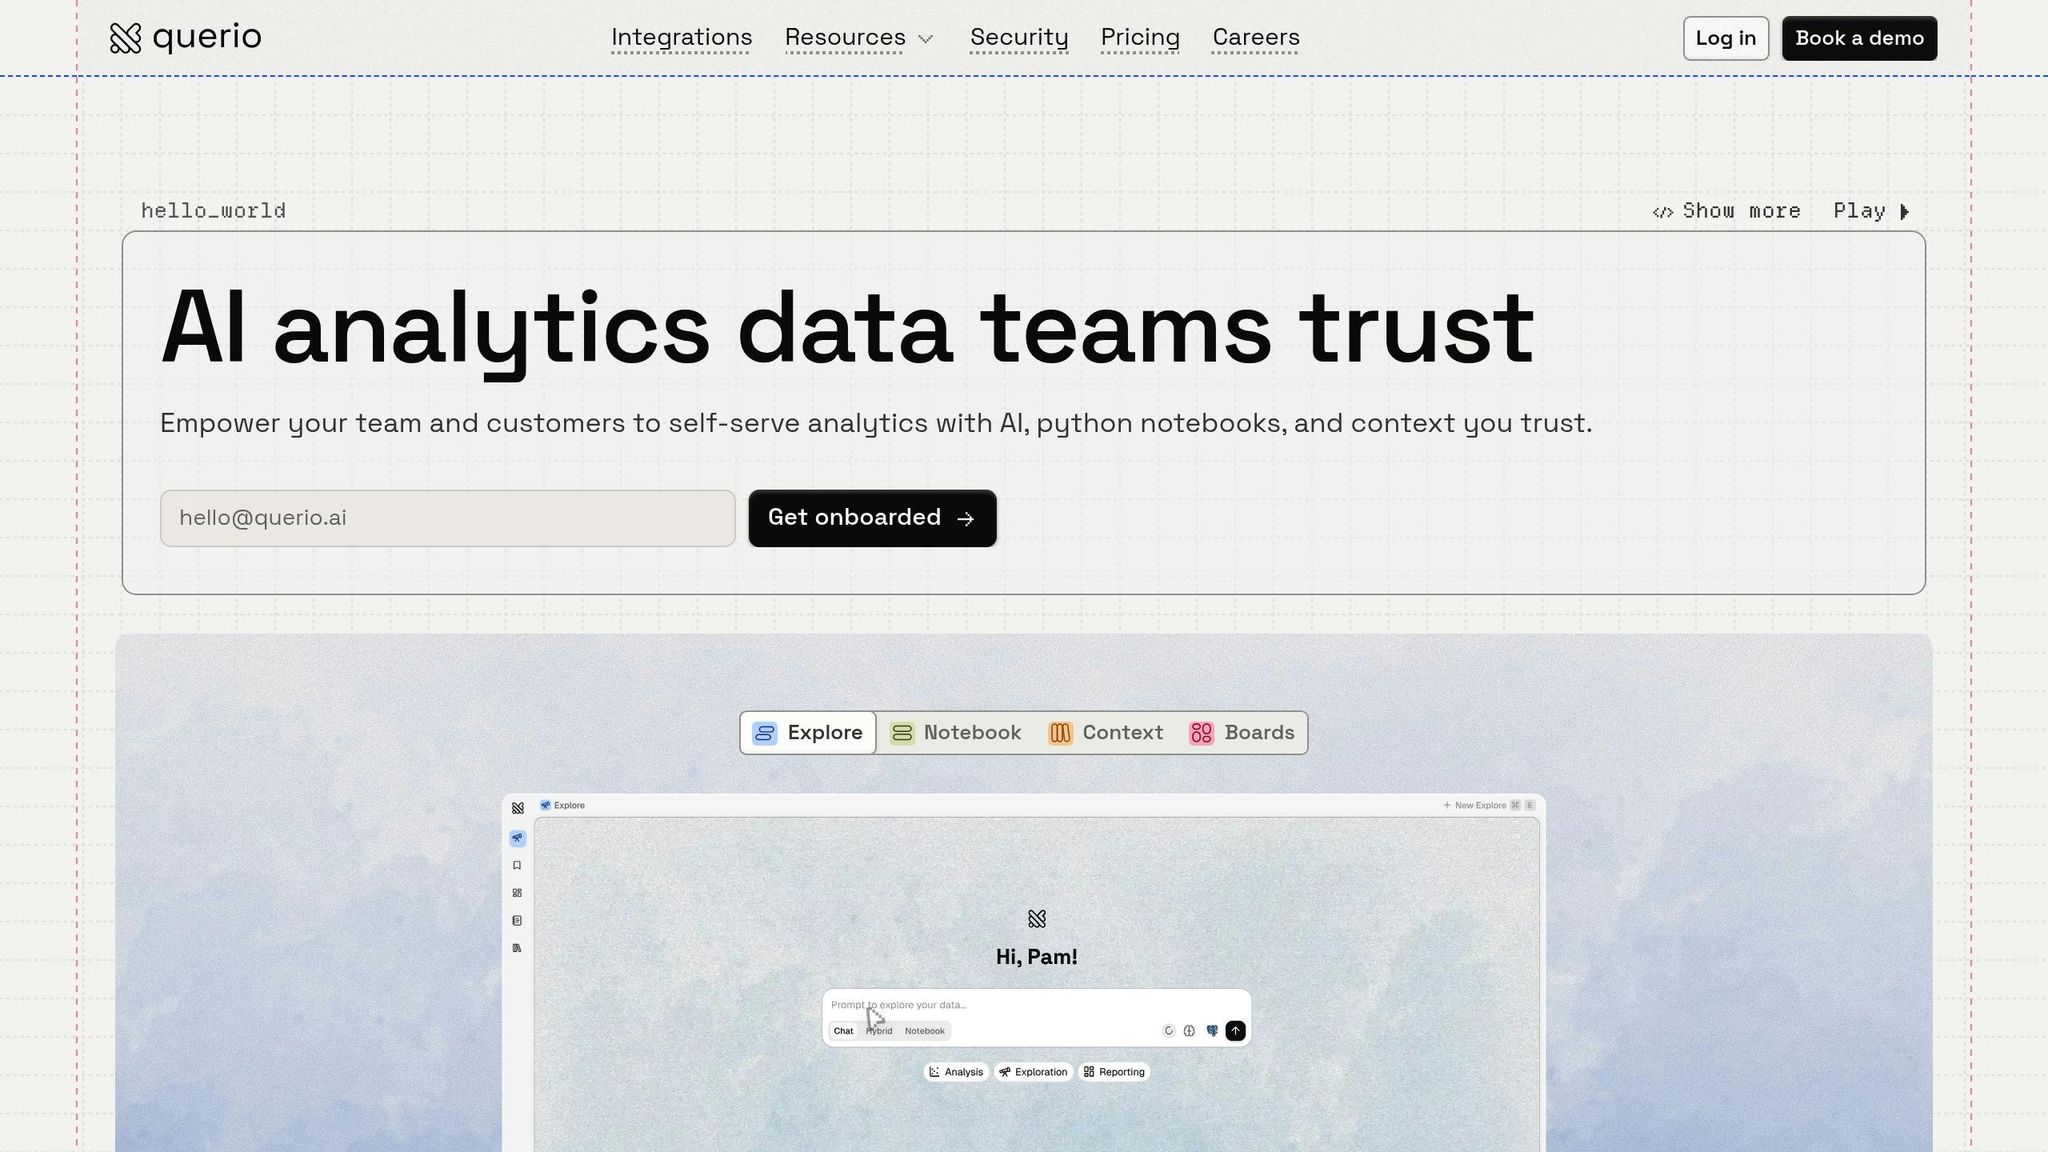
Self-service BI tools are changing how businesses use data. They let non-technical users analyze data without waiting for data teams, enabling faster decisions and reducing bottlenecks. Platforms like Querio use AI to turn plain English questions into accurate SQL or Python queries, providing real-time insights from live data warehouses. This ensures transparency, accuracy, and consistency across teams.
Key Highlights:
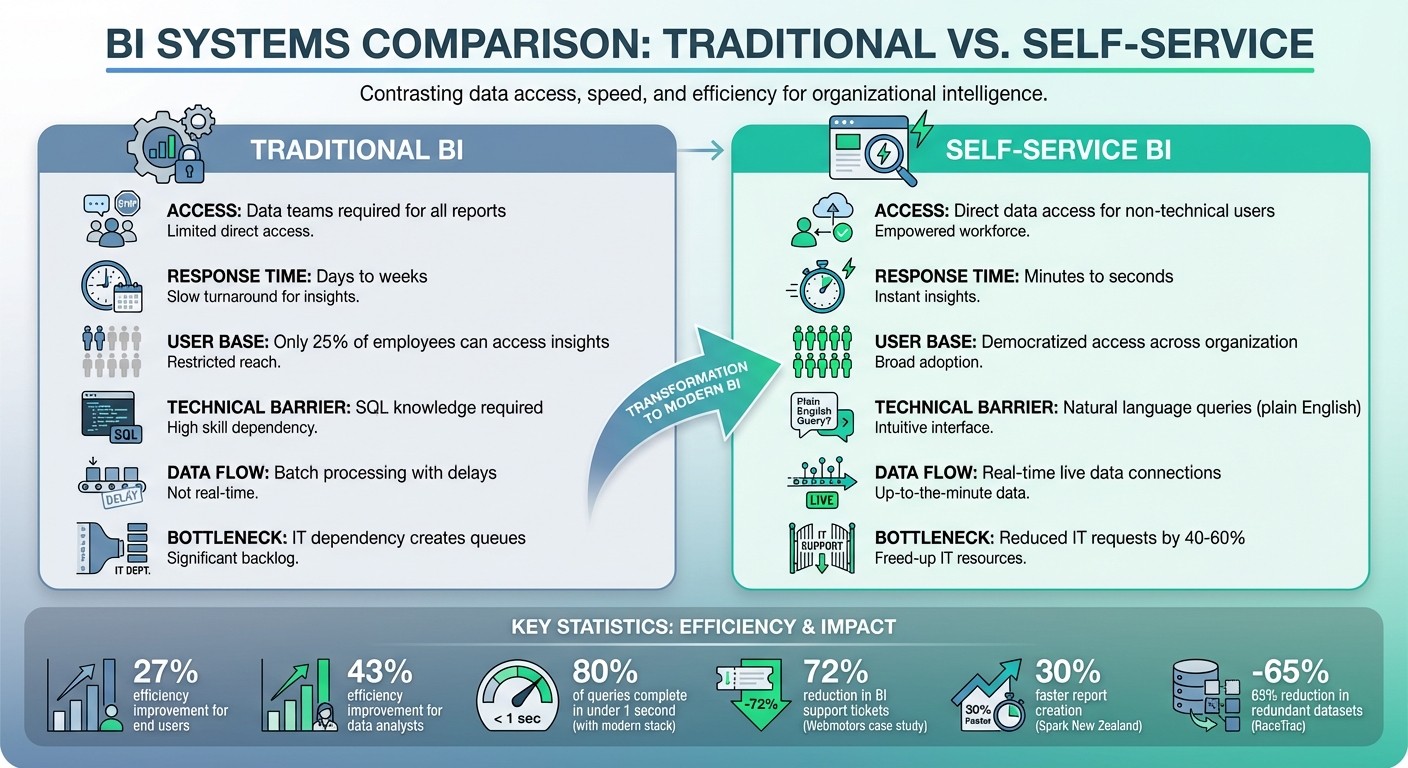
Traditional BI vs. Self-Service BI: Traditional BI relied on data teams for reports, causing delays. Self-service BI gives direct access to data, cutting response times from days to minutes.
Core Features of Self-Service BI:
Live Data Warehouse Connections: Direct integration with tools like Snowflake, BigQuery, and Redshift avoids delays and duplication.
AI-Powered Queries: Users can ask questions in natural language and see the generated SQL or Python for transparency.
Governed Semantic Layers: Ensures consistent metrics and definitions across teams.
Benefits: Faster insights, reduced IT dependency, and improved collaboration across departments like marketing, finance, and sales.
Querio’s Role: Combines natural language analytics, reactive notebooks, and live data connections, making it easier for teams to work with data while maintaining governance.
Self-service BI isn’t just a tool; it’s a shift in how businesses approach data. By simplifying access and ensuring accuracy, it empowers teams to act quickly and confidently.
Traditional BI vs Self-Service BI: Key Differences and Benefits
Data Mesh & Self-Service BI: A New Era for Analytics
Core Components of a Self-Service BI Stack
A modern self-service BI stack relies on three key elements: data warehouse connections, AI-powered query interfaces, and governed semantic layers. Together, these components ensure fast, accurate insights while preserving data accuracy and consistency. Let’s break down how each piece fits into the bigger picture.
Data Warehouse Integration
At the heart of any self-service BI stack is a real-time connection to your data warehouse. Tools like Querio integrate directly with popular data warehouses such as Snowflake, BigQuery, Redshift, and Postgres. This setup eliminates the need to copy data into separate BI systems, reducing delays and inconsistencies.
By querying the warehouse in real time, you avoid batch processing delays, extra storage costs, and potential security issues. The platform uses secure, read-only access, ensuring your source data remains untouched while still delivering up-to-date insights. This real-time connection forms the backbone for intuitive, AI-driven queries.
AI-Powered Query Interfaces
Natural language interfaces are changing how users interact with data. Instead of writing complex code, users can ask questions in plain language, like "What were our top-selling products in the Northeast last quarter?" Querio’s AI then translates these queries into precise SQL or Python code. It even retains context between questions, so follow-ups like "What about the Southwest?" don’t require starting over.
A standout feature of modern AI interfaces is transparency. Users can view the generated SQL or Python code to see exactly how results are calculated. This not only builds trust but also helps users better understand their data. Additionally, the AI selects the most suitable visualizations - whether it’s a bar chart, line graph, or map - based on the query and data type.
While AI simplifies querying, the accuracy of the results depends on the consistency provided by a governed semantic layer.
Governed Semantic Layers
To ensure precise and consistent analysis, governed semantic layers play a critical role. They transform raw data into standardized business metrics, ensuring everyone across the organization is working with the same definitions. For example, metrics like Monthly Recurring Revenue or Customer Lifetime Value are predefined, so a marketing manager and a finance analyst will always pull identical figures.
This layer also manages table relationships, join logic, and business rules to prevent common mistakes. For instance, when someone queries "customers", the system knows how to exclude test accounts or inactive users automatically. Querio’s Context Layer centralizes these definitions, creating uniform metrics that every team can rely on. This consistency strengthens data-driven decision-making across the organization.
Key Features of Querio in the BI Stack
Querio brings a suite of essential BI features designed to support data-driven teams in achieving fast, reliable insights while maintaining strict governance. Positioned as an AI-native analytics workspace, Querio eliminates many of the complexities tied to traditional BI tools. Instead of requiring deep technical expertise or delivering results that feel opaque, it merges natural language querying, collaborative notebooks, and live data warehouse connections into one cohesive platform. This approach directly tackles a major challenge faced by data teams: 56% cite poor data quality as their biggest obstacle[2]. Governed AI tools like Querio address this issue head-on, making them an essential part of modern BI workflows.
Natural Language Analytics with AI Agents
Querio's AI agents simplify data exploration by converting plain English questions into inspectable SQL and Python code. For instance, if you ask, "What were our top-selling products in the Northeast last quarter?", the platform not only delivers the answer but also displays the generated query. This transparency builds trust and helps users better understand their data.
What sets Querio apart is its governance-first AI approach. By integrating directly with dbt transforms and your data warehouse, it ensures that queries align with accurate business definitions rather than making assumptions about table relationships. Structured workflows continuously monitor AI outputs, alerting teams to potential performance issues, which helps maintain long-term accuracy. Non-technical users can even ask follow-up questions like "What about the Southwest?" without starting from scratch, while data teams retain full control over the underlying logic. This blend of transparency and control makes advanced analysis accessible to everyone.
Reactive Notebooks for Advanced Analysis
To complement its query capabilities, Querio includes a dynamic notebook environment that enhances both analysis and collaboration. These reactive notebooks allow for iterative work: when you update a metric or adjust a filter, dependent cells automatically recalculate, ensuring your analysis stays accurate and current.
The notebooks integrate seamlessly with semantic layers like dbt, enabling analysts to reuse centralized metrics and definitions without duplicating code. Teams can share their work, build on each other's analyses, and ensure consistency across projects. This collaborative environment has proven benefits, as seen with Spark New Zealand, which reduced Power BI report creation time by 30% after modernizing their data operations and cataloging over 900 ML features for more than 200 users[1].
### Warehouse-Native Data Warehouse Connections
Querio connects directly to live data warehouses such as Snowflake, BigQuery, Amazon Redshift, ClickHouse, and PostgreSQL, using encrypted, read-only credentials. These connections ensure your data remains secure while allowing real-time access and scalability. Since Querio works directly with your existing access controls, there's no need for additional infrastructure or complex ETL pipelines. This direct connection method ensures that your data stays protected while enabling real-time insights, making it easier for teams to scale as their data grows.
How to Build and Scale Your Self-Service BI Stack
Integration with Existing Data Infrastructure
Getting Querio up and running with your current data warehouse is surprisingly quick - typically 30 to 60 minutes. Start by setting up a secure, read-only connection using RSA key-pair encryption or IP whitelisting. Querio connects directly to major data warehouses, eliminating the need for data extracts or duplicates.
Next, link Querio to your semantic layer, whether that's dbt or another governance framework. This ensures that AI-generated queries follow your business rules, table relationships, and metric logic. For security, enable SSO (via SAML or OAuth) and configure role-based permissions to align with your existing policies. Once everything is in place, test the sync to confirm your dashboards display live, accurate data.
Following these steps can lead to noticeable improvements. For instance, Spark New Zealand transitioned to a cloud-based setup with Snowflake, cataloging over 900 machine learning features for more than 200 users. This shift sped up Power BI report creation by 30%[1]. Similarly, RaceTrac cut redundant datasets by 65%, reducing their total from 725 to 250, by building a lakehouse on Azure and Databricks with robust governance[1].
Once your data infrastructure is integrated, the next phase is enabling self-service analytics across your organization.
Scaling Self-Service Analytics Across Teams
With a secure and integrated system in place, the focus shifts to encouraging adoption across teams. A solid data foundation makes it easier to roll out user-friendly analytics tools. Start by introducing Querio to pilot teams in departments like marketing, finance, or product management - teams that need data often but may not have SQL expertise. Train them to use natural language BI capabilities, teaching them how to ask questions in plain English and review the generated code. This transparency fosters trust and boosts confidence in the tool.
Develop shared dashboards and templates that teams can quickly adapt. When one analyst creates a reliable report, others can tweak it for their needs without starting from scratch. Track adoption progress with clear metrics: aim for at least 70% monthly active users, a 40–60% drop in IT data requests, and a 50% faster time-to-insight. As more teams adopt the system, document your data assets, implement lineage tracking, and certify critical datasets to maintain accuracy and reliability.
Benefits and Use Cases of the Self-Service BI Stack
Faster Decision-Making with Real-Time Insights
A modern self-service BI stack can shrink decision-making timelines from days to hours - or even seconds. By enabling users to query live data directly, it eliminates the need to wait for queued analyst reports. This marks a shift from traditional BI systems, where only 25% of employees could access insights due to the technical hurdle of SQL queries[4].
AI-powered analytics make a big difference here, improving efficiency by 27% for end users and 43% for data analysts[4]. This allows technical teams to focus on more advanced tasks, like predictive modeling, instead of being bogged down with routine reporting. For instance, a major home improvement retailer achieved a staggering 80% of data queries completing in under one second after implementing a semantic layer and modern BI stack. This improvement drastically sped up decision-making at the executive level[2]. Similarly, Webmotors, a Brazilian automotive marketplace, cut BI support tickets by 72% in November 2024 after introducing natural-language data access, saving hundreds of analyst hours every month[5].
Real-time data exploration also supports "what-if" analysis, which is invaluable across departments. Marketing teams can tweak campaign strategies on the fly, finance teams can instantly model budget adjustments, and product managers can monitor feature adoption without waiting for lengthy reports. These capabilities highlight the transformative impact of self-service BI, offering businesses the speed and flexibility they need to stay competitive.
Applications in Fintech and E-Commerce
Beyond faster decisions, self-service BI offers tailored benefits for specific industries like fintech and e-commerce. In fintech, it plays a crucial role in real-time fraud detection. By processing transaction data instantly, these systems can identify suspicious activity on the spot. A semantic layers vs traditional data models ensures consistent and accurate calculations, while non-technical finance teams can access clear, visualized data in plain language.
For e-commerce, self-service BI enhances dynamic inventory management by linking BI tools directly to live data warehouses. This allows pricing algorithms to adjust in real time based on supply and demand. Customer-facing dashboards, embedded in CRMs via iFrames or APIs, let account managers track order statuses and delivery timelines without needing to switch platforms. By early 2026, 98% of Databricks SQL customers had adopted AI/BI tools to make data more accessible[5]. Additionally, these tools are evolving toward agentic AI - systems that autonomously monitor metrics and alert teams to anomalies. This proactive approach helps businesses address potential issues before they escalate into costly problems.
These examples illustrate how self-service BI enables operational agility and precision, making it a game-changer for industries like fintech and e-commerce. Whether it’s fraud detection or real-time inventory management, the ability to act on live data is reshaping how businesses operate.
Conclusion: Choosing and Scaling Your BI Platform
Key Takeaways for Data-Driven Teams
Building a modern self-service BI stack hinges on three essential components: live querying, AI-powered insights, and strong governance. By connecting directly to your data warehouse, you avoid duplicating data and gain access to real-time updates. Natural language interfaces make it easier for non-technical users to explore data, while a governed semantic layer ensures that metrics remain consistent across the board.
Real-world examples show the impact of these strategies. RaceTrac reduced redundant datasets by 65%, and Spark New Zealand cut report creation time by 30% - all thanks to modern, cloud-based architectures that prioritize governance and agility[1]. Together, these elements form the foundation of a BI platform designed to enable faster and smarter decision-making.
Why Querio is the Right Choice
Querio stands out as a top contender for teams looking to build or scale their self-service BI capabilities. Its inspectable AI outputs and shared context layer eliminate the headaches of version control by ensuring consistent joins, metrics, and definitions across all tools. With Querio, teams can define logic once and apply it universally.
What makes Querio even more appealing is its straightforward pricing model. With annual flat-rate plans starting at $10,788, it offers a cost-effective solution that scales with your needs. As organizations evaluate BI platforms in 2026, the priorities are clear: invest in AI tools that empower non-technical users, ensure real-time integration with your data systems, and demand governance to maintain metric reliability[3]. Querio checks all these boxes, making it a smart choice for teams aiming to expand self-service analytics while maintaining control.
FAQs
How do I prevent wrong metrics in self-service BI?
To steer clear of incorrect metrics in self-service BI, start with a governed metric catalog. This helps standardize definitions, assign clear ownership, and manage metadata, ensuring calculations remain consistent and errors are minimized.
Using semantic layers is another key step. These layers centralize metric definitions, preventing discrepancies and establishing a reliable single source of truth.
Additionally, make sure to offer proper training and set up validation workflows. This is especially important when non-technical users are involved in creating or modifying metrics, as it helps maintain accuracy across the board.
What permissions are required for live warehouse access?
To work with a live data warehouse, you'll need read-only permissions via a service account, along with role-based access controls (RBAC) and safeguards like row-level security (RLS). These tools help ensure that data queries are both secure and restricted to authorized users, keeping sensitive information protected.
How can we measure self-service BI adoption and ROI?
Measuring the success of self-service BI requires keeping an eye on a few key factors. Start with user engagement - how often are non-technical users interacting with the tools? Look for trends in IT ticket reduction, as fewer requests for reports or data access often signal effective adoption. Another important metric is decision-making speed - are teams making faster, more informed choices?
You’ll also want to evaluate the frequency and quality of insights generated by non-technical users. Are these insights driving measurable improvements in business outcomes? Don’t overlook data governance and metric consistency - ensuring that everyone works with reliable, standardized data is essential for long-term success.
For a full picture, combine quantitative metrics like time and cost savings with qualitative feedback from users. This blend helps you understand not just the numbers, but also how people feel about the tools and their impact on everyday work.
Related Blog Posts


