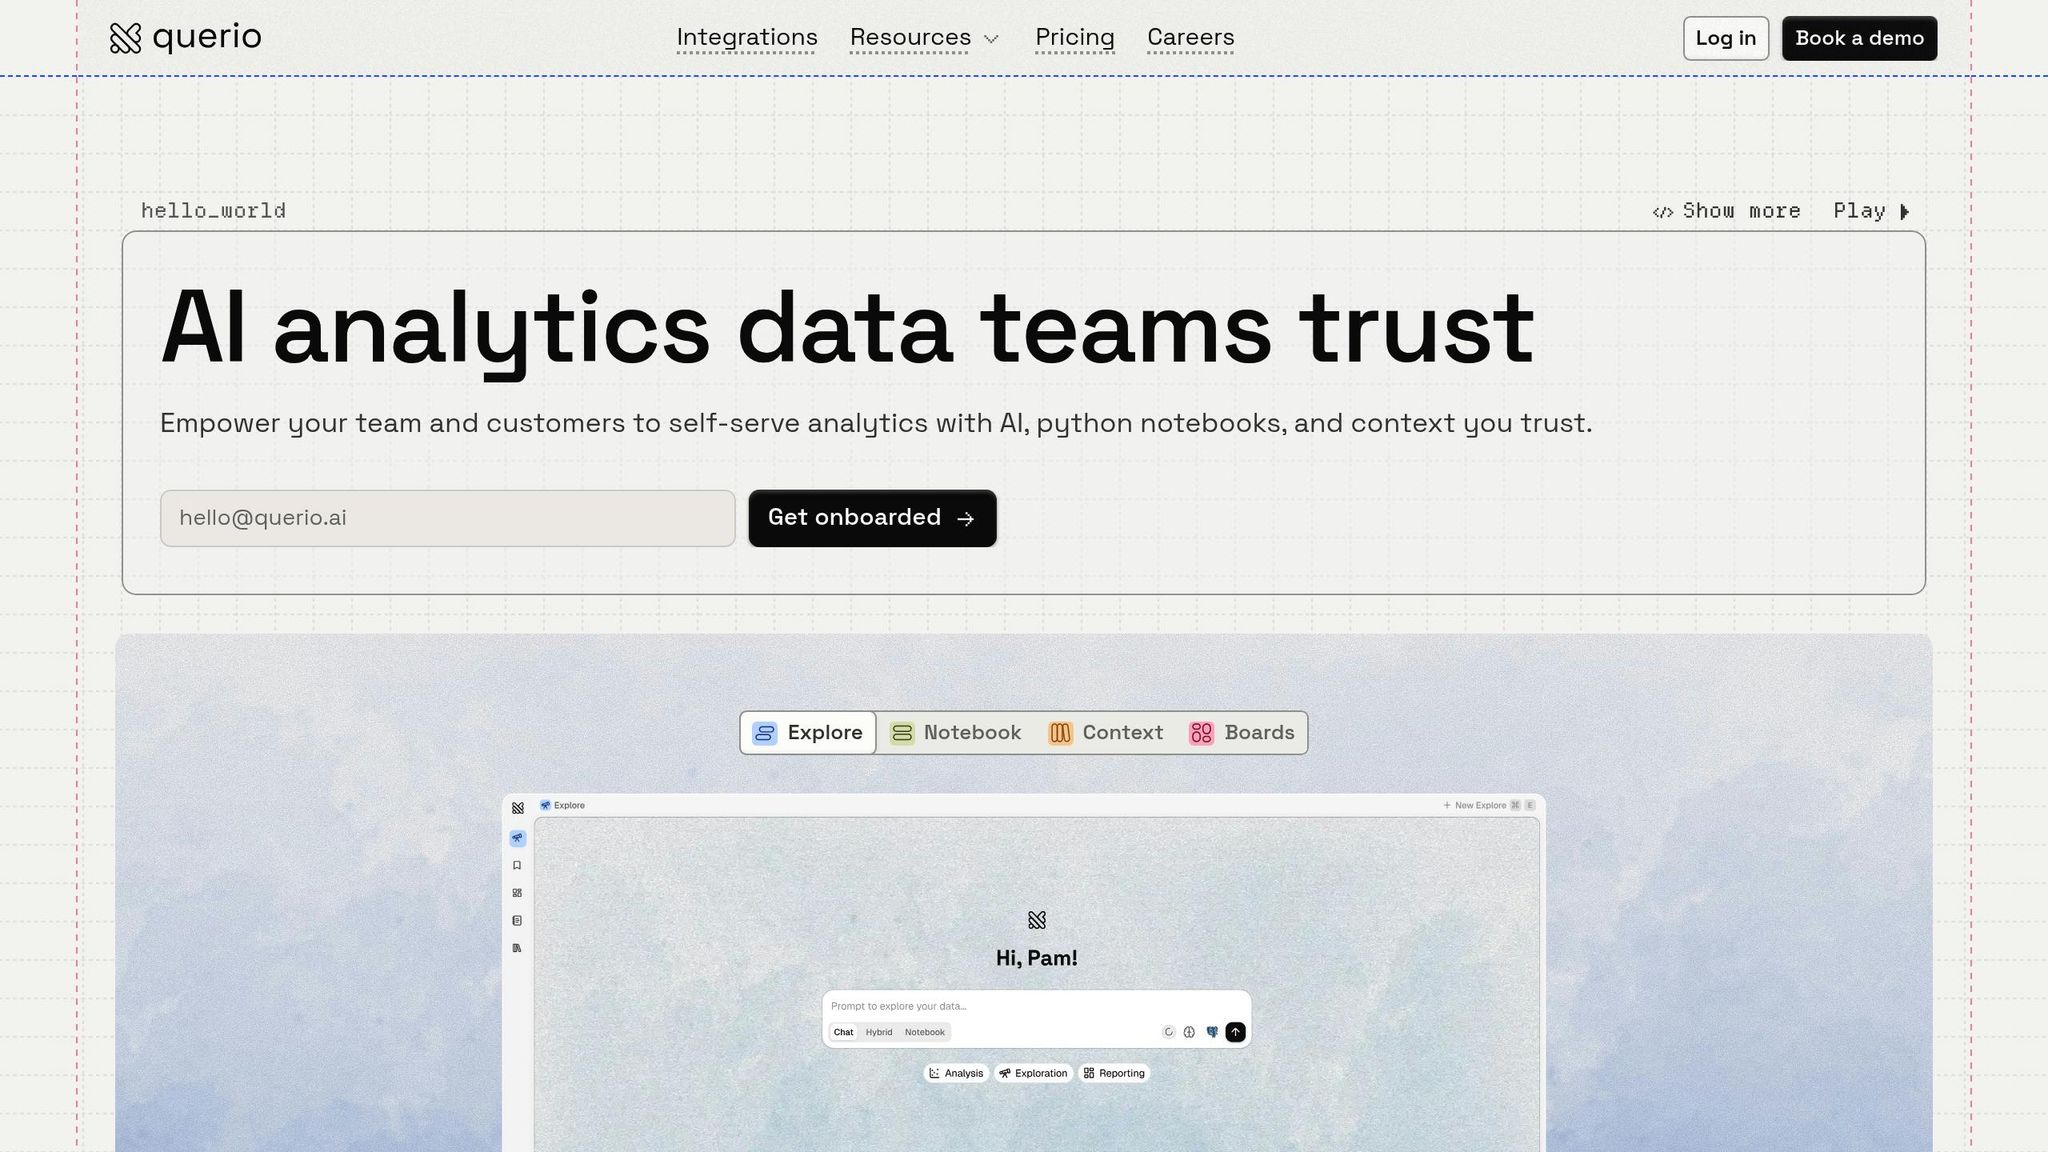
Business Intelligence
business user analytics tools no code
Query live warehouse and database data in plain English, get real-time dashboards, shared metrics, and viewable SQL/Python without writing code.
No-code analytics tools let you analyze data without writing code. Instead of waiting for technical teams, you can ask questions in plain English and get instant answers from live data sources like Snowflake or BigQuery.
Key highlights:
Self-service analytics: Business users can access data without needing SQL or Python skills.
Live data connections: Tools like Querio pull real-time data directly from platforms like Snowflake, BigQuery, and PostgreSQL.
Shared semantic layer: Ensures consistent metrics and definitions across teams.
Transparency: View the SQL or Python code behind every result for accuracy checks.
Dashboards and reports: Automate updates and share insights easily.
Querio simplifies analytics for teams, reducing dependency on analysts and speeding up decision-making.
Querio's Core Features for Business Analytics
Ask Questions in Plain English
Querio makes data analysis simple by turning plain English questions into SQL and Python queries that run on live data. For example, a product manager can type something like, "What were our top products last quarter?" and instantly get results pulled directly from platforms like Snowflake or BigQuery. To make things even easier, Querio automatically chooses the best way to display the data - whether that's a bar chart, line graph, or table.
What sets Querio apart is its transparency. Every result comes with the underlying SQL or Python code, so users can review the logic and ensure accuracy. Plus, the platform connects to data warehouses using encrypted, read-only credentials. This keeps your source data secure while still providing real-time insights.
On top of that, Querio unifies business logic across teams using a shared context layer, making collaboration smoother and more consistent.
Shared Context Layer for Consistent Metrics
The shared context layer acts as a single source of truth for your organization's data. It’s like a centralized business glossary where data teams define table relationships, metrics, and key terms one time for everyone to use. For instance, when a sales team member queries "revenue" and a finance analyst does the same, both will see identical results because the definition is stored in one place. This eliminates the confusion and errors that often come with separate spreadsheets and mismatched formulas.
This layer also powers Querio's AI, ensuring natural language queries are translated into accurate code. Data teams stay in control of the business logic, while other departments can perform self-service analysis without the risk of altering the original data.
Dashboards, Reports, and Embedded Analytics
Querio’s framework also streamlines routine reporting with live dashboards and embedded analytics. Teams can create KPI dashboards that automatically update, removing the need for manual exports and outdated snapshots. The shared context layer ensures that the same consistent logic applies to everything - whether it’s a report for internal use or insights shared with customers via APIs or iframes. This approach keeps everyone on the same page, no matter where the data is being used.
No Code Data Analytics
Supported Data Sources and Integrations
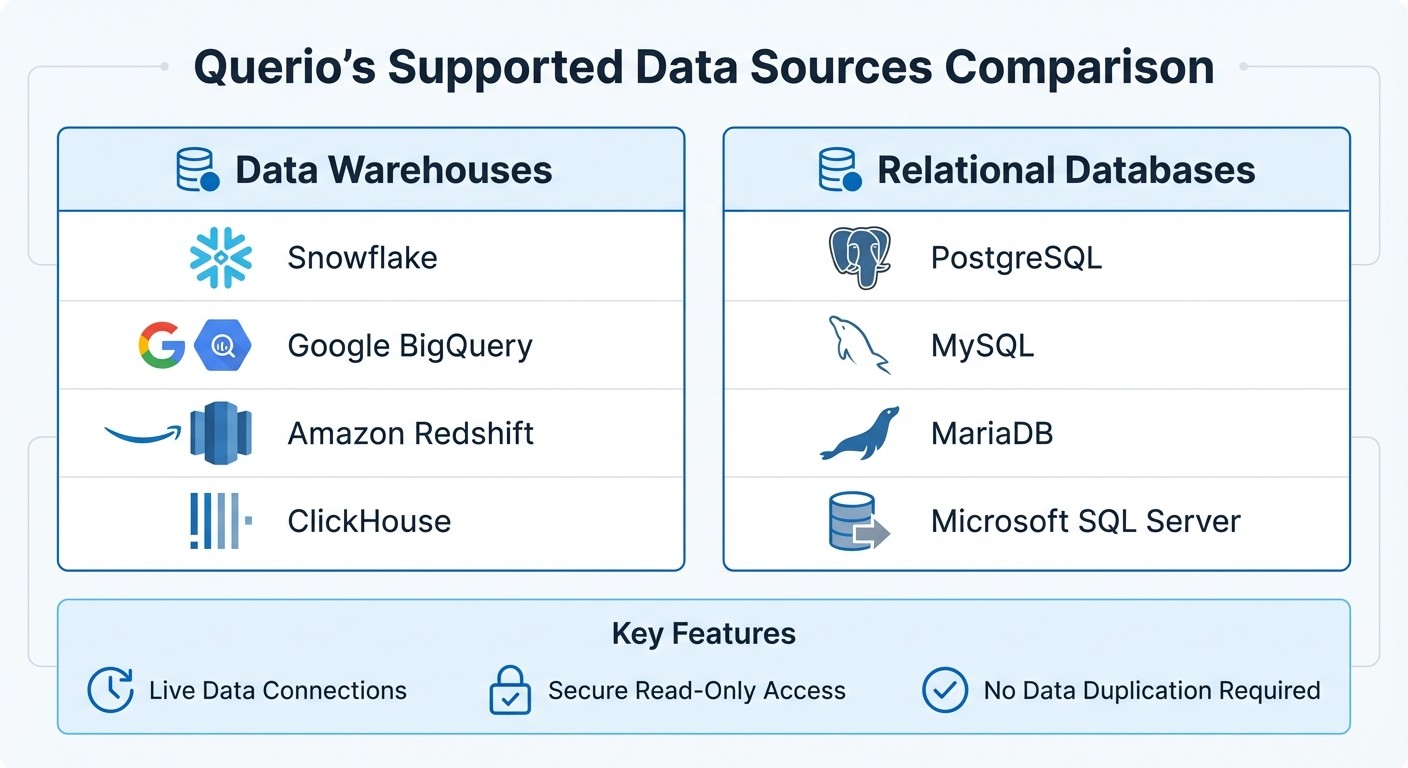
Querio Supported Data Sources: Data Warehouses and Relational Databases
Data Warehouse Support
Querio connects directly to Snowflake, Google BigQuery, Amazon Redshift, and ClickHouse, allowing business teams to access live data without the hassle of moving or duplicating it. This ensures you're always working with the freshest data from your existing setup - no extracts, outdated snapshots, or manual transfers required.
The platform uses secure, read-only connections to access your data warehouse, keeping your source data safe while enabling real-time queries. Whether you're managing customer data in Snowflake or performing analytics on BigQuery, Querio integrates effortlessly, generating SQL queries for business users directly in your live environment. This eliminates the delays typically associated with scheduled data exports.
Category | Supported Data Sources |
|---|---|
Data Warehouses | Snowflake, Google BigQuery, Amazon Redshift, ClickHouse |
Relational Databases | PostgreSQL, MySQL, MariaDB, Microsoft SQL Server |
Querio's live querying model and secure connections also extend to traditional relational databases.
Relational Database Connections
Querio doesn't stop at data warehouses - it also supports PostgreSQL, MySQL, MariaDB, and Microsoft SQL Server. This means teams relying on relational databases can leverage natural language analytics without switching platforms.
With the same real-time querying capabilities, users can pose questions in plain English, and Querio translates them into SQL queries that execute against databases like PostgreSQL or MySQL. This approach broadens Querio's reach across your data stack, whether you're analyzing transactional data in MySQL or extracting metrics from a PostgreSQL instance.
How Business Teams Use Querio
Track KPIs and Automate Reporting
Business teams rely on Querio to create real-time dashboards that keep tabs on critical metrics - no IT assistance required. By connecting directly to data warehouses like Snowflake or BigQuery, the platform ensures data is always up-to-date, automatically refreshing as new information flows in.
Querio also simplifies reporting with automated scheduling. Teams set up reports once, choose the format, select recipients, and let the platform handle the rest. Reports are delivered on a fixed schedule, ensuring stakeholders get consistent updates without anyone needing to manually export or format spreadsheets.
Thanks to the shared Context Layer, all automated reports align with your organization’s business logic. For example, when data teams define metrics like "qualified leads" or "monthly recurring revenue", those definitions are applied universally across dashboards and reports. This eliminates discrepancies caused by departments calculating the same metric in different ways.
With this level of automation, teams not only save time but also gain the foundation to explore more advanced self-service analytics.
Enable Product Teams to Self-Serve
Product teams can dive into data without waiting for custom reports. Querio allows them to ask questions in plain English - like "How many users tried the new checkout flow last week?" - and get immediate answers powered by live SQL queries.
This self-service capability empowers product teams to experiment, validate feature ideas, and track adoption metrics whenever they need. Instead of waiting days for analysts to deliver insights, they can refine their questions and visualizations on the spot. This agility helps them make informed decisions about product roadmaps and user experience tweaks in real time.
Reduce Analyst Workload with AI
Querio’s AI takes self-service a step further by automating routine data queries. It translates plain English questions into precise SQL, delivering instant answers without requiring human input.
This approach reduces bottlenecks, giving business users direct access to the insights they need while freeing analysts from repetitive tasks. With less time spent on basic requests, data teams can focus on strategic projects and complex analyses. Meanwhile, the shared Context Layer ensures all metrics remain consistent and accurate, even as more users across departments independently explore the data.
Getting Started with Querio
Pricing and Free Trial
Querio offers a free trial with unlimited usage and seats, giving teams the chance to dive in and explore the platform fully before making a decision. This means you can connect your actual data warehouse, run plain English queries, and see how they seamlessly convert into accurate SQL results. It’s a hands-on way to see if the tool fits your needs.
The pricing model is based on a per-workspace structure, which includes unlimited viewers. This setup is ideal for teams that need to share dashboards and reports across various departments. Whether it’s customer success managers, regional sales teams, or product teams, everyone can access the insights they need without driving up costs. Plus, Querio is backed by a money-back guarantee, giving you peace of mind as you transition from the trial to full use. Once you're ready to move forward, onboarding is quick and supported with guided resources.
Onboarding and Support Resources
After exploring the pricing and features, getting started with Querio is straightforward. The platform connects directly to your data warehouse using secure credentials, and it supports major systems like Snowflake, BigQuery, and PostgreSQL - no need for complicated ETL pipelines. During onboarding, you’ll configure a metrics and semantic layers to align data with your organization’s definitions. For example, when someone asks, “What’s our monthly recurring revenue?” the platform ensures the answer reflects your company’s standards.
Querio offers comprehensive documentation to help with setup and feature navigation. You can also book a demo to see tools like the AI Chart Builder and Python notebooks in action. Thanks to its natural language BI capabilities, non-technical users can start querying data in plain English as soon as the semantic layer is set up. Additionally, an automated data health monitor works behind the scenes to maintain accuracy and reliability as your team expands its use of the platform.
Why Choose Querio for Business Analytics
Simple to Use, Reliable Results
Querio makes analytics accessible to everyone by combining plain English querying with a centralized semantic layer. This means business users can ask straightforward questions like, "What was our customer churn rate last quarter?" and get precise answers. Plus, Querio provides full transparency, showing exactly how calculations are made with detailed data lineage. This ensures consistent metrics and definitions across the organization, putting an end to the confusion caused by inconsistent analytics.
For added trust, Querio displays the SQL or Python code behind every answer, giving data teams the ability to verify and audit results. This avoids the pitfalls of "black box" analytics, where unclear processes can lead to errors. For instance, if the finance team asks about revenue, they’ll get an answer that automatically excludes refunds, based on a centralized, version-controlled definition. These features make Querio a powerful tool for scaling analytics in fast-paced business environments.
Built to Grow with Your Team
Querio is designed to grow alongside your organization. Whether your team has 10 or 500 users, the platform ensures everyone works from the same consistent metrics and definitions. Role-based permissions and centralized governance prevent metric silos, while the unlimited viewer model means teams like customer success, regional sales, and product management can access insights without extra costs. Thanks to flat-rate pricing, you can share data across your organization without worrying about escalating expenses.
What Sets Querio Apart
Querio stands out by combining live warehouse querying, centralized semantic governance, and AI-driven insights for instant, real-time results. The AI understands business context, making it easy to ask follow-up questions, and even sends automatic alerts for key KPI changes. This approach has helped teams cut their workloads by 50-70%, enabling self-service analytics without sacrificing precision.
Getting started is straightforward: connect your data warehouse, define shared metrics, and launch role-based dashboards. Querio also ensures enterprise-grade security with a 99.9% uptime SLA and compliance with SOC 2 Type II, CCPA, and GDPR standards. It’s a solution built for businesses that value both reliability and simplicity.
FAQs
How do I set up the shared context layer?
Setting up a shared context layer in a no-code analytics platform like Querio is straightforward and doesn't require any technical skills. Here's how you can do it:
Connect your data sources: Use simple drag-and-drop tools or natural language queries to link your data sources effortlessly.
Define key metrics and KPIs: Establish the essential metrics and KPIs that will remain consistent across all dashboards, ensuring everyone works with the same data definitions.
Organize into a shared semantic layer: Group these metrics into a shared layer to create unified insights for your team or organization.
Save and publish: Finalize by saving and publishing the layer, making it accessible to all users for consistent and reliable data access.
By following these steps, you can ensure your team works from the same playbook when it comes to data insights.
What permissions can I control for different teams?
Managing permissions for different teams is straightforward with access levels. You can assign roles such as content viewing, editing, or administrative rights. This setup lets administrators decide what each team can see, change, or control on the platform. It’s a practical way to provide tailored access that aligns with your organization’s specific requirements.
How do I validate the SQL behind an answer?
To confirm the accuracy of the SQL behind an answer in a no-code analytics tool, look for features like "View SQL" or "Query Details" within the platform. These options allow you to review the generated SQL directly. If available, test the query to ensure it delivers the expected results.
If the tool doesn’t let you inspect SQL directly, double-check the settings in the visual query builder to make sure everything aligns with your requirements. Alternatively, see if the platform allows you to export the query for testing in an external database tool. This can help verify its correctness outside the no-code environment.
Related Blog Posts