Business Intelligence
How Lean Data Teams Deliver Company-Wide Self-Service Analytics
Lean data teams certify core KPIs, build a governed semantic layer, and cut ad hoc requests 30–50% to enable company-wide self-service.

Self-service analytics works when I give teams governed access to a small set of certified metrics instead of raw tables. For a 100–500-person B2B SaaS company, that usually means defining 10–20 shared KPIs, putting the logic in a semantic layer, and tracking whether ad hoc requests drop by 30% to 50% within 3–6 months.
Here’s the short version:
- I certify the few metrics the company uses every week
- I model shared logic once so sales, product, and finance stop using different formulas
- I separate certified and exploratory data
- I apply role, row, and column controls in the query layer
- I turn repeat requests into models, notebooks, and dashboards
- I measure success with ticket volume, time-to-answer, dashboard reuse, and certified-model usage
If I skip those steps and let people self-serve from raw tables, the same thing happens every time: teams get different numbers, trust drops, and analysts end up back in the reporting queue. One cited survey in the piece says some data teams spend up to 50% of their time on ad hoc reporting.
A simple rollout path looks like this:
- Start with one domain, like sales or subscription revenue
- Lock down 10–20 weekly KPIs with named owners
- Publish governed dashboards and plain-English querying on live warehouse data
- Review usage and request volume each month
- Expand one domain at a time only after teams trust the numbers
In other words: self-service is not about giving more table access. It’s about giving the right access, on top of shared definitions, with clear rules.
::: @figure 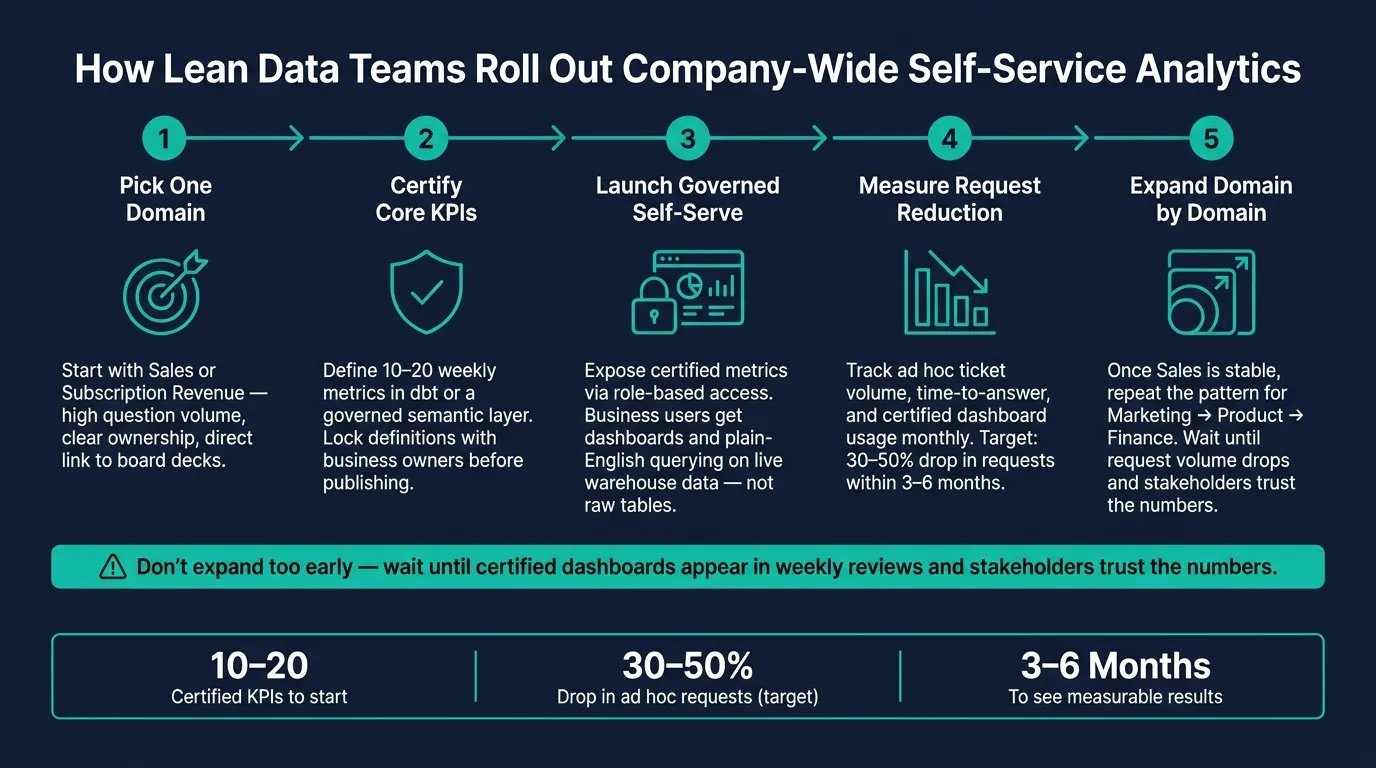 {Lean Data Team Self-Service Analytics Rollout Plan}
:::
{Lean Data Team Self-Service Analytics Rollout Plan}
:::
Analytics for All: Creating a Self-Service Culture in a Scaling Organization with Brevo & Omni
::: @iframe https://www.youtube.com/embed/bGZUwEuNnQA :::
Build the foundation: certified metrics and a governed semantic layer
Start by agreeing on a small set of certified metrics, then make those metrics reusable across every BI and AI workflow.
Start with 10–20 certified metrics your company uses every week
Lean teams should begin with a small certified metric set. It keeps limited modeling and governance work focused on the numbers the business leans on every week. Common picks include ARR, NRR, pipeline by stage, expansion revenue, and active accounts. These numbers show up in board reporting, weekly GTM reviews, and product growth decisions.
A simple way to find this set: talk with finance, sales, and product leaders, then review recurring executive decks and weekly business reviews. The metrics that keep showing up across both are your certified set.
For each metric, document it once with a standard template:
| Field | Example (ARR) |
|---|---|
| Grain | Account-month; point-in-time snapshot |
| Filters | Active subscriptions only; status = "active" or "trialing" |
| Exclusions | Internal test accounts, employee accounts, sandbox environments |
| Joins | Subscription lines → accounts → Salesforce opportunities |
| Owner | Data team owner; Business owner: Head of Finance |
| Refresh cadence | Daily by 6:00 AM PT via dbt on Snowflake |
| Appropriate use cases | Board reporting, revenue forecasting - not cohort or usage analysis |
Use that same template in dbt or your modeling layer. One definition. One named owner. One person to settle disputes when they come up.
That gives every team a shared starting point for self-serve reporting. Once those definitions are locked in, place them in the semantic layer so every team pulls the same number.
Model shared business logic once instead of rebuilding it in every dashboard
The goal isn't just agreement on definitions. It's reuse across every dashboard and workflow.
A semantic layer sits between your warehouse tables and every tool that reads them - dashboards, notebooks, AI queries, and reports. Lean teams often put this logic in dbt or a governed modeling layer so every dashboard, notebook, and AI query uses the same definitions.
That helps non-technical teams answer routine questions without waiting on SQL help. When the definition is governed in one place, business users stop reopening the same reporting argument in every tool. Finance, RevOps, and product stay aligned even when they ask the same question in different places.
Raw warehouse access vs. governed semantic-layer access: a comparison
This is why governed access matters more than raw access for a lean team. For small data teams, the issue isn't convenience. It's whether self-service stays under control at all.
| Aspect | Raw Warehouse Access | Governed Semantic-Layer Access |
|---|---|---|
| Speed to answer | Fast for SQL-fluent analysts; slow for most business users who must understand schemas | Faster for everyone; common questions answered via pre-modeled entities or natural language |
| Metric consistency | High risk of conflicting definitions as each analyst codes metrics differently | High consistency; metrics defined once and reused across all tools and teams |
| Security | Difficult to enforce fine-grained controls; users may access sensitive tables directly | Centralized role-based and row-level security applied across every consuming tool |
| Maintenance burden | High; data team must debug joins, filters, and logic in user-written SQL | Lower; changes to models propagate automatically to dashboards and AI tools |
| Suitability for non-technical users | Poor; requires SQL expertise and schema knowledge | Strong; business users can self-serve through BI interfaces, notebooks, or AI Q&A without writing SQL |
Maintenance is the real price of raw access. Every source-table change can trigger a new round of "why is this number wrong?" tickets. A governed semantic layer takes that hit once, instead of forcing every team to deal with it on their own.
With the foundation in place, the next step is to keep business users inside those definitions while limiting risky access.
Set guardrails so business users can self-serve safely
After you define certified metrics, the next step is making sure self-service stays inside those definitions. The goal is simple: let teams move on their own without spinning up duplicate versions of ARR, churn, or pipeline.
Separate certified datasets from exploratory datasets
One of the easiest ways to stop metric drift is to use a two-tier model. Keep one layer for certified datasets that power official reporting, and a separate exploratory layer where analysts can test ideas without touching company KPIs.
In practice, this can be as simple as clear warehouse schema names like analytics_certified and analytics_exploratory, then matching that setup inside your BI tool with the same folder structure. A business user should be able to look at a dataset and know, right away, whether it is approved for reporting or still in testing.
It also helps to map each team's common questions to the certified dataset that answers them. If a request involves a new metric definition, messy contract logic, or accounting judgment, send it to the data team for review instead of letting it spread informally.
A short self-service menu can do a lot of work here. List each team's top questions, the approved model, and the owner. That alone can cut down Slack questions fast.
Once people know which dataset to use, the next step is deciding who gets access to what.
Apply role-based access, row and column security, and publishing rules
Governance needs to live in the query layer, not only in policy docs. Tie access roles to your identity provider - Okta, Azure AD, or Google Workspace - so permissions move with employees when they join, switch teams, or leave.
Use three access layers:
- Global roles
- Department roles
- Sensitivity roles
Row-level security handles territory and account limits. A centralized user_entitlements table, with each user's email, department, and allowed entities, gives you one place to update territories or org changes instead of editing every dashboard by hand. Column masking protects sensitive fields like individual email addresses or pricing details. General users see redacted values, while approved roles see the full data.
For publishing, keep personal and team spaces uncertified. Require analytics-owner review for department-certified content, and data-lead approval for company-wide dashboards.
Make lineage, ownership, and documentation visible
Access controls alone won't do the job. People also need to understand what a dashboard means and where the numbers come from. Self-service only works when users trust what they're seeing.
Every certified model and dashboard should show:
- A named owner
- A plain-English description of what it measures and what it excludes
- Upstream lineage to the source tables feeding it
- A freshness timestamp like "Last updated: 08/06/2026 03:00 PM PT."
Put this information directly inside the dashboard, such as in an "About this dashboard" tab. That saves people from dropping into Slack to ask, "Is this the right number?"
Don't mark a model as certified until the owner, description, grain, and limitations are filled in. Quarterly reviews help the team remove stale assets without adding more meetings. With visible metadata, short templates, and a simple promotion process, governance stays practical for a lean team.
Cut ad hoc requests with AI-driven workflows and a lean operating model
Once your metrics and guardrails are set, the next move is simple: cut repeat work.
This is where lean teams often get stuck. The same questions keep coming back, just packaged as new tickets each week. Over time, that drags analysts into a loop of answering yesterday’s question again and again.
The fix is to turn recurring questions into reusable models and governed AI workflows before they become permanent ticket traffic.
Turn repeated questions into reusable SQL models, notebooks, and dashboards
Start with the last 90 days of requests. Group them by theme, then flag any question that shows up three or more times in 30 days.
From there, sort the work by type:
- Recurring metrics become dbt models
- Multi-step analyses become parameterized notebooks
- One-off requests stay manual, but still get logged
That setup pays off fast. Update the model once, and the change flows through every dashboard and AI answer that depends on it.
Use AI to answer plain-English questions on top of governed context
The same reusable logic behind your dashboards is what makes AI answers dependable.
Here’s the key point: AI should query governed context, not raw tables. If it pulls straight from messy source data, you get messy answers.
AI agents connected live to Snowflake, BigQuery, Redshift, or Postgres can generate inspectable SQL and Python from approved metric definitions, joins, and permissions. That gives business users fast answers without turning the data layer into a black box. Analysts still have full visibility into the logic.
Measure whether self-service is working
After you automate repeat questions, check whether request volume actually drops. That’s the test. If self-service is doing its job, ticket load should fall and answer speed should improve.
| Metric | Meaning | Example target |
|---|---|---|
| Ad hoc requests per month | Support load | Drop from 60 → 25 by Q3 2026 |
| Median time to answer recurring questions | Self-service speed | 3 business days → same day |
| Duplicate dashboard count | Reuse of certified assets | Decrease quarter-over-quarter |
| % of queries hitting certified models | Adoption of governed sources | Grow from 40% → 80% |
| Analyst time on strategic vs. ad hoc work | Analyst capacity freed | Shift from 70% ad hoc → 40% ad hoc within 6 months |
Set clear numeric goals in your planning docs. For example: "Reduce ad hoc requests from 60 per month to 30 per month by 12/31/2026." Review them monthly.
The main thing to watch is simple: are users serving themselves more, or are requests just moving to another channel?
Conclusion: a step-by-step rollout plan for company-wide self-service
Start with one domain, prove self-service works, then expand.
Here’s the rollout path that takes you from one trusted domain to company-wide coverage:
- Pick one domain - Sales or Subscription Revenue is often the best place to start. These areas usually have lots of questions, clear ownership, and a direct link to board decks and weekly reviews.
- Certify core KPIs - Define 10–20 metrics people use every week in dbt or a governed semantic layer. Then lock those definitions with business owners before you publish them.
- Launch governed self-serve - Expose certified metrics through role-based access. Business users should get dashboards and natural language querying built on approved definitions against live warehouse data, not raw tables.
- Measure request reduction - Track ad hoc ticket volume, time-to-answer, and certified dashboard usage each month. A 30–50% drop in requests in the first 3–6 months is a realistic target.
- Expand domain by domain - Once Sales is stable, use the same pattern for Marketing, then Product, then Finance. At that point, you’ve got a repeatable template for every new domain.
Don’t expand too early. Wait until request volume drops, certified dashboards show up in weekly reviews, and stakeholders trust the numbers.
That’s how lean teams scale self-service: certify a small set of metrics, govern access once, and reuse the same pattern across each domain.
FAQs
::: faq
How do I choose the first 10–20 KPIs to certify?
Start with a workshop that brings together finance, marketing, sales, and product. The goal is simple: find the metrics that spark the most debate or get calculated in different ways across teams.
Focus first on the KPIs people use to run the business day to day and make executive calls, like MRR, churn, and feature adoption. From there, document each metric’s definition, calculation logic, and edge cases. Then map those rules into a centralized, governed semantic layer so everyone works from one source of truth. :::
::: faq
Who should own metric definitions and access rules?
People in Finance, Marketing, or Product should own metric definitions. They know what those numbers mean in day-to-day work. The data team’s job is different: they should own the infrastructure and the semantic layer that turns those definitions into something people can use.
Access rules should sit with the data team. That usually means using RBAC, row-level security, and column masking. Done well, this keeps data secure, limits access by role, and helps stop the data team from turning into a bottleneck. :::
::: faq
What should I do if teams still don’t trust the numbers?
Prioritize transparency and reliability. Use an inspectable, AI-native platform like Querio that shows the underlying SQL or Python for every answer, so people can check the logic instead of taking a black box at face value.
It also helps to strengthen your governed semantic layer by centralizing metric definitions, joins, and business logic. Then add data observability and Certified labels on validated datasets so teams know which data they can trust. :::