Business Intelligence
How to Add Conversational Analytics to Your Databricks Lakehouse
Chat-based analytics only works when data models, metrics, and access controls are governed — a practical Databricks blueprint.

You can add chat-based analytics to Databricks with three parts: governed data in Unity Catalog, a Databricks SQL warehouse, and an AI layer that turns plain English into SQL over approved tables and views.
I’d keep the setup simple. Start with one domain, one metric layer, and one review process. That means:
- Use curated gold tables or views, not raw tables
- Define shared metrics for MRR, ARR, NRR, logo churn, and pipeline coverage
- Add business labels and synonyms so users can ask questions naturally
- Point the AI to a read-only SQL warehouse
- Review every generated SQL query before broad access
- Roll out in phases, starting with revenue or finance
If I were doing this for a 100–500 employee U.S. B2B SaaS team, I’d treat the goal as simple: a sales, finance, or product leader asks a question and gets a number like $1,250,000.00 that matches the dashboard, with SQL they can inspect.
A short way to think about it:
| Layer | What it does | What to watch |
|---|---|---|
| Unity Catalog | Limits what data the AI can see | Permissions, row filters, column masks |
| Databricks SQL | Runs SQL on live data | Point it at curated views |
| Metric layer | Keeps KPI logic the same | Date logic, USD fields, fixed definitions |
| Conversational layer | Turns questions into SQL | SQL review, prompts, example queries |
The main point is this: chat over data works only when the data model, metric rules, and access controls are locked down first. After that, the rollout is mostly about testing, review, and keeping each domain narrow at the start.
::: @figure 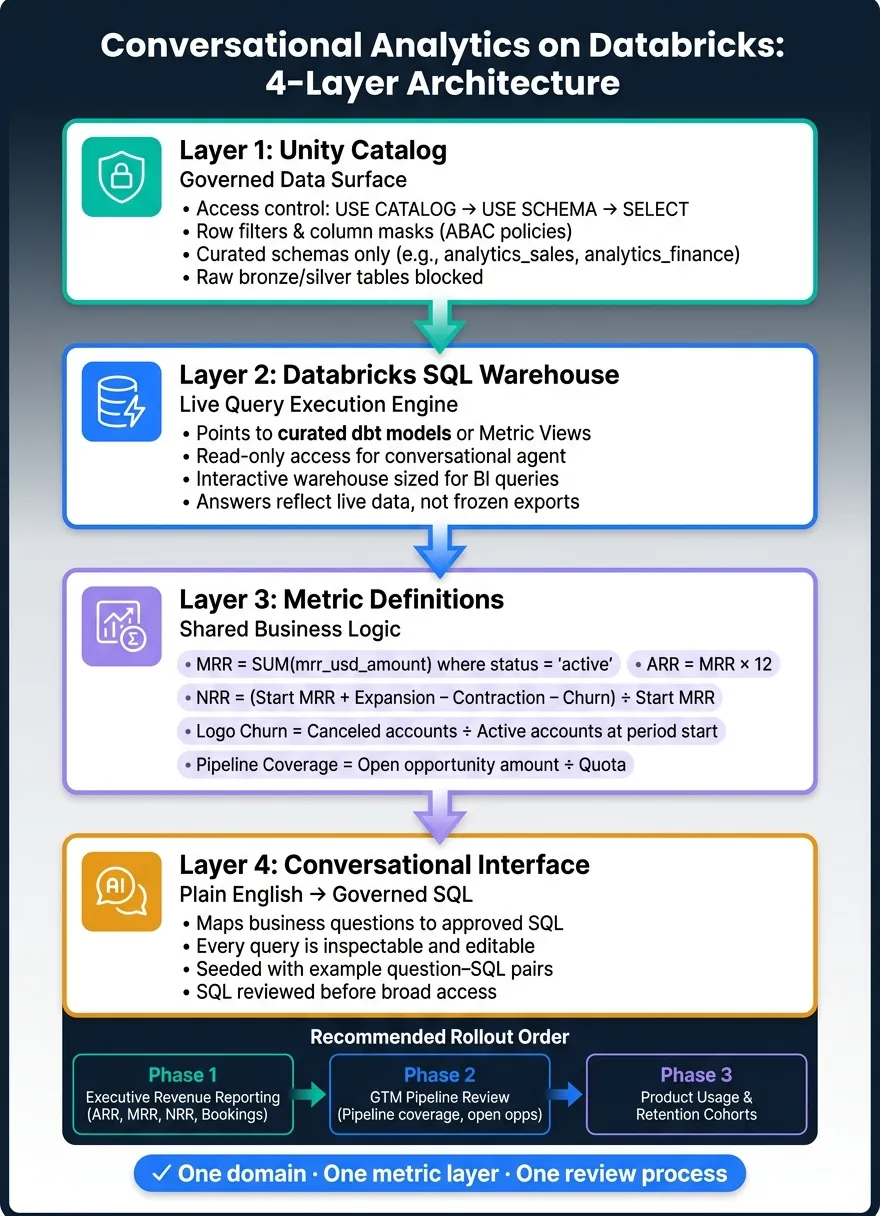 {How to Add Conversational Analytics to Databricks: 4-Layer Architecture}
:::
{How to Add Conversational Analytics to Databricks: 4-Layer Architecture}
:::
How We Turned 200+ Business Users Into Analysts With AI/BI Genie
::: @iframe https://www.youtube.com/embed/wCzoHFMv2uo :::
sbb-itb-284a532
1. The minimum architecture for conversational analytics on Databricks
Conversational analytics on Databricks comes down to three parts: governed data in Unity Catalog, a Databricks SQL warehouse, and a conversational interface that queries live tables.
Take one away and things fall apart fast. You end up with ungoverned data, stale extracts, or answers no one can verify. Put the three together, and you have a setup people can use for production questions around revenue, churn, and pipeline.
Start with Unity Catalog. That’s where access rules decide what the conversational layer is allowed to see.
Governed data in Unity Catalog
Unity Catalog is the approved data layer for the conversational interface. It organizes data into catalogs, schemas, tables, and views, and it enforces access at each level. Grant the service identity USE CATALOG on the target catalog, USE SCHEMA on the target schema, and SELECT on the approved tables or views.[1][2]
For customer and financial data, row filters and column masks add another layer of protection through tag-based ABAC policies. The chat interface should expose the same governed data a user would see through direct SQL - and nothing beyond that.
A simple setup works well here: create separate schemas such as analytics_sales or analytics_finance that hold only curated, analysis-ready objects. Then grant the conversational agent access only to those schemas. Raw bronze and silver tables stay out of reach.
Databricks SQL warehouses and curated analytical views
The SQL warehouse is the execution engine. Since queries run on the live warehouse, answers reflect current data instead of a frozen export.
But the target matters just as much as the engine. If the conversational layer points at raw tables, wrong answers can creep in because of mismatched grain, messy joins, or broken time logic. A curated view built in dbt or in Databricks SQL gives the AI a steadier target. It already contains the right joins and business time logic, and it can power the dashboards your team already uses.
Databricks metric views push this a step further by modeling measures, dimensions, and relationships so every user gets the same number for the same KPI.[3][4] If your team hasn’t rolled out metric views, a shared semantic layer can do the same job.
The next step is to define that metric layer well, so the same question returns the same number every time.
A conversational interface connected to live data
The conversational layer sits on top of Unity Catalog and the SQL warehouse. A business user asks a question, the interface maps that question to SQL over the approved datasets, runs it through the warehouse, and returns a governed answer.
That answer can’t just sound right. The query needs to be inspectable, so analysts can review and edit the SQL behind it. That’s what keeps revenue, churn, and pipeline answers consistent.
Querio connects directly to Databricks SQL warehouses and uses a shared context layer where analysts define joins, metrics, and business terms once. Business users get governed answers, while analysts can open and edit the SQL behind every result.
| Component | Role | Databricks implementation |
|---|---|---|
| Unity Catalog | Defines the approved data surface and enforces permissions | Catalogs, schemas, tables/views, row filters, column masks |
| Databricks SQL Warehouse | Executes generated SQL against live data; targets curated dbt models or Databricks metric views | Interactive warehouse sized for BI queries |
| Conversational interface | Translates natural language to SQL over approved datasets with inspectable, editable output | Querio with a governed context layer |
With the architecture in place, the next job is to define trusted metrics and business synonyms before users start asking questions.
2. Define trusted data and metrics before users start asking questions
Set the metric layer before anyone starts chatting with the data. If metric definitions drift, the conversational layer can sound sure of itself and still give the wrong answer.
Define shared metrics for revenue, churn, and pipeline
Use one definition per metric across dashboards, SQL, and chat. That way, revenue, churn, and pipeline answers all come from the same logic, not from separate setups that slowly drift apart.
For a U.S.-based B2B SaaS company, lock down these core metrics before turning on conversational access: MRR, ARR, logo churn, NRR, and pipeline coverage.[7][8]
- MRR:
SUM(mrr_usd_amount)frombilling_subscriptionswheresubscription_status = 'active', using either a month-end or month-start snapshot. Pick one and document it. - ARR:
MRR × 12, unless the contract system is the documented source of truth. - Logo churn: Distinct
account_idvalues that moved from active to canceled in a period, divided by accounts active at the start. Define the denominator and exclusions: trial, test, and internal accounts. - NRR:
(Starting MRR + Expansion MRR − Contraction MRR − Churned MRR) ÷ Starting MRR. Spell out what counts as expansion vs. contraction, the time window (monthly or quarterly), and whether foreign-currency contracts are converted to USD with a fixed FX rate table or excluded. - Pipeline coverage: Open opportunity amount divided by quota for the same team and period.
Model each metric as a versioned Databricks Metric View with a named owner, so one change flows to every consumer.[5][6]
These definitions act as the contract the conversational layer uses to answer questions the same way every time.
Add business-friendly names, descriptions, and synonyms
Technical names rarely match the way people ask questions. The conversational layer needs a bridge between business language and the data model to provide context.
Add this metadata in Unity Catalog table and column comments, or store it in a business_glossary table or similar metadata source.
| Technical name | Business label | Synonyms | Notes |
|---|---|---|---|
dim_account |
Customers | accounts, logos, companies | Exclude is_test_account = true and internal_flag = true by default |
closed_won_amount_usd |
Bookings amount (USD) | bookings, closed-won revenue, new ARR | Values in U.S. dollars ($); e.g., $1,250,000 |
fct_opportunity.pipeline_amount_usd |
Pipeline value | pipeline, open opportunity amount, pipeline dollars | Exclude stage = 'Closed Lost' when users say current pipeline |
account_churned_flag |
Logo churned | lost customer, canceled customer, churned logo | 0/1 flag per account per period |
Document date intent too: close_date drives bookings, while invoice_date drives revenue. Store dates as YYYY-MM-DD, then show them to users as MM/DD/YYYY or MMM YYYY.[9]
For quarter-to-date questions like What is our QTD MRR by month?, define QTD directly in your dim_date table: filter from quarter_start_date to the latest successful data load date, then group by month_start_date. Don’t leave that call to the LLM.[9]
This mapping is what helps users ask questions in plain business language and still land on the right fields, joins, and filters.
With names and synonyms lined up, the next move is to review the generated SQL against those definitions.
A readiness checklist for analysts
Before you open conversational access to any domain, run this checklist.
- Table ownership confirmed - every metric view and curated table has a named owner in Unity Catalog.
- Approved joins documented - relationships are pre-defined in the semantic or context layer.
- Canonical date dimension in place -
dim_dateincludesquarter_start_date,month_start_date,month_end_date,is_quarter_end, and calendar vs. fiscal quarter mapping. - Standard filters encoded in views -
is_test_account = false,internal_flag = false,currency = 'USD', and any plan-type exclusions. - Standard dimensions available -
region,segment, andplanare present as columns in metric views. - Benchmark outputs documented - write down the expected answer for 3–5 common questions, such as July 2026 MRR = $125,000 or Q2 2026 logo churn = 12.4%, so generated SQL can be checked right away.[10][11]
Once these checks pass, the conversational layer can be connected and tested against real questions.
3. Connect the conversational layer and validate generated SQL
Configure domain context and example questions
With the metric layer in place, the next step is simple: give the agent the exact business language and date rules it must use.
Point it to a read-only Databricks SQL warehouse that can query ONLY curated schemas like analytics.sales, analytics.marketing, or finance.reporting. Then spell out exactly which tables and views it can access.
Be direct when you map business terms to physical objects. For example:
- revenue →
analytics.sales_facts_monthly.total_revenue_usd - customer →
analytics.dim_customer
You also need a guardrail prompt with three clear rules.
- All monetary values must come from
*_usdfields and be shown in U.S. dollars ($) - Date phrases must be defined exactly:
- "last 12 months" = the 12 most recent full calendar months
- "last year" = January 1–December 31
- If your fiscal year does not match the calendar year, map terms like FY 2026 Q1 to exact date ranges in the prompt
Then seed the agent with a few question–SQL pairs that match your canonical metrics and date logic. This matters more than people think. If you want the agent to answer cleanly, show it what “clean” looks like.
A revenue example: Show monthly expansion revenue for 2026 in USD should produce a query that uses date_trunc('month', invoice_date), filters invoice_date >= '2026-01-01' AND invoice_date < '2027-01-01', and sums only expansion_revenue_usd.
A churn example: Compare enterprise churn vs. SMB churn over the last 12 full months should use a rolling window with date_trunc('month', add_months(current_date(), -12)) and filter segment IN ('SMB', 'Enterprise') from analytics.customer_churn_metrics.
Store these examples in the agent config or in a versioned notebook. That way, the logic doesn’t drift the minute someone tweaks a prompt.
Review SQL for joins, filters, and time logic
Once the context layer is set, check each generated query against the warehouse model using the canonical metric definitions and business glossary from Section 2.
Review every generated query before business users see it.
| Review area | What to check |
|---|---|
| Fact table | Revenue questions use sales_facts_monthly, not raw invoice tables; churn questions use customer_churn_metrics, not ad hoc snapshots |
| Joins | Keys are correct (f.customer_id = d.customer_id); no many-to-many relationships that inflate counts; only governed dimensions like dim_customer and dim_product |
| Filters | Segment values match canonical labels (SMB, Mid-market, Enterprise); status flags are correct (is_active = TRUE, stage NOT IN ('Closed Lost')) |
| Time logic | Date ranges align to U.S. calendar months or fiscal quarters; date_trunc is used consistently; year-over-year comparisons reference non-overlapping periods |
| Currency | All monetary columns end in _usd; no mixing of contract_value_usd and billing_amount_usd unless the metric definition allows it |
This review step is where a lot of bad SQL gets caught. A query can look fine at a glance and still be off because it joined the wrong table, used a fuzzy segment label, or compared overlapping time periods.
Compare each result with a trusted Databricks SQL dashboard, dbt model, or notebook output, and block approval when the difference is material [12][13].
Turn answers into reusable assets
After a query passes review, don’t leave it buried in chat.
Promote it. Save approved SQL as a named query, dashboard tile, or versioned notebook so the next user gets the same logic. That turns a one-off chat answer into a repeatable analytics asset.
Querio makes this easier because every answer includes inspectable, editable SQL or Python. Analysts can copy the validated query into a reactive notebook, change parameters, and schedule it as a recurring report without extra cleanup.
4. Stack components side by side and plan your rollout
Once your SQL checks out, assign each layer to a clear owner. That makes rollout simpler and cuts down the usual back-and-forth when something breaks.
| Component | Primary Role | Governance Function | Example Inputs | Example Outputs | Owner |
|---|---|---|---|---|---|
| Unity Catalog | Governed data surface | Access control, lineage, audit logging, and certification of governed data | Registered tables, role grants, PII tags | Certified "gold" tables, audit logs | Data platform / data engineering team |
| Databricks SQL | Live query execution | Role-based access at query time and query history for compliance | Analyst-authored SQL views like finance.v_revenue_mrr_usd, scheduled queries for executive dashboards |
Result sets, saved queries, performance-optimized materialized views | Analytics engineering / BI team |
| Metric definitions | Shared business logic for KPI definitions | Standardizes metrics so ARR, churn rate, pipeline coverage, and retention always use the same formulas and filters | Metric configs or SQL metric views, time grain settings, USD currency rules, active-customer filters | Reusable logical entities exposed as SQL views or semantic models | Analytics lead or data product owner with finance, RevOps, or sales operations |
| Conversational interface | Plain-English to SQL | Translates natural language into SQL using an AI semantic layer, respects Unity Catalog permissions, and exposes generated SQL | Questions such as Show net new ARR by region in Q2 2026 | Tables, charts, natural language explanations, links to dashboards, saved Q&A artifacts | Data team plus a domain owner |
That owner column does real work. If a metric is off, send it to the metric layer. If someone can’t get access, that’s a Unity Catalog issue. If a query drags, look at Databricks SQL.
With ownership in place, start the first domain as a closed pilot.
Roll out by domain, not all at once
Use the same governance setup and metric rules, but roll out one business domain at a time.
Start with executive revenue reporting. This is usually the cleanest place to begin. If ARR, MRR, NRR, and bookings already have one agreed definition, finance and RevOps own those definitions, and the source data is certified and refreshed often enough for live questions, then a conversational interface that can answer Show net new ARR by segment for the last 12 months tends to earn trust fast.
After that domain is steady - definitions locked, answers right again and again, and pilot users relying on the output - move to GTM pipeline review. Sales and marketing teams ask ad hoc questions all the time during pipeline calls and QBRs, so the pull is strong there. Next comes product usage and retention cohorts. That area usually needs more tuning because metric definitions are often less settled.
For a small data team, the discipline is pretty simple: treat each domain like its own data product.
- Certify the tables in Unity Catalog
- Define the metrics
- Set up the AI layer with domain context and example questions
- Run a closed pilot
- Expand access only after the feedback loop is clean
Trying to launch every domain at the same time is where trust starts to slip.
Conclusion: A blueprint for governed self-serve on Databricks
When these four layers work together and you roll them out one domain at a time, business users can get governed self-service BI answers from live Databricks data without losing metric consistency. For growing U.S.-based SaaS teams, that means faster answers for board decks, QBRs, and retention reviews - without exporting CSVs, waiting in the analyst queue, or wondering whether the number in chat matches the number in the dashboard.
FAQs
::: faq
How long does a first Databricks chat analytics pilot usually take?
A first Databricks conversational analytics pilot usually takes about one week.
The technical connection itself can be done in a few hours. But most of that week tends to go toward defining core metrics like revenue and churn, and setting up table joins so results stay consistent, governed, and reliable for self-service analysis. :::
::: faq
What data should we exclude from the conversational layer first?
Start by removing unused tables, extra columns, and sensitive information like confidential financial data or individual salaries.
When old, duplicate, or orphaned tables stick around, they add noise and make data harder to trust. They can also trip people up. Clean those out first.
Then set up row-level and column-level access controls so only approved team members can see sensitive data. :::
::: faq
Who should approve generated SQL before rollout?
Generated SQL should be approved by the owners of the governed semantic layer. In most companies, that means data analytics leadership or the team that defines metrics. For high-impact KPIs, BI, Finance, or Product stakeholders usually need to weigh in too.
That step helps keep query logic out in the open. It also makes sure AI-mapped business terms, metric definitions, and permission rules match the established context layer before a broader rollout. And because the SQL is inspectable and logged, teams have a clear audit trail to review later. :::