Business Intelligence
How AI Transforms Customer-Facing Dashboards
AI dashboards let users ask plain-English questions, get live visualizations, detect anomalies, and forecast trends with consistent, governed metrics.
AI is reshaping customer-facing dashboards by making data access faster, easier, and more intuitive. Tools like Querio let users ask questions in plain English and get instant, visualized answers - no technical skills required. Here's what makes AI-driven dashboards stand out:
Natural Language Queries: Ask questions like "What were our top products last month?" and get instant, accurate data.
Real-Time Insights: Direct connections to live data warehouses ensure up-to-date metrics.
Anomaly Detection: AI spots unusual patterns (e.g., revenue drops) and explains why they happened.
Predictive Analytics: Dashboards now forecast trends, helping users make forward-looking decisions.
Semantic Layer: Consistent metric definitions ensure everyone works with the same data logic.
Embedded Analytics: Dashboards integrate seamlessly into apps, offering a personalized experience.
Querio simplifies setup with secure connections, reusable metric definitions, and easy dashboard embedding. Businesses using AI-powered dashboards report faster decision-making (up to 30% improvement) and fewer support tickets (up to 40% reduction). These tools are transforming how users interact with data, making it easier to act quickly and confidently.
Build an AI Chatbot for Dashboards and Reports in Sigma
How Querio Personalizes Dashboard Experiences
Turning standard dashboards into the future of data tools is no small feat, but Querio makes it happen with three standout features: natural language queries, a semantic context layer, and embedded analytics. These elements work together to deliver data that's not only relevant but also presented in a way that aligns perfectly with each user's role.
Natural Language Queries for Effortless Data Access
With Querio, you don’t need to be a SQL wizard or navigate through complex menus to get the answers you need. Instead, users can simply type in questions like, "What were our top-performing products last month?" Querio’s AI handles the heavy lifting, converting the query into precise SQL or Python code behind the scenes. This code runs directly on your live data warehouse - whether that’s Snowflake, BigQuery, or Postgres - and instantly delivers visualized results.
What’s more, the AI-generated code is fully inspectable, giving data teams the oversight they need. This approach saves time and boosts productivity. In fact, 75% of businesses using AI dashboards have reported a 30% improvement in decision-making efficiency [1]. By cutting down the time spent on report requests, teams can focus on taking action based on insights.
Semantic Context Layer for Reliable Metrics
Organizations often face a common challenge: differing definitions for key metrics like "active user" or "monthly revenue." These inconsistencies can lead to conflicting data across dashboards, eroding trust in the numbers. Querio tackles this issue with its semantic context layer, which allows data teams to define joins, metrics, and business terms once and apply them universally.
For example, when someone asks for "revenue", Querio ensures the response is based on the approved calculation, complete with the right filters and logic. This unified approach not only builds trust but also reduces inefficiencies. Companies that streamline their AI operations this way have been able to cut data-related costs by up to 20% [2], thanks to eliminating duplicate efforts and maintaining a single, consistent layer of business logic.
Embedded Analytics for Seamless Integration
Querio takes personalization a step further by embedding AI-powered analytics directly into customer-facing applications. This means you can leverage the same trusted logic and AI capabilities used in internal dashboards without needing to build a separate analytics infrastructure. The system even tracks user KPIs and adjusts the interface automatically [3][4].
This adaptability translates to big time savings. AI-powered dashboards can reduce manual reporting work from 15–25 hours down to just 1–3 hours [3]. And with 50% of professionals accessing dashboards on mobile devices [1], Querio ensures that embedded components are fully responsive, delivering a smooth experience tailored to each user’s role - without requiring custom development for every group of stakeholders.
Automated Data Visualizations with Querio
Traditionally, creating charts and graphs has been a time-consuming process. It often required waiting on analysts, writing complex SQL queries, or navigating drag-and-drop tools that demanded technical know-how. Querio changes the game by generating visualizations instantly from plain English queries. This AI-powered tool doesn’t just extract data - it chooses the most suitable chart type, applies precise formatting, and delivers polished visuals in seconds.
Real-Time Visualization Generation
Querio uses AI to produce visualizations on the fly. For example, if you ask, "Show me customer retention rates by region for Q4 2025", Querio translates your question into executable code that runs directly on your live data warehouse. It then picks the best chart type automatically, skipping the need for manual setup.
The time savings are enormous. While traditional dashboards might take weeks of analyst work to create and deploy, Querio delivers results almost instantly. This speed allows customer-facing teams to answer questions during client meetings without delay. Plus, the visualizations update dynamically as new data flows into your warehouse, ensuring the information is always current - no need for manual report refreshes.
Governed and Inspectable Outputs
Speed alone isn’t enough; accuracy and transparency are just as critical. Querio ensures data integrity by making the underlying code for every visualization fully accessible. Data teams can review and refine the SQL or Python code behind each chart, making it easy to validate and maintain governance standards.
This transparency is especially important for customer-facing dashboards, where errors can harm trust and credibility. Querio’s semantic context layer ensures consistency in metric definitions - so terms like "monthly recurring revenue" mean the same thing across all charts and tables. Data teams can audit queries, adjust business logic centrally, and have those changes automatically applied to all visualizations without the need to rebuild dashboards. This level of control ensures reliability and consistency across the board.
Real-Time Insights and Anomaly Detection with Querio
In the world of data monitoring, having access to real-time information is non-negotiable. Outdated metrics can make customer-facing dashboards lose their purpose entirely. When users log in, they expect to see what's happening right now, not yesterday or last week. Querio solves this problem by connecting directly to a modern data layer for your live data warehouse. This approach eliminates delays and duplication, ensuring the data remains accurate and up to date.
Live Data Warehouse Connections
Querio creates read-only, encrypted connections to platforms like Snowflake, BigQuery, and Postgres. This means there’s no need to move data into separate systems or rely on sluggish overnight batch processes. When a customer needs insights, Querio queries the warehouse directly and delivers results in seconds. This setup ensures a single source of truth for all your metrics.
The read-only access also protects your production environment. By granting SELECT-only permissions through a service account, you maintain strict data governance while enabling real-time querying. Plus, since no data copies are stored outside the warehouse, security risks are reduced significantly - there are fewer potential attack points. This real-time architecture is the backbone of Querio’s advanced monitoring capabilities, like its dynamic anomaly detection.
AI-Driven Anomaly Detection
While static dashboards give you a view of what’s already happened, Querio’s AI takes it a step further by identifying anomalies as they occur. Whether it’s a sudden drop in revenue, unexpected inventory shortages, or a spike in usage, Querio’s AI continuously scans your data for irregularities. Unlike traditional systems that rely on fixed thresholds prone to false alarms, Querio uses dynamic, self-learning models that adapt to your data’s natural patterns.
When an anomaly is detected, Querio doesn’t just stop at raising the flag. It performs automated root-cause analysis, helping you uncover the "why" behind the anomaly. For example, if customer churn in a specific region suddenly jumps by 15%, allowing you to analyze churn drivers without writing SQL, Querio might highlight related metrics - like a recent price adjustment or service outage - that could explain the shift. This transforms your dashboards from passive tools into active monitoring systems, alerting you to critical issues as they emerge, not days later when the damage has already been done.
Feature | Traditional BI Anomaly Detection | Querio AI-Driven Detection |
|---|---|---|
Thresholds | Static/Fixed | Dynamic/Self-learning |
Detection Speed | Weeks | Minutes |
Alert Accuracy | High false positives | Minimized false alerts |
Root-Cause | Manual investigation | Automated analysis |
Data Access | Batch/Outdated | Live/Real-time |
Predictive Analytics in Querio Dashboards
Real-time insights are great for keeping dashboards up-to-date, but predictive analytics take things a step further by helping users anticipate what’s coming next. Querio turns dashboards into forward-thinking decision-making tools by combining a flexible notebook environment with automated forecasting. This setup allows users to uncover trends, model potential scenarios, and gain insights that look ahead instead of just summarizing the past.
Notebook-Based Predictive Modeling
Querio's notebook environment gives data teams the ability to build predictive models directly within the platform using SQL and Python. They can experiment with machine learning models, test hypotheses, and refine forecasts - all without leaving the dashboard ecosystem. Historical data from your warehouse can be pulled in to apply regression models, train classification algorithms, or run time-series forecasts. Once complete, these insights can be packaged into reusable components for dashboards.
This setup creates a seamless connection between data science and customer analytics. For example, a SaaS company could use Python notebooks to predict customer churn based on usage data and embed those predictions into a customer health dashboard. Similarly, an e-commerce platform might forecast inventory needs by region and show restocking recommendations to warehouse managers. Plus, because Querio connects to live data and uses a semantic layer to maintain consistent business logic, these models stay accurate over time - avoiding issues with outdated data or conflicting definitions.
Scheduled Reporting for Forecasting
The real power of predictive models lies in their ability to deliver regular, automated updates. Querio's scheduled reporting feature ensures that fresh data is queried daily, weekly, or monthly. It regenerates forecasts and distributes the results through email or embedded dashboards, keeping everyone informed without extra manual effort.
This automation helps teams stay ahead of the curve. For instance, a logistics company could rely on weekly demand forecasts to optimize routes before capacity issues arise. Similarly, a subscription business might use monthly revenue projections to alert account managers about customers who might be at risk. Research shows that 75% of businesses using AI-powered dashboards reported a 30% boost in decision-making efficiency [1].
Feature | Role in Predictive Analytics | Business Impact |
|---|---|---|
Python Notebooks | Build and refine machine learning models with SQL and Python | Enables more advanced analysis beyond basic queries |
Scheduled Reports | Automates the delivery of forecasts and trend updates | Saves time and ensures teams are always prepared |
Semantic Layer | Standardizes metrics for consistent forecasting | Builds trust by ensuring accuracy in AI-driven insights |
Live Connections | Links to real-time data in Snowflake or BigQuery | Prevents decisions based on outdated or incomplete data |
How to Implement AI-Enhanced Dashboards with Querio
You can get AI-powered dashboards up and running in just a few hours by connecting Querio directly to your data warehouse. The process involves three main steps: setting up secure read-only connections, defining business logic, and embedding dashboards for your customers. Let’s break it down.
Setup with Secure Read-Only Connections
Querio integrates seamlessly with cloud data warehouses like Snowflake, BigQuery, Postgres, and Redshift using read-only service accounts. This setup ensures that your data stays put - no accidental writes or modifications - and reduces the risk of breaches. To get started, generate read-only API credentials in your data warehouse console and enter them into Querio's connection wizard. The platform uses industry-standard key-pair authentication and TLS encryption to achieve enterprise-level security.
You can authenticate through OAuth 2.0 or API keys, and for added control, configure row-level security (RLS) directly in your warehouse so users only see data relevant to them. Querio also keeps an audit log for every query, simplifying compliance with standards like SOC 2, GDPR, and HIPAA. This approach has been shown to reduce data breach risks by 75%.
Defining Metrics and Business Logic
Once your connection is secure, the next step is to define metrics and business logic. Querio’s semantic context layer allows you to create shared definitions for metrics and business terms. Using the metric editor, you can select tables, apply joins and filters, and define reusable metrics. For instance, you could calculate "Monthly Recurring Revenue" as SUM(revenue) filtered by status='active' and grouped by customer_id. These definitions are centrally stored and versioned for consistency.
For more advanced needs, Querio supports predictive modeling. For example, a SaaS company might create a "Churn Risk Score" using Python notebooks in Querio, leveraging data like login frequency and feature usage. Meanwhile, an e-commerce business could define "Conversion Rate" as COUNT(purchases)/COUNT(sessions) with date filters and US-specific currency formatting ($1,234.56). Querio’s AI can even suggest ways to optimize query performance. Teams adopting this method have reduced the time it takes to define new metrics by 5x compared to traditional SQL workflows.
Embedding Dashboards for Customers
Querio makes it easy to embed dashboards into your applications using iframes, JavaScript SDKs, or React/Vue integrations. You’ll generate a secure embed token (valid for 24 hours) with domain whitelisting, then add the provided iframe code to your app. For example:
The dashboard will automatically adjust to fit its container, and you can white-label it to match your brand’s design.
For security, generate embed tokens on a private backend (e.g., AWS Lambda) rather than exposing API keys in the client. Use JSON Web Tokens (JWT) to include user-specific attributes like customer_id, enabling row-level filtering so each customer sees only their data. Querio’s dashboards also support natural language queries, allowing customers to ask questions like "What were my sales last quarter?" without needing SQL knowledge. Businesses using these embedded dashboards have reported 40% faster time-to-insight for their customers and up to 40% fewer support tickets due to self-service capabilities.
Implementation Step | Key Querio Feature | Benefit |
|---|---|---|
Secure Connections | Read-only API keys to Snowflake/BigQuery | Zero data movement, full governance |
Metric Definition | Semantic layer editor | Consistent logic across teams |
Dashboard Embedding | JS SDK + SSO | Personalized customer views |
Benefits and Measuring AI Impact
Pre-AI vs AI-Enhanced Dashboards: Performance Metrics Comparison
Main Benefits of AI-Driven Dashboards
AI-driven dashboards are changing the way users interact with data. Instead of relying on support teams, users can now ask questions using natural language interfaces and get instant answers. This shift from reactive to proactive analytics helps customers spot potential issues before they escalate.
The efficiency boost is hard to ignore. Agencies using AI-powered dashboards have cut manual reporting time by as much as 80% [5]. This allows teams to redirect their focus to more strategic tasks. Personalization also plays a key role, with AI-driven localization and tailored experiences improving conversion rates by 70% to 200% compared to non-AI systems [8]. Together, these improvements highlight the value of AI's predictive capabilities.
What sets AI dashboards apart is their ability to predict future trends and provide actionable recommendations - something traditional dashboards simply can't do. For example, in supply chain management, AI-driven forecasting has reduced lost sales and product shortages by up to 65% [6]. Predictive inventory management has also cut warehousing costs by 5% to 10% and slashed administrative costs by 25% to 40% [6]. On a broader scale, 87% of brands report that AI has positively impacted their annual revenue [7].
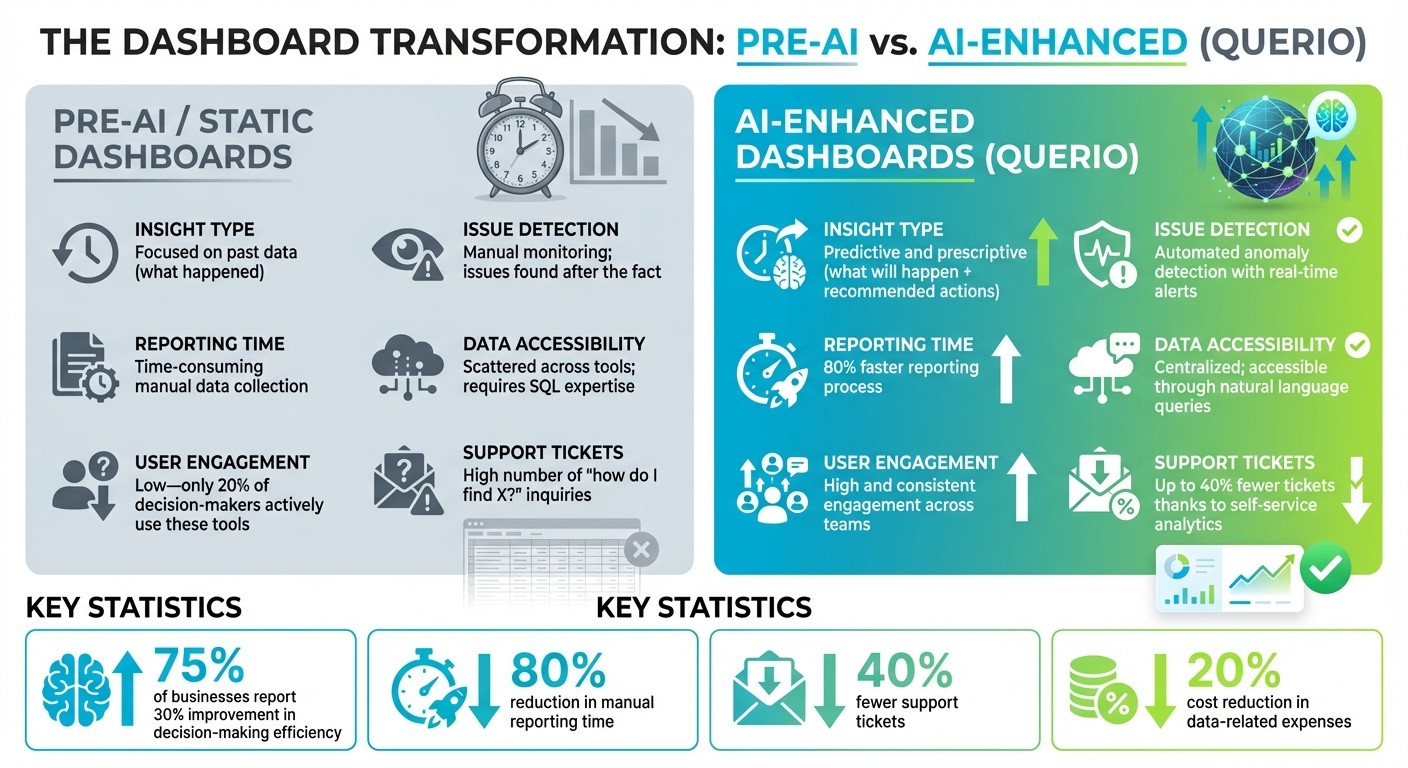
Pre-AI vs. AI-Enhanced Dashboards: Metrics Comparison
To understand the leap AI brings, let’s compare traditional dashboards with AI-enhanced ones. The table below outlines key differences:
Metric | Pre-AI / Static Dashboards | AI-Enhanced Dashboards (Querio) |
|---|---|---|
Insight Type | Focused on past data (what happened) | Predictive and prescriptive (what will happen and recommended actions) |
Issue Detection | Relies on manual monitoring; issues found after the fact | Automated anomaly detection with real-time alerts |
Reporting Time | Time-consuming manual data collection and reporting | 80% faster reporting process [5] |
Data Accessibility | Scattered across tools; requires SQL expertise | Centralized and accessible through natural language queries |
User Engagement | Low - only 20% of decision-makers actively use these tools [9] | High and consistent engagement across teams |
Support Tickets | High number of "how do I find X?" inquiries | Up to 40% fewer tickets thanks to self-service analytics for customers |
These metrics come to life through real-world examples. Zalando, for instance, saw a 40% increase in average basket sizes after rolling out an AI-powered personalization system [7]. Czech retailer Trenýrkárna.cz expanded from 3 to 23 countries in just two years by leveraging AI-powered localization, cutting expansion costs by 85% and reducing translation times from two weeks to a single day [7]. Similarly, Lyst, a fashion platform, saved an average of 48 engineering hours per feature rollout by using AI-driven localization across eight languages [7].
Conclusion
AI has completely reshaped how users interact with data. Gone are the days of waiting for reports or wrestling with clunky interfaces. Now, users can simply ask questions in plain English and receive instant, precise answers. This shift from static dashboards to intelligent, responsive systems has led to quicker decision-making, greater efficiency, and more engaged teams at every level of an organization. It’s not just a step forward in convenience - it’s a leap toward smarter, more integrated solutions like Querio.
Querio takes these advancements to the next level by combining AI-powered data access, real-time anomaly detection, and intuitive visualizations. Its consistent semantic layer ensures that everyone in your organization is working from the same definitions, while live connections to your data warehouse mean your insights are always up-to-date - no outdated copies, no guesswork. This approach eliminates common roadblocks, making data easier to use and more actionable.
Take BSH as an example: they achieved a 106% increase in conversion rates and a 22% improvement in add-to-cart rates through AI-driven personalization [11].
"It's not just about saving time and money, it's about making data accessible." – Enver Melih Sorkun, Co-founder & CTO, Growdash [10]
Stories like these highlight the tangible benefits of AI-powered dashboards.
Whether your goal is faster reporting, stronger customer engagement, or scalable analytics platforms, Querio has you covered. Best of all, implementation is seamless - there’s no need to duplicate data or overhaul your existing infrastructure. With Querio, you can turn static dashboards into dynamic, game-changing insights.
FAQs
How does Querio maintain accurate and consistent data in dashboards?
Querio ensures your dashboards always display the most current information by linking them directly to live data sources. This means every visualization reflects the latest updates without any manual intervention. The platform takes it a step further with its clean-data-first approach, which validates and normalizes incoming data before it even reaches your dashboard. To maintain data integrity, Querio implements rigorous governance measures like role-based access controls, encryption, and adherence to strict compliance standards, including SOC 2 Type II, GDPR, and CCPA. These measures help safeguard data from unauthorized changes and ensure consistent definitions across all views.
On top of that, Querio leverages AI to perform advanced quality checks. These checks include spotting anomalies, predictive validation, and reconciling mismatched data sets, all designed to catch and fix errors automatically. By using these AI-driven tools, Querio significantly improves error detection and ensures high data accuracy, making its dashboards a dependable tool for decision-making across various business functions.
What security features does Querio offer for its AI-powered dashboards?
Querio’s AI-powered dashboards are built with strong security protocols to keep your data protected and access safe. With role-based access controls, users are limited to viewing only the information relevant to their specific responsibilities. Plus, every action is tracked through detailed audit logs, recording who accessed what and when.
To further safeguard your information, data is encrypted both during transmission and when stored. Querio also adheres to SOC 2 Type II standards, ensuring high levels of confidentiality, integrity, and availability. On top of that, secure governance features like robust authentication and strict permission checks protect live data connections, reducing the risk of unauthorized access.
How does predictive analytics in Querio dashboards help my business?
Predictive analytics in Querio dashboards takes historical data and turns it into actionable forecasts, giving your business the ability to anticipate opportunities and challenges before they happen. By analyzing trends and patterns, it delivers precise predictions in key areas like sales, customer behavior, inventory requirements, and staffing needs. This means you can allocate resources wisely, set achievable goals, and plan budgets with greater confidence.
Querio’s built-in what-if scenario tools let you test out strategies - like adjusting prices or increasing marketing spend - and instantly see the potential outcomes. This simplifies decision-making, minimizes the need for manual data crunching, and helps you spot risks or opportunities for growth more quickly. By tapping into Querio’s predictive analytics, businesses often find planning becomes more seamless, decisions happen faster, and efficiency improves - all while driving better results and cutting costs.
Related Blog Posts


