Business Intelligence
How to Give Your Customers Insights Instantly
Connect live data, build a semantic layer, and embed AI-powered dashboards and notebooks to deliver instant, secure customer insights.
Your customers want answers now. Whether it’s analyzing churn risks, forecasting revenue, or analyzing feature adoption, speed matters. Businesses using AI for real-time insights report a 25% boost in customer satisfaction and a 30% drop in complaints.
Here’s the key: tools like Querio connect directly to your data warehouse (Snowflake, BigQuery, or Postgres), turning raw data into live, actionable insights. Customers can ask questions in plain English, access real-time dashboards, and even explore their own data through embedded analytics - all while ensuring compliance and data security.
Key Takeaways:
Real-Time Data: Querio connects live to your data, avoiding delays from outdated snapshots.
AI-Powered Insights: Customers can use plain language to get instant charts and answers.
Secure and Compliant: SOC 2 Type II certified and adheres to GDPR, HIPAA, and CCPA.
Custom Dashboards: Build and share tailored views without needing SQL skills.
Automation: Schedule reports and updates to save time.
Embedded Analytics: Add interactive visualizations and AI copilots to your apps.
With these tools, you can deliver fast, clear insights that keep customers informed and happy.
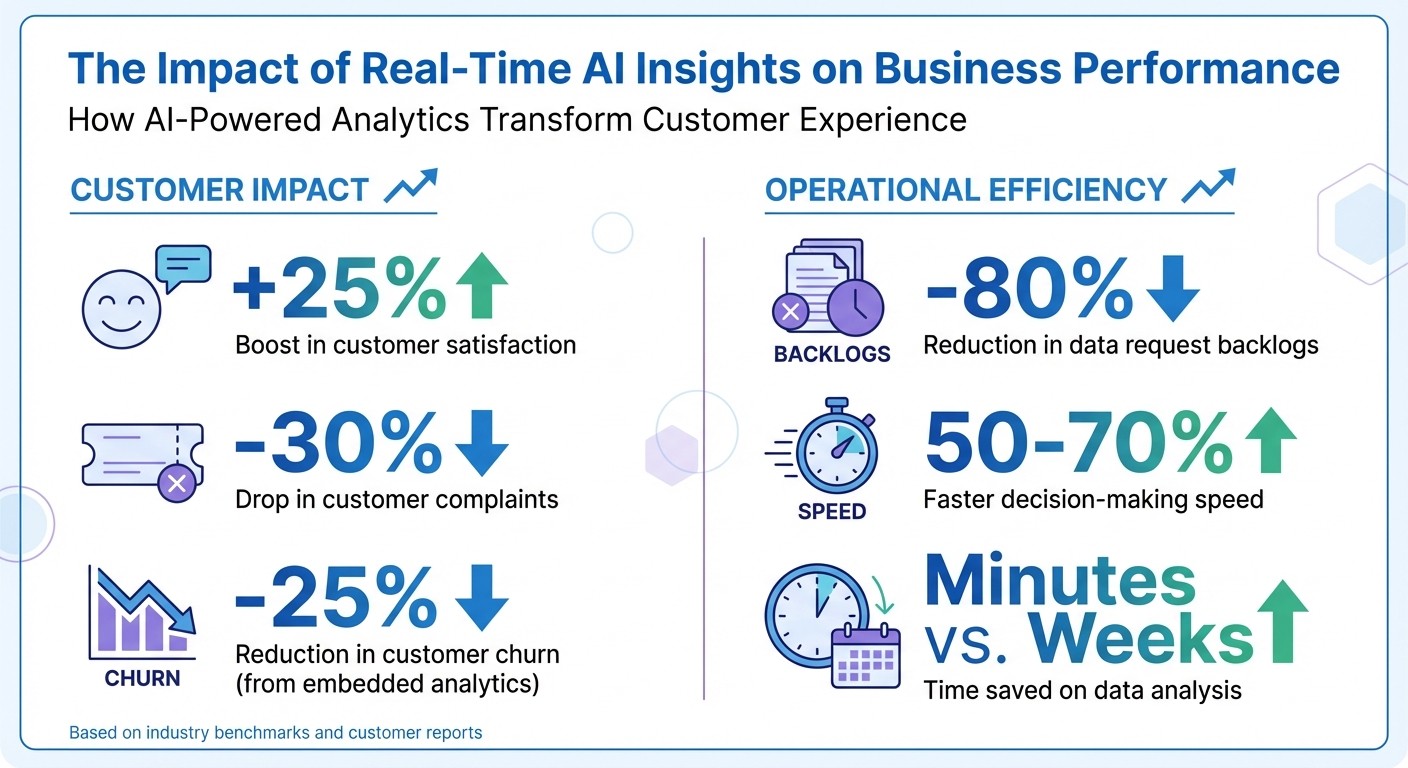
Real-Time AI Insights Impact on Customer Satisfaction and Business Efficiency
How to Use AI For Customer Insights
Connect Securely to Your Data Warehouse
Get instant insights by directly connecting to your data warehouse - whether it’s Snowflake, BigQuery, or Postgres. Querio integrates directly with your existing setup, so there’s no need to copy or duplicate your data. This real-time connection ensures your insights are always up-to-date, unlike traditional ETL snapshots that can lag behind.
By keeping your data under your control, you avoid extra storage costs, eliminate syncing delays, and maintain a single source of truth. When a customer asks a question, they’ll get answers based on live data - not outdated or incomplete snapshots.
Step 1: Set Up Read-Only Data Connections
Start by creating a SELECT-only service account using RSA Key-Pair (2048/4096-bit) authentication. Make sure to whitelist Querio’s production IPs. Once your read-only service account is ready, add the encrypted credentials to Querio, whitelist the necessary IPs, and you’re good to go. It’s that simple.
Step 2: Keep Data Secure and Compliant
Querio is SOC 2 Type II certified, with annual third-party audits confirming its commitment to confidentiality, availability, and privacy. This level of security is especially important for industries like fintech and healthcare. Additionally, Querio complies with GDPR, HIPAA, and CCPA regulations, ensuring your data meets all necessary legal standards.
One key feature: Querio’s AI models never use your customer data for training. Every query respects your existing access controls, applying the same governance rules as for human users. Plus, row-level security ensures strict access enforcement, so your data remains protected.
Next, take your insights further by building a strong semantic layer.
Build a Semantic Layer for Accurate Insights
A semantic layer plays a critical role in your data architecture. It defines how your database tables connect, clarifies the difference between metrics and semantic layers, and ensures consistent terminology across your organization. For instance, instead of juggling multiple interpretations of "active user", you define it once - perhaps as users who logged in during the last 30 days. From then on, everyone relies on the same definition, eliminating confusion.
When you connect your database to Querio, it automatically maps relationships between tables. Your data team can then fine-tune these mappings through an easy-to-use interface. This ensures that when someone asks, "What’s our customer acquisition cost by channel?" they’ll get accurate results based on properly joined data, like sales and customer tables. This centralized system eliminates conflicting reports between departments.
Querio users have reported an 80% drop in data request backlogs. Why? Business users can find answers themselves - no need for SQL knowledge or waiting on analysts. For example, they can instantly visualize metrics like the top five selling products, with revenue figures formatted as $1,234.56.
Step 1: Define Business Metrics and Context
Start by mapping table relationships and defining key metrics, such as revenue, conversion rates, or pipeline performance. Querio’s AI can suggest logical connections - like linking your sales table to your product table via product_id - which you can accept or tweak. For a retail business, you might define "Last Month" as the prior 30 days (e.g., December 1–31, 2025, using MM/DD/YYYY format) and "Top Selling Products" as items ranked by total sales volume.
To create clarity across teams, add a glossary of terms. For example, if "Q3 revenue" always refers to sales from July through September, everyone - from finance to product teams - will work with the same understanding. Granular permissions can also be set up, allowing different teams to access the definitions they need while your data team retains control over governance.
Step 2: Ensure Data Consistency Across Teams
A semantic layer ensures that metrics remain consistent across all teams, eliminating the need for reconciliation meetings caused by mismatched numbers.
Before rolling out your semantic model organization-wide, test it with sample queries. For example, ask, "What’s our pipeline conversion by source?" and confirm the results align with expectations. Once validated, lock essential definitions in workspaces so teams can easily reference them. For customer-facing applications, you can embed the semantic layer via APIs to provide real-time visualizations. These visualizations maintain U.S. formatting standards and ensure customers see the same reliable metrics your internal teams use.
With these unified definitions in place, you’re ready to create dashboards that deliver insights in real time - accurate, consistent, and accessible.
Create KPI Dashboards and Automated Reports
With a solid semantic layer in place, you can build dashboards that showcase key metrics instantly for both executives and customers. Querio's intuitive drag-and-drop interface makes it easy to arrange charts, add filters, and create interactive views in just minutes. For instance, an executive dashboard might highlight quarterly revenue growth (e.g., +15% year-over-year to $5,200,000) using pie charts to break down performance by product segment. Meanwhile, a customer-facing dashboard could present real-time engagement metrics like average session duration and retention rates, giving clients immediate insights into how they’re interacting with your service.
These dashboards connect directly to your data warehouse. With cross-filtering, clicking on one region of a chart automatically updates all related visualizations. This eliminates the hassle of exporting spreadsheets or manually refreshing reports, replacing those time-consuming tasks with instant updates.
From there, you can customize dashboards to focus on the KPIs that matter most to each stakeholder.
Build Custom Dashboards
Start by identifying the KPIs that resonate with your audience. For example, a sales team might prioritize tracking monthly recurring revenue, formatted as $1,250,000. A product team, on the other hand, could focus on user churn, calculated as (lost customers / total customers) × 100%. Choose the most relevant metrics, select the best visualizations (e.g., line charts for trends or bar graphs for comparisons), and apply filters tailored to specific roles. Preview your dashboard to ensure accuracy and avoid common dashboard pitfalls, then securely share it with as many viewers as needed - without incurring extra per-user costs.
Automate Scheduled Reports
After creating your custom dashboards, take it a step further by automating reports. Manual reporting eats up valuable time, but Querio simplifies this process. From any dashboard, you can schedule reports to be sent automatically. Just click "Automate Report", set the frequency (daily, weekly, or monthly), specify the delivery time - say, every Monday at 9:00 AM EST - choose the format (like a PDF with dates in MM/DD/YYYY format), and add recipients via email or Slack. Whether it’s a weekly engagement summary or a monthly churn analysis, stakeholders receive the information they need without you lifting a finger. This ensures everyone stays informed effortlessly.
Embed Insights into Customer-Facing Apps
After setting up dashboards and automated reports for your internal teams, the next logical step is to extend those insights directly to your customers. With Querio, you can integrate embedded analytics tools into your web portals, mobile apps, or any customer-facing platform. This turns your product into a self-service insights hub, allowing customers to explore their own data with ease.
Embedding these insights is simple. Start with iframe snippets: just copy the embed URL, include authentication tokens, and paste it into your app. For more advanced customization, Querio offers a React SDK and JavaScript API, giving you control over branding, layout, and user experience. Customers access live data through secure, read-only connections, with row-level security ensuring they only see their own information. Once embedded, you can take it a step further by adding AI copilots to elevate customer interactions.
Add AI Copilots for Customer Questions
Querio's AI copilots let your customers ask questions in plain English and get instant, data-driven answers. Forget complicated menus or SQL queries - customers can simply type something like, "What’s my spending trend this quarter?" and instantly see a chart showing $5,200 spent, broken down by category. This boosts customer independence, reduces routine inquiries for your support team, and speeds up decision-making.
The setup is quick - deploy in under 30 minutes. Generate an embed code from Querio’s share menu, configure authentication with JWT tokens, and integrate it into your app. The AI copilot connects directly to your semantic layer, ensuring all responses are accurate and based on governed data. According to industry benchmarks, AI-powered analytics tools can speed up decision-making by an impressive 50-70%.
Provide Real-Time Visualizations
Beyond conversational queries, you can enhance your app with live dashboards that update automatically as data changes. For example, a SaaS company might showcase uptime metrics like 95% or engagement trends with numbers such as 1,250 active users. Customers can drill down into details, apply filters, or adjust timeframes - all without leaving the app.
"What used to be a week-long process now takes minutes." - Jennifer Leidich, Co-Founder & CEO, Mercury
These embedded visualizations use the same drag-and-drop tools you’ve already utilized for internal dashboards, but they’re tailored to meet the needs of your customers. For instance, a retail company integrated Querio charts into its customer portal, allowing users to track their spending patterns and make proactive budgeting decisions. The result? A 25% drop in customer churn, as users discovered more value through actionable, real-time insights.
Use AI Python Notebooks for Advanced Analysis
Python notebooks take your data analysis to the next level, offering flexibility and depth beyond what dashboards and charts can provide. Sometimes customers need more than just visualizations - they need detailed, customized insights. Querio's native Python notebooks make this possible without requiring additional tools or complicated coding. By combining SQL and Python in a single workspace, analysts can query data, perform calculations, and create visualizations all in one seamless environment.
A standout feature is the built-in AI co-pilot, which acts as a coding assistant. It helps with everything from writing SQL queries and generating scripts to debugging and interpreting results. This means even analysts with limited programming experience can tackle complex customer requests - like forecasting revenue or segmenting user behavior - quickly and efficiently. In fact, this approach can cut data request backlogs by up to 80%, freeing your team to focus on higher-priority tasks instead of repetitive data queries.
Run Complex Analysis on Governed Data
Querio's notebooks leverage a shared semantic layer to ensure that all analyses use the same reliable, governed data as your dashboards. Analysts can pull in customer metrics, apply custom Python functions for advanced statistical models, and visualize the results - all without leaving the workspace. For example, if a customer wants to know, "Which product features are linked to higher retention rates?" your analyst can run a correlation analysis and instantly create a chart to show the connection between feature usage and customer retention.
Security is a top priority. Querio's notebooks use read-only connections and comply with key standards like SOC 2 Type II, GDPR, HIPAA, and CCPA, ensuring that customer data stays protected. Analysts can open a notebook, write the code (or let the AI assist), and deliver actionable insights - often in just hours instead of weeks. This integration bridges the gap between standard reporting and deeper, more detailed analysis.
Speed Up Analysis with AI Automation
How AI is transforming data analytics in Querio's notebooks transforms what used to take weeks of manual coding into quick, efficient workflows. Just describe your needs - like "monthly sales for 2024 by region, sorted from highest to lowest" - and the AI generates the code instantly. This not only speeds up the process but also ensures faster, more accurate responses to customer requests.
Recurring analyses are also a breeze with the ability to schedule notebooks to run hourly, daily, or weekly. Whether it's churn risk reports or inventory forecasts, your team can keep data up to date without lifting a finger. As Enver Melih Sorkun, Co-founder & CTO of Growdash, explains:
"It's not just about saving time and money, it's about making data accessible."
With AI-powered notebooks, your team can handle even the most complex queries, reducing the need for specialized data engineers while delivering fast, accurate insights that keep customers happy.
Conclusion
You don’t need a massive engineering team to deliver quick, actionable insights to your customers. Querio combines all the tools you need in one place: secure live data connections, a shared semantic layer, custom dashboards, embedded analytics tools, and AI-powered Python notebooks. Define your metrics once, and ensure everyone - from analysts to your end users - accesses the same reliable, well-governed data.
Companies leveraging AI-driven insights report a 25% boost in customer satisfaction, allowing teams to shift their focus from repetitive tasks to more strategic initiatives. Whether it’s embedding real-time visualizations into customer-facing applications or automating routine reports, Querio empowers you to provide answers in seconds rather than weeks.
"What used to be weeks, now takes minutes!" - Jennifer Leidich, Co-Founder & CEO, Mercury
Customers today demand fast, precise, and data-backed answers. With Querio’s read-only connections, SOC 2 Type II compliance, and AI copilots that understand plain English, you can meet those expectations while delivering insights at lightning speed.
FAQs
How does Querio protect data and ensure compliance with regulations like GDPR and HIPAA?
Querio puts data security and regulatory compliance front and center. To protect sensitive information, the platform employs robust safeguards like role-based access controls, end-to-end encryption (covering both data in transit and at rest), and detailed audit logs that meticulously track user activity.
Beyond security, Querio equips businesses with tools to navigate compliance requirements for major frameworks such as GDPR in the EU and HIPAA in the U.S. Features like automated compliance reporting and governance tools simplify secure data management while maintaining transparency. These measures empower businesses to deliver real-time insights with confidence and accountability.
How do I set up Querio to provide real-time insights for my customers?
Setting up Querio to deliver real-time insights you can act on is a simple process. Begin by linking Querio to your live data source - this could be a cloud warehouse like Snowflake or BigQuery - using a read-only service account. This connection allows the platform to continuously access fresh data, ensuring your insights are always current.
Once connected, focus on preparing your data. Perform quality checks, eliminate duplicates, and validate data formats to maintain accuracy. Establish a semantic layer with consistent business metrics and terminology, so natural-language queries map correctly to the underlying calculations. With Querio’s AI-powered tools, you can convert plain-English questions into live queries and get instant visualizations.
To tailor the experience, personalize your dashboards with role-specific views, real-time widgets, and automated alerts. Implement strong security measures, such as SOC 2 compliance and row-level access, to protect your data. After thorough testing and fine-tuning, launch the platform to equip your team and customers with fast, data-driven decision-making capabilities.
How can Querio's AI copilots help businesses deliver real-time insights to customers?
Querio's AI copilots help businesses give their customers instant, personalized insights by enabling them to ask simple, plain-English questions. The answers? Clear, visualized, and pulled directly from live data. This means customers can get real-time information tailored specifically to their needs, without any hassle.
With these tools, businesses can transform customer interactions, speed up decision-making, and improve the overall customer experience. Data-backed insights are always just a question away, making it easier than ever to provide meaningful, on-demand support.
Related Blog Posts


