Business Intelligence
Embedding Analytics in React: Full Tutorial
Step-by-step guide to embedding secure, customizable analytics and AI-driven charts into React apps using an SDK, tokens, and best practices.
Embedding analytics into React apps transforms data interaction by integrating real-time insights directly within the app. This tutorial walks you through setting up Querio, an AI-driven analytics platform, to seamlessly embed dashboards and charts into your React projects. Querio connects to your data warehouse (e.g., Snowflake, BigQuery, Postgres) and enables natural language queries, making data accessible to both technical and non-technical users.
Key Steps:
Setup Requirements:
Install Node.js, npm/yarn, and set up a React project.
Install Querio SDK:
npm install @quotientjs/react.Securely store API keys in environment variables.
Integration:
Wrap your app in the
QuerioProviderto enable analytics functionality.Embed dashboards and charts using Querio's
Chartcomponent.
Customization:
Use Querio’s theme tokens to ensure visualizations match your app’s design.
Implement responsive designs and customize chart features like axes and legends.
Security:
Generate secure tokens on the backend to protect API keys.
Apply Row-Level Security (RLS) for data access control.
Advanced Features:
Enable AI-driven charts for natural language queries.
Embed Python notebooks for deeper analysis.
Automate KPI reporting with Querio’s scheduling tools.
Querio simplifies embedding analytics while maintaining embedded analytics security and compliance (SOC 2 Type II). By integrating these tools, your team saves time, improves decision-making, and enables users to interact with data directly within your React app.
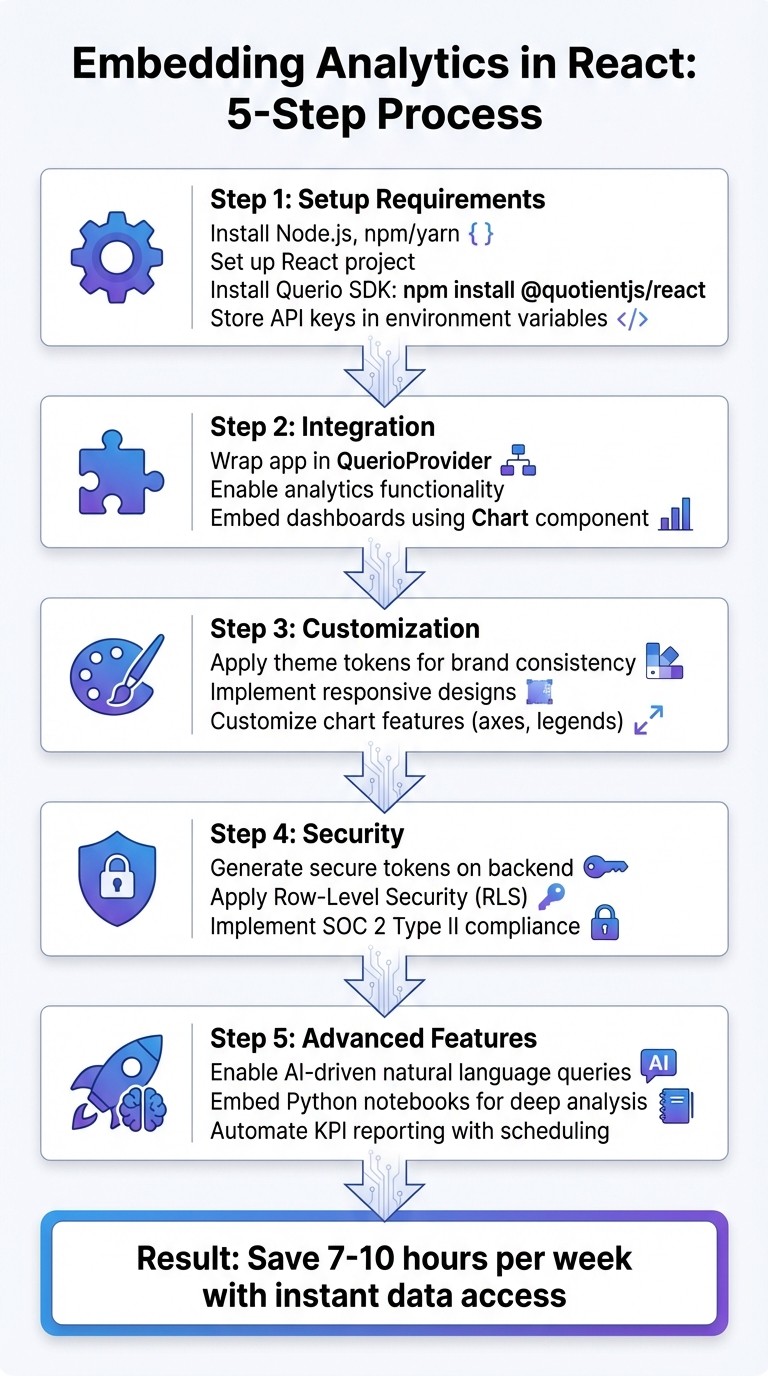
5-Step Process to Embed Analytics in React with Querio
What You Need Before Starting
Before diving in, make sure your development environment is ready. You'll need Node.js and npm (or yarn) installed to handle dependencies and run your React project. To confirm everything is set up, run node -v and npm -v in your terminal. If both commands return version numbers, you're good to go.
You'll also need a React project up and running. Use a modern build tool like Vite or Create React App to streamline the setup process.
Technical Requirements
Here’s a quick rundown of the tools and libraries you’ll need:
Requirement | Details |
|---|---|
Runtime | Node.js (latest stable version) |
Package Manager | npm or yarn |
Frontend Library | React (TypeScript support is recommended) |
Main SDK |
|
Styling |
|
To integrate React with @questlabs/react-graphs, install the package. This will also pull in ECharts as a dependency. Don’t forget to import the SDK's CSS file into your main application file - this step is crucial for rendering charts correctly.
Finally, make sure you’ve created a Querio account to access the credentials you’ll need.
Setting Up Your Querio Account
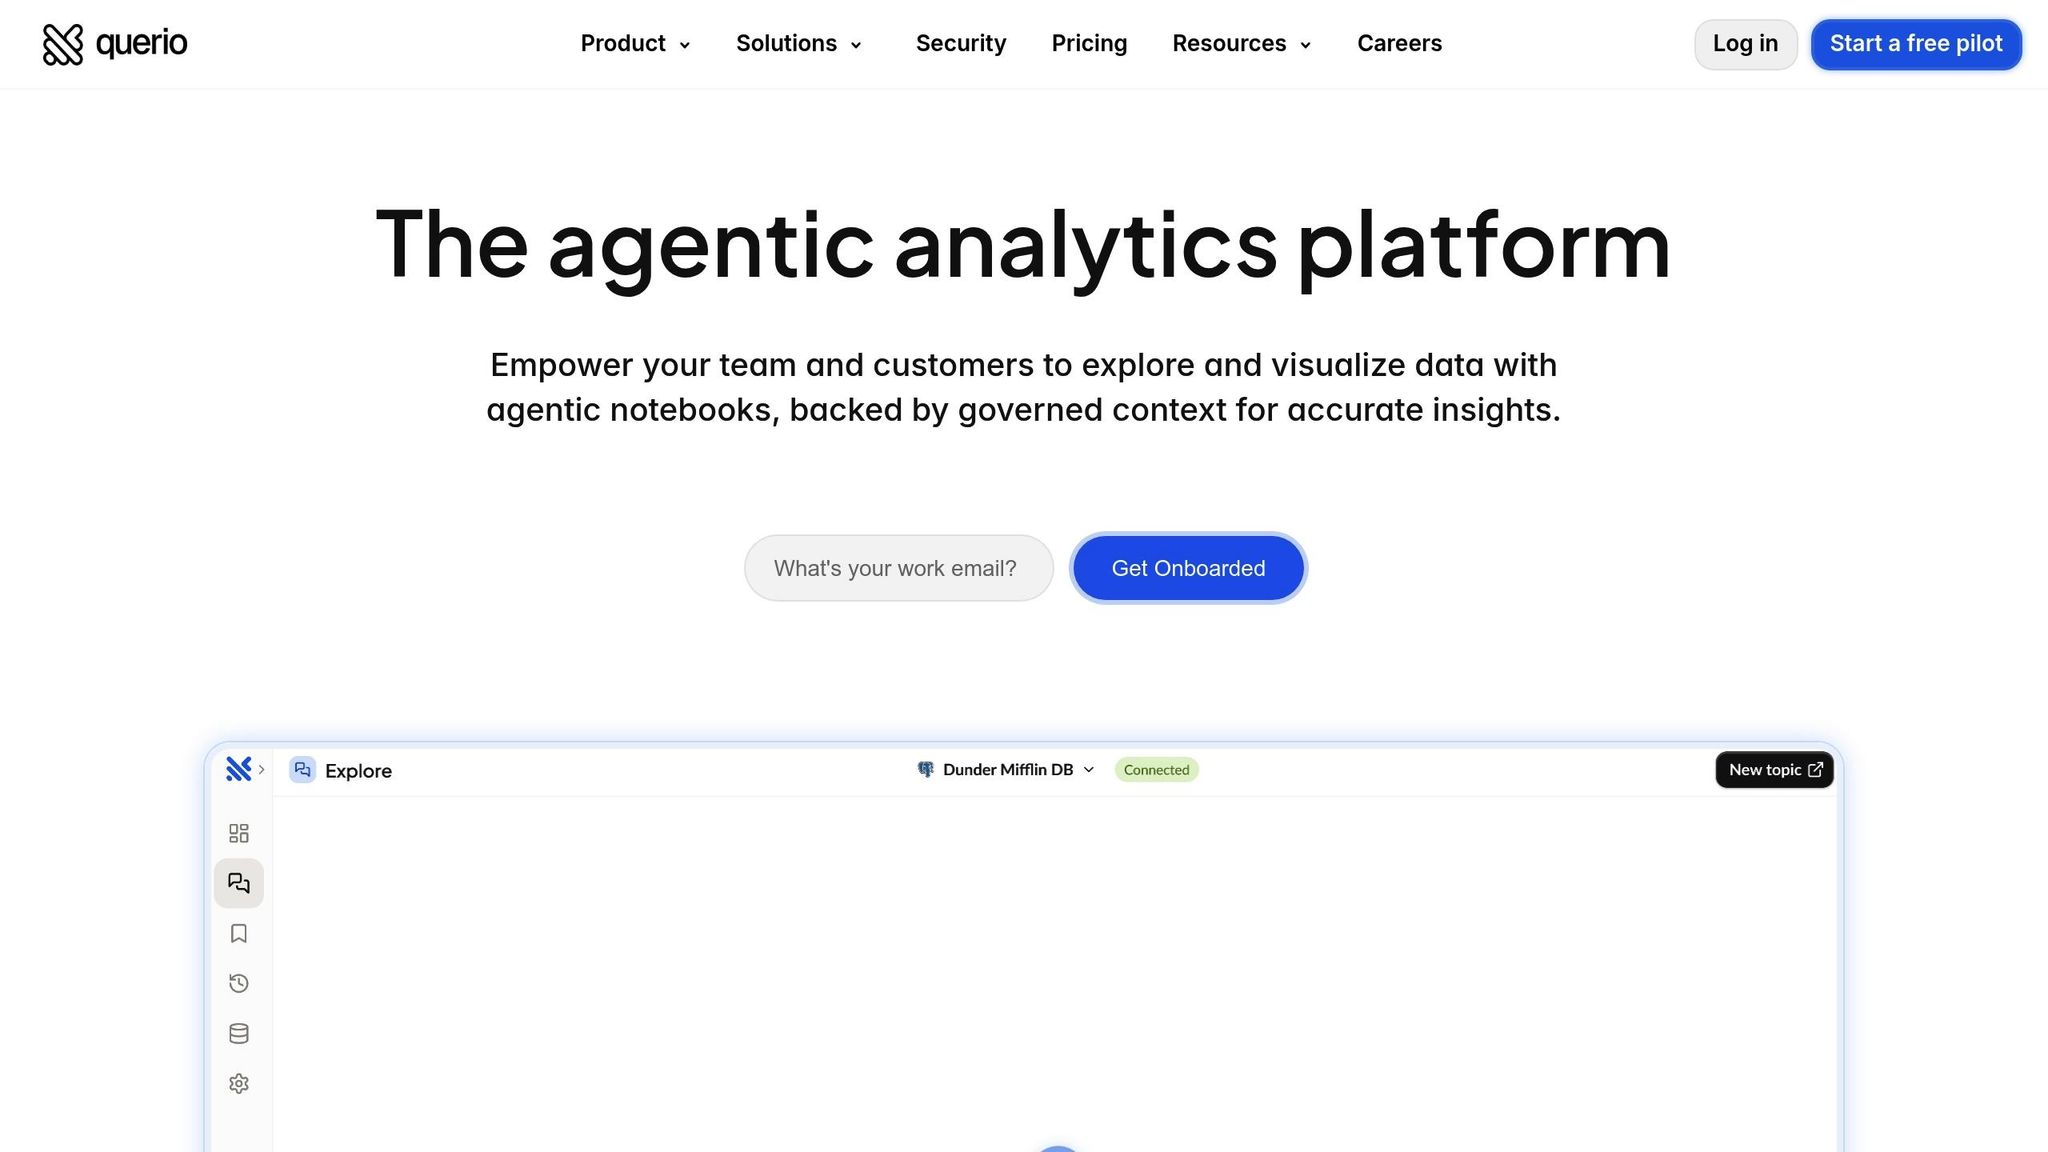
Head over to Querio.ai and select "Start a free pilot" to create an account. Once you're signed up, connect Querio to your data warehouse - whether you’re using Snowflake, BigQuery, or Postgres. Querio uses read-only access to ensure your data remains secure while automatically mapping your database for AI-driven insights.
After linking your data source, go to the Querio dashboard to generate your API key and embed token. These credentials are essential for embedding analytics into your React app, so make sure to store them as environment variables to keep them secure. Additionally, you’ll receive theme tokens and access to Headlines APIs, allowing you to tailor visualizations to match your app’s design system seamlessly.
Installing Querio in Your React Project
Here's how to integrate the Querio SDK into your React application.
Installing the Querio SDK
To get started, navigate to your project directory and run the following command:
If you're using Yarn, use this instead:
These commands will install the SDK along with the necessary charting libraries.
Next, create a .env file in your project's root directory (if you don't already have one). Inside this file, add your API key. Use the appropriate naming convention based on your build tool: VITE_QUOTIENT_API_KEY for Vite projects or REACT_APP_QUOTIENT_API_KEY for Create React App. Never hard-code credentials directly in your source files, as this could expose sensitive information when pushing code to repositories.
When generating your API key in the Querio dashboard, make sure to include localhost:3000 in the "Allowed Origins" for local development. Later, you'll need to add your production domain to avoid CORS issues during deployment.
Once that's done, you'll need to configure your app to use the QuerioProvider.
Setting Up QuerioProvider
Locate your main application file - this is usually App.jsx or App.tsx. At the top of the file, import the provider:
Wrap your entire application with the <QuotientProvider> component and pass in a clientOptions object containing your API key. For example:
autoTrackPageViews={true}: Automatically tracks page navigation.debug={true}: Enables real-time logs of analytics events in your browser's console during development.
The provider handles persistent identifiers using localStorage and sessionStorage. Once set up, all components in your app will have access to Querio's context without requiring additional configuration.
Now, let’s confirm everything is working as expected.
Confirming the Setup Works
To verify the setup, enable debug mode, refresh your browser, and check the developer console. You should see logs for API calls and event tracking details.
For further confirmation, call the following method programmatically:
A successful response will return your business ID.
Finally, open the Querio dashboard and navigate to Analytics → Events. As you navigate through your app, live page views should appear here. If no events show up, double-check your API key in the environment variable and ensure your domain is listed under "Allowed Origins."
Adding Dashboards and Charts to Your App
Once your Querio setup is ready, you can start embedding dashboards and charts directly into your React components.
Building a DashboardEmbed Component
To begin, import the necessary CSS and components at the top of your file:
The imported CSS ensures your visualizations are styled correctly. Next, create a reusable component that takes a chartId prop. This chartId is the unique identifier generated in your Querio dashboard when you create a new chart or dashboard:
The onChartLoaded callback activates once data is successfully retrieved, offering a chance to handle loading states or trigger other actions. For more advanced data handling, consider using the useChart hook.
Customizing How Visualizations Look
With your dashboard embed component in place, you can tweak its appearance to align with your app's design. The Chart component offers several props for customization. For example, the height and width props accept both strings (like '100%') and numbers (like 400) to adapt to your layout. For responsive designs, setting resizable={true} allows charts to adjust automatically when the browser window resizes.
If you want a consistent look across all charts, pass a theme object to define colors, fonts, and other design elements that match your app's style. You can also customize specific chart features like axes, legends, and grids using props such as xAxis, yAxis, and legend. To make data more user-friendly, use the formatter function within axis props - for instance, adding dollar signs for currency or formatting dates as MM/DD/YYYY for U.S. audiences.
Securing Your Embedded Analytics
While visual customization is important, securing your analytics is even more critical. Never expose your API key directly. Instead, create a backend endpoint (e.g., /get-embed-token) to generate secure tokens. These tokens should be signed using strong encryption methods, like ECDSA with a P-256 curve, and include user-specific filters and access permissions.
Pass the secure token to your React app instead of the raw API key. Implement Row-Level Security (RLS) to ensure users only see data they’re authorized to access. This is particularly important for multi-tenant applications where different clients may share the same dashboard component. Additionally, include a Time to Live (TTL) in your tokens to limit their validity, minimizing risks if a token is intercepted. Use React's useEffect hook to refresh tokens automatically when they near expiration or when user state changes.
"Authentication is the process by which your identity is confirmed through the use of some kind of credential. Authentication is about proving that you are who you say you are." - Google Cloud Documentation
For iframe-based embeds, always validate the event.origin when using postMessage to facilitate communication between your React app and the embedded content. This step helps protect against cross-site scripting (XSS) attacks.
Using Advanced Analytics Features
Expanding on the earlier integration of dashboards and charts, advanced features take your React application to the next level. These tools make data interaction more dynamic, enabling Querio to deliver real-time insights while improving operational workflows.
Adding AI-Driven Charts
Querio's natural language querying makes it easy to generate instant visualizations - no SQL required. By pairing the Headlines APIs with theme tokens, you can seamlessly add natural-language analytics to your product. These theme tokens ensure that AI-generated charts automatically align with your app's CSS variables and branding, creating a perfect match with your design system.
Many early adopters have reported saving time and simplifying decision-making processes.
Before deploying AI-driven charts, it’s a good idea for your data team to define the business logic and metrics in Querio's centralized context layer. This ensures consistency across the board - so when someone refers to "Active User", everyone sees the same calculation. Users can also dig deeper by asking follow-up questions in the chat interface, drilling into specific data points before pinning the final visualization to a dashboard.
Embedding Python Notebooks for Deeper Analysis
Querio's Python notebook environment lets you perform advanced analysis using both SQL and Python, without requiring users to write code manually. This feature supports complex workflows while maintaining SOC 2 Type II certification and read-only data access, ensuring your database remains secure.
To embed these notebooks in your React project, use Headlines APIs along with theme tokens to maintain visual consistency. This setup allows technical users to dive into detailed analyses, while non-technical users can stick to natural language queries - all within the same governed platform.
By integrating this deeper level of analysis, you can also automate your KPI reporting.
Setting Up Scheduled Reports for KPIs
After creating dashboards with your key performance indicators, you can automate their delivery to key stakeholders. Start by pinning visualizations to a Board - Querio's dashboard interface - using the drag-and-drop editor to craft a repeatable data story. From there, you can schedule reports to be sent daily, weekly, or monthly, and assign recipients.
Organizations using this feature have cut manual reporting time by over 90%. Querio’s Core Platform starts at $14,000 per year, which includes 4,000 monthly prompts to encourage data exploration. Adding the Dashboards feature is an additional $6,000 annually, unlocking full access to drag-and-drop dashboard creation and automated scheduling tools.
Best Practices for Security and Performance
Building on the integration steps, here are some key practices to secure your analytics and keep performance optimized.
Maintaining Security and Compliance
To protect embed URLs, use secure token generation, least privilege IAM roles, and domain whitelisting. Generate embed URLs strictly on a secure backend, such as AWS Lambda or an API Gateway endpoint. When configuring IAM roles for your backend, grant only the permissions needed - like generating embed URLs for specific dashboard resources.
Store tokens in session storage to enhance security. Session storage automatically clears when the browser is closed, reducing the risk of unauthorized access. Pair this with domain whitelisting to block unapproved sites from embedding your dashboards, even if a valid token is compromised.
Querio ensures secure, read-only connections to your data warehouse, whether you’re working with Snowflake, BigQuery, or Postgres. Credentials are encrypted, and the platform supports compliance with CCPA, HIPAA, and SOX. For organizations with strict US data residency requirements, Querio offers a self-hosted deployment option to meet those needs.
Improving Load Times and Reliability
Take advantage of SDK event callbacks like onChartLoad, onChartLoaded, and onChartInitialized to manage loading states in your user interface. These callbacks allow you to show spinners during data loads and handle timeouts or errors gracefully. If you're using React's StrictMode, add a small 10ms delay in useEffect hooks to avoid triggering duplicate API calls.
For efficient state management, consider TanStack Query. It simplifies background fetching, caching, and query invalidation, reducing unnecessary data reloads. Additionally, preload visual assets using methods like ensureFontsLoadedAsync() before rendering the analytics view. This prevents layout shifts, improving the user experience and perceived performance. These proactive steps complement Querio’s seamless visual integrations.
Formatting Data for US Audiences
Your embedded analytics should align with US formatting conventions by default. For example:
Display currency with the $ symbol (e.g., $1,234.56).
Format dates as MM/DD/YYYY (e.g., 12/25/2025).
Use commas for thousand separators and periods for decimals (e.g., 10,500.75).
To handle date formatting consistently, use a library like Day.js (version 1.8.15 or later). If you’re creating custom date pickers or input fields, ensure they follow these standards to maintain a consistent experience throughout your application.
Conclusion
Integrating powerful analytics into your React application is straightforward with Querio. By linking it to your data warehouse, setting up the SDK using QuerioProvider, and crafting custom dashboard components, you can deliver a seamless analytics experience. Adding granular access controls and ensuring SOC 2 Type II compliance keeps your application aligned with enterprise-level security requirements.
The real game-changer is enabling AI-powered self-service analytics. Instead of waiting days for reports, your team and end users can simply ask questions in plain English and get accurate, visual answers in seconds. Companies using this approach have seen impressive time savings - up to 7-10 hours per week - and have turned week-long processes into tasks completed in minutes thanks to instant data access.
By cutting down the 9% of work time lost switching between apps, your team can make decisions faster and with greater confidence. Users can interact with data directly, diving into details without ever leaving the familiar React interface.
Once you've mastered the core integration steps from this guide, you can take things further by introducing advanced features like AI-generated charts or Python notebooks. Combining solid technical implementation with intuitive UX design creates a data-driven environment where everyone in your organization can make faster, smarter decisions based on real insights - not guesswork.
FAQs
How does Querio protect data when embedding analytics into React applications?
When embedding analytics into React projects, Querio places a high priority on keeping your data safe. They use end-to-end encryption, secure API connections, and adhere to strict industry standards like GDPR and CCPA to ensure your information stays protected.
On top of that, Querio employs role-based access controls and customizable permissions. These features let you decide exactly who can access or work with specific datasets. This combination of security measures not only protects sensitive information but also ensures you can confidently leverage advanced analytics without compromising data privacy or integrity.
What are the advantages of using AI-driven charts in Querio for data visualization?
Querio's AI-powered charts simplify the way you explore and visualize data by using conversational AI. These charts are designed to deliver insights tailored to your specific context, making it easy to dive deeper into your data and identify trends that matter most.
With real-time analytics paired with user-friendly visuals, teams can make quicker, smarter decisions without compromising on data accuracy or governance. This transforms raw data into clear, actionable insights that help achieve better results.
How do I customize Querio charts to match my app's design and branding?
You can tailor Querio visualizations to match your app's design effortlessly by leveraging its built-in theming and configuration features. First, install the Querio React graph package and import the necessary chart component into your project. Next, create a theme object that represents your brand - defining elements like colors, fonts, and other visual details - and pass it to the chart using the theme prop.
To make the visualizations fit seamlessly, adjust the chart's size and layout either with responsive design techniques or by using the SDK’s layout properties. You can also use event callbacks to tweak styles or update chart options dynamically. These tools give you the flexibility to align Querio visualizations perfectly with your app’s design.
Related Blog Posts


